
Last week’s analysis expected to see further downwards movement for gold, before a second wave correction. Price moved lower before beginning some sideways movement. This is pretty much what was expected.
The wave count remains the same. I can now calculate targets for this correction to end.
Click on the charts below to enlarge.
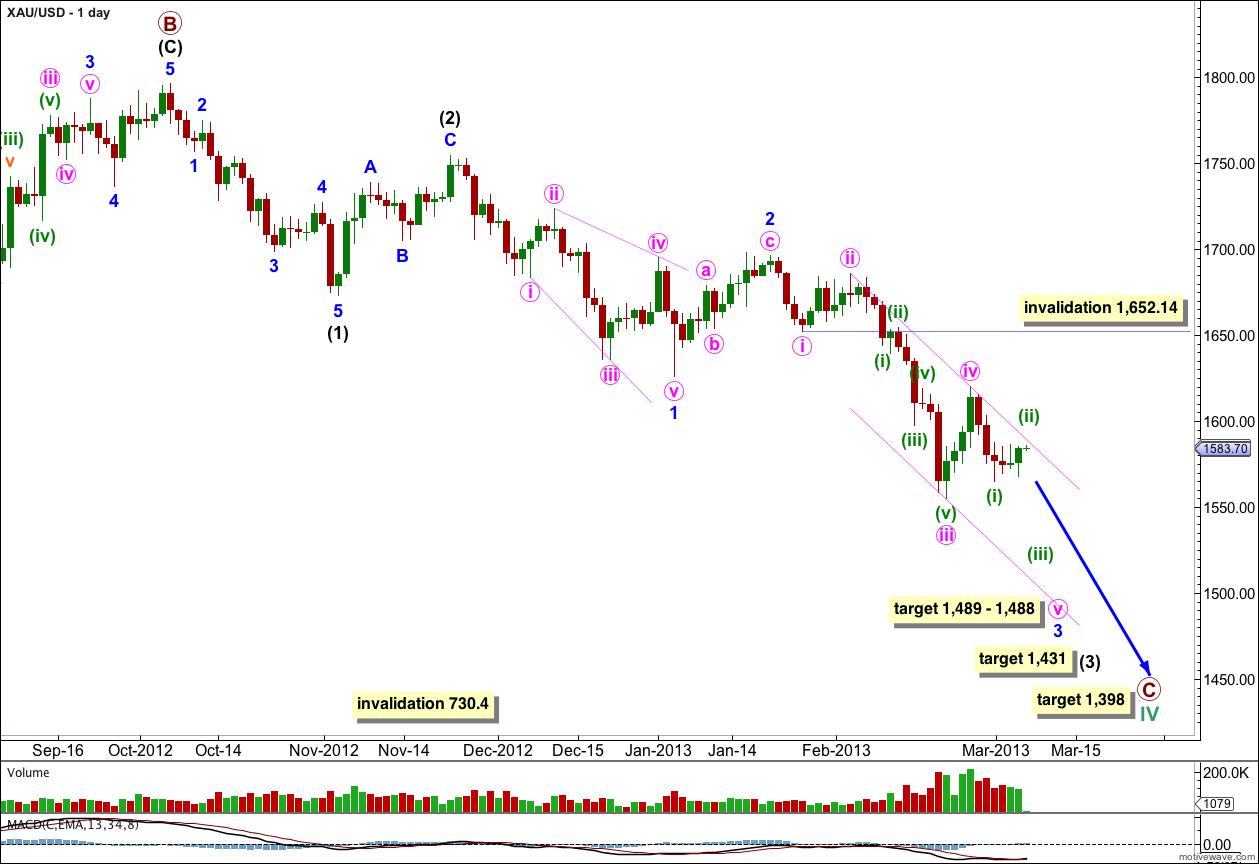
This daily chart focuses on the new downwards trend of primary wave C.
Within primary wave C intermediate waves (1) and (2) are complete. Intermediate wave (3) has begun. Within intermediate wave (3) price may have just moved through the middle of it over the last week. MACD does show an increase in downwards momentum for the middle of minor wave 3 beyond that seen for minor wave 1.
Minor wave 1 was a leading diagonal, and minor wave 2 zigzag was a 55% correction of minor wave 1.
Within the zigzags of intermediate wave (2) and minor wave 2 there are no Fibonacci ratios between the A and C waves.
At 1,488 minor wave 3 would reach 1.618 the length of minor wave 1. At 1,489 minute wave v within minor wave 3 would reach equality in length with minute wave iii.
At 1,431 intermediate wave (3) would reach 2.618 the length of intermediate wave (1). This target is weeks away.
At 1,398 primary wave C would reach equality in length with primary wave A. This target is still weeks to months away.
At this stage minute wave iii is most likely complete and has no Fibonacci ratio to minute wave i. Minute wave iv may not move into minute wave i price territory. This daily wave count is invalidated at minute degree with movement above 1,652.14.
I have redrawn the small parallel channel about minor wave 3. Draw the first trend line from the highs of minute waves ii to iv, then place a parallel copy upon the low of minute wave iii. We may expect minute wave v to end midway within this channel, or about the lower edge. On the way down price is likely to remain contained within this channel.
If momentum increases further for the next downwards wave then minor wave 3 may be extending further. I would move the labeling within it down one degree.
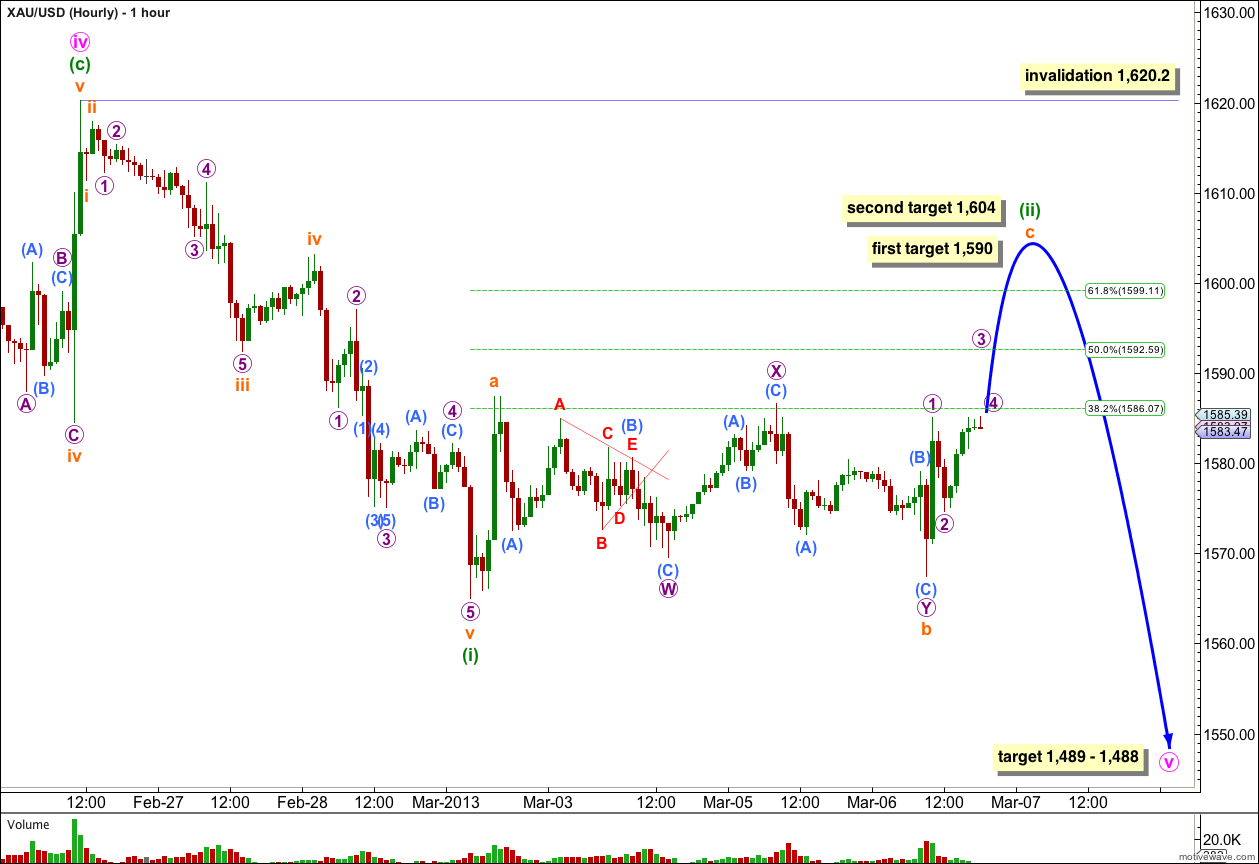
Price moved lower to complete a five wave impulse for minuette wave (i).
Ratios within minuette wave (i) are: subminuette wave iii is 2.23 longer than 2.618 the length of subminuette wave i, and subminuette wave v is 3.08 short of 1.618 the length of subminuette wave iii.
Ratios within subminuette wave v are: micro wave 3 has no Fibonacci ratio to micro wave 1, and micro wave 5 is just 0.18 longer than equality in length with micro wave 1.
So far minuette wave (ii) may be unfolding as a zigzag. Within it subminuette wave b may be a completed double zigzag structure and 89% of subminuette wave a.
At 1,590 subminuette wave c would reach equality in length with subminuette wave a. If price continues to rise through this first target then the next target is at 1,604 where subminuette wave c would reach 0.618 the length of subminuette wave a.
Subminuette wave c must subdivide into a five wave structure.
Minuette wave (ii) has already lasted four days. I would expect it to end in one or two more days and not much more.
Minuette wave (ii) may not move beyond the start of minuette wave (i). This wave count is invalidated with movement above 1,620.20.
The alternate wave count now looks unlikely as downwards movement fell short of the target required for a flat at 1,562. Thus the hourly wave count above will be my only wave count for now.