
Last week’s analysis had two wave counts. The main wave count was invalidated with movement above 1,402.23. The alternate wave count expected more upwards movement for a fourth wave correction at minor degree.
This week I have just the one wave count for you. This correction is unlikely to be complete. We should see further upwards movement.
Click on the charts below to enlarge.
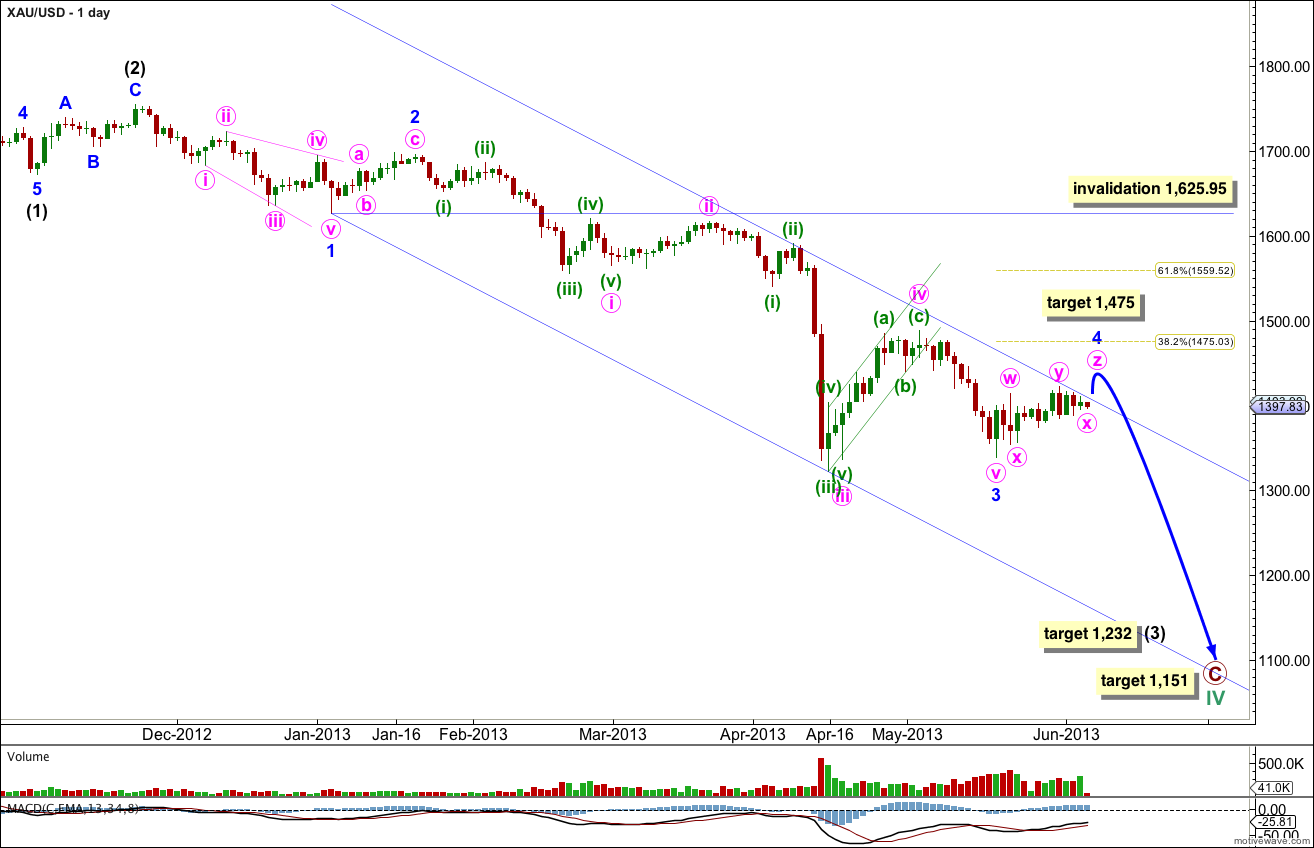
This daily chart focuses on the new downwards trend of primary wave C.
Within primary wave C intermediate waves (1) and (2) are complete. Intermediate wave (3) is underway and may have just passed the middle of it.
Within intermediate wave (3) minor waves 1, 2 and 3 are complete. Minor wave 4 is incomplete.
At 1,232 intermediate wave (3) would reach 4.236 the length of intermediate wave (1).
At 1,151 primary wave C would reach 1.618 the length of primary wave A.
Minor wave 4 may not move into minor wave 1 price territory. This wave count is invalidated with movement above 1,625.95.
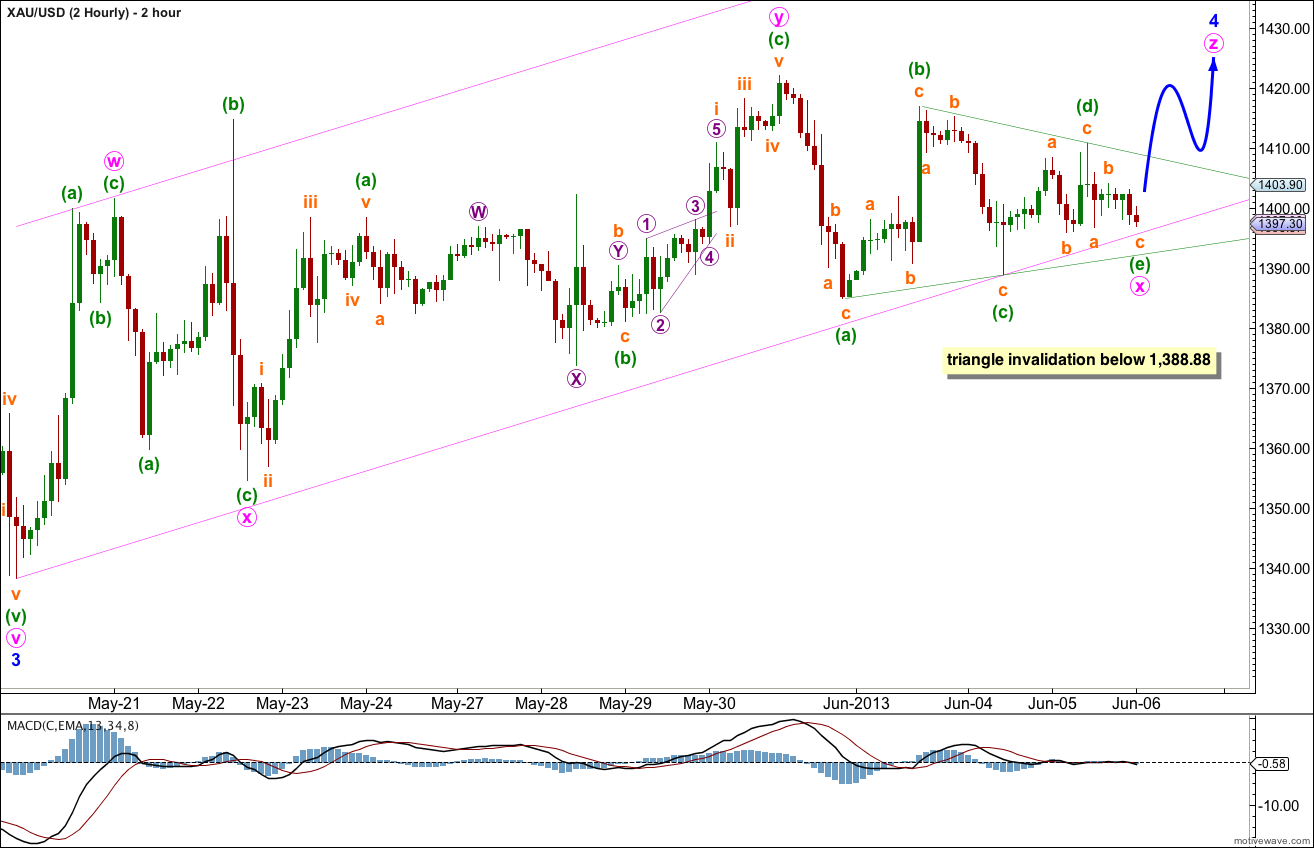
I have considered several possibilities for minor wave 4: a single zigzag with one of the subwaves (either minute wave a or c) a diagonal, or a double zigzag, or a double combination. The only structure which fits is a triple zigzag. So although this is rare it must be what is unfolding.
The purpose of triple zigzags is to deepen a correction when the first one (or two) zigzags did not move price deep enough. This is what is happening here, the structure should trend upwards, which it is.
Within this triple zigzag we have excellent alternation between the two X waves. The first minute wave x is an expanded flat correction. The second minute wave x is unfolding as an unmistakeable contracting triangle.
The triangle for minute wave x is almost complete. When minuette wave (e) within it is over we should expect a sharp upwards thrust for gold as the final third zigzag in the triple unfolds.
At 1,475 minor wave 4 would end at the 0.382 Fibonacci ratio of minor wave 3.
A parallel channel may be drawn about minor wave 4 so far as a best fit. When this channel is very clearly breached by upwards movement then we may have had a trend change.
Extend the triangle trend lines outwards. The point in time at which they cross over may see a trend change.