
Last analysis expected a little more upwards movement from gold to one of two targets, 1,296 or 1,349, before a short term trend change. The trend change would be confirmed with movement below 1,267.60.
Price did move a little higher to 1,300.93, $4.93 above the first target, and may have turned down. We do not have confirmation of this short term trend change yet. We may use the channel on the hourly chart and 1,267.60.
Click on the charts below to enlarge.
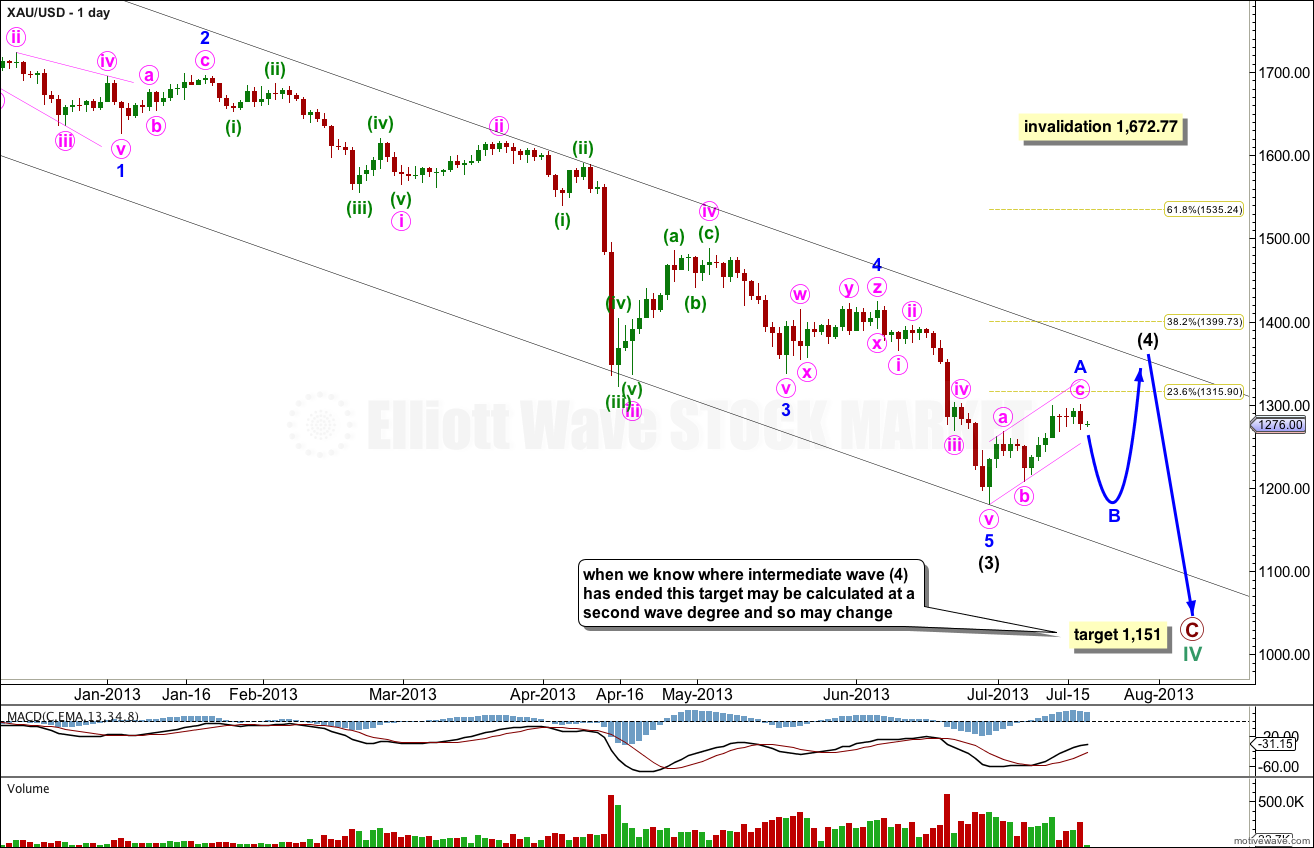
This daily chart focuses on the new downwards trend of primary wave C.
Within primary wave C intermediate waves (1) through to (3) are complete.
Intermediate wave (4) may last about three to six weeks, depending upon what structure it takes. Intermediate wave (2) lasted three weeks and was a deep 66% zigzag. Intermediate wave (4) so far has lasted almost three weeks and I would expect it is incomplete. It is most likely to be a relatively shallow flat, triangle or combination. All these structures are more time consuming than a brief zigzag.
Intermediate wave (4) may end at either the 0.236 or 0.382 Fibonacci ratios. When there is more structure within this fourth wave to analyse then a target for it to end may be calculated.
Intermediate wave (4) may find resistance at the upper edge of the parallel channel drawn here using Elliott’s first technique. Draw the first trend line from the lows of intermediate waves (1) to (3), then place a parallel copy upon the extreme within intermediate wave (3).
Within intermediate wave (4) movement should be very choppy and overlapping. If it unfolds as a running triangle or an expanded flat then within it minor wave B may make a new low below 1,180.40.
At 1,151 primary wave C would reach 1.618 the length of primary wave A. This target is a long term target. When we know where intermediate wave (4) has ended within primary wave C then we may use a second wave degree to also calculate this target, so it may widen to a zone or may change.
Within primary wave C intermediate wave (4) may not move into intermediate wave (1) price territory. This wave count is invalidated with movement above 1,672.77.
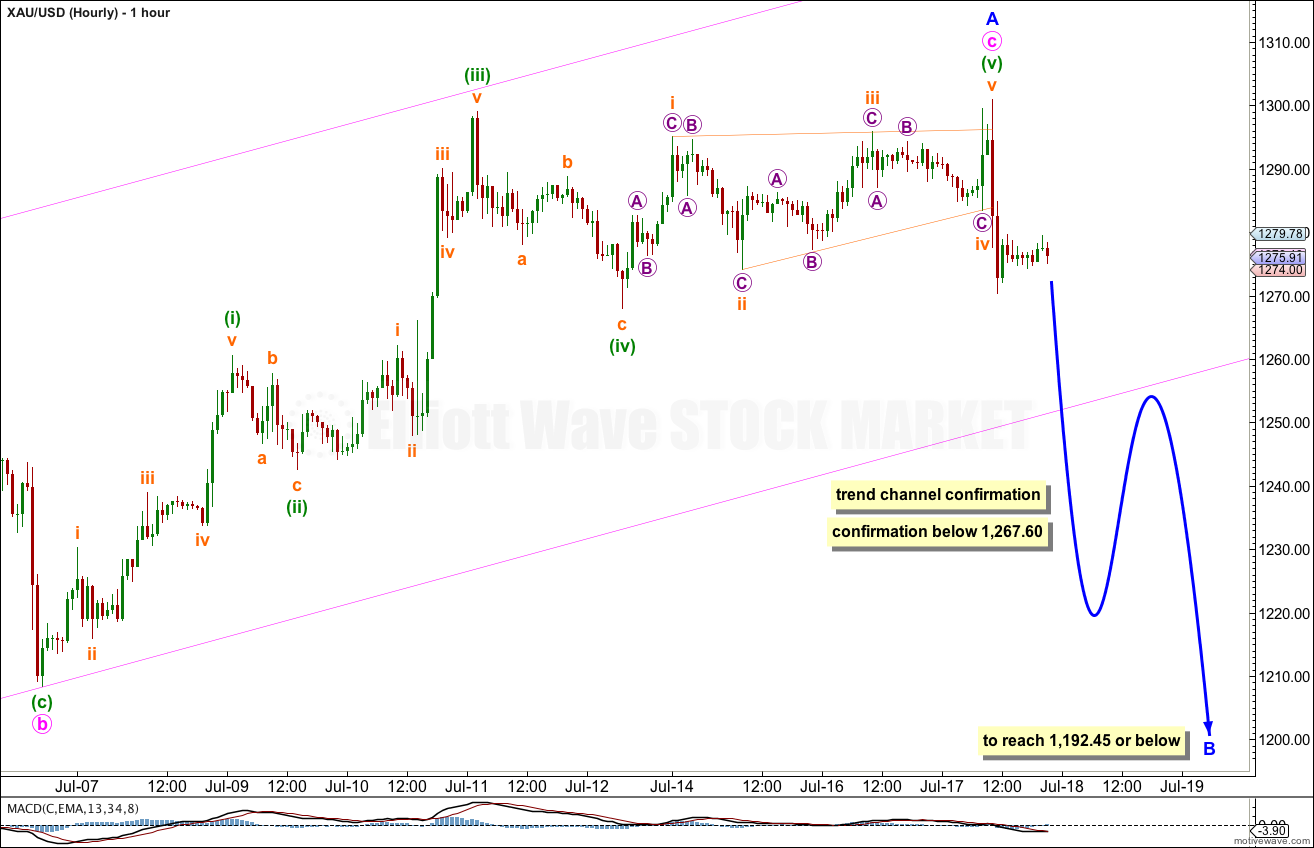
Within intermediate wave (4) minor wave A is probably now complete.
Within minor wave A minute wave c is 5.41 longer than equality with minute wave a.
Ratios within minute wave c are: minuette wave (iii) is 4.22 longer than equality with minuette wave (i), and minuette wave (v) is just 0.71 longer than 0.618 the length of minuette wave (i).
We need to see this parallel channel drawn about minor wave A clearly breached by downwards movement to have confidence in this short term trend change.
If intermediate wave (4) is unfolding as a flat correction then within it minor wave B must reach to a minimum of 90% the length of minor wave A at 1,192.45. Minor wave B may make a new low below the start of minor wave A at 1,180.40 and in fact is reasonably likely to do so because the most common type of flat is an expanded flat which would require minor wave B to reach 105% the length of minor wave A at 1,174.37.
If the next downwards movement fails to reach 1,192.45 or below then there are other structural possibilities for intermediate wave (4). It may be unfolding as a contracting or barrier triangle, or it may be a double zigzag, or a double combination.
All the structural possibilities for intermediate wave (4) at this stage require a three wave structure to unfold downwards which should last a few days and should take price below the parallel channel drawn here on the hourly chart.