
Last analysis main wave count expected more upwards movement. The alternate was not confirmed with a red candlestick or any channel breach.
Again I have two wave counts for you today. They differ only in the degree of labeling for most recent movement. The price point which differentiates them is 1,384.60.
Click on the charts below to enlarge.
Main Wave Count.
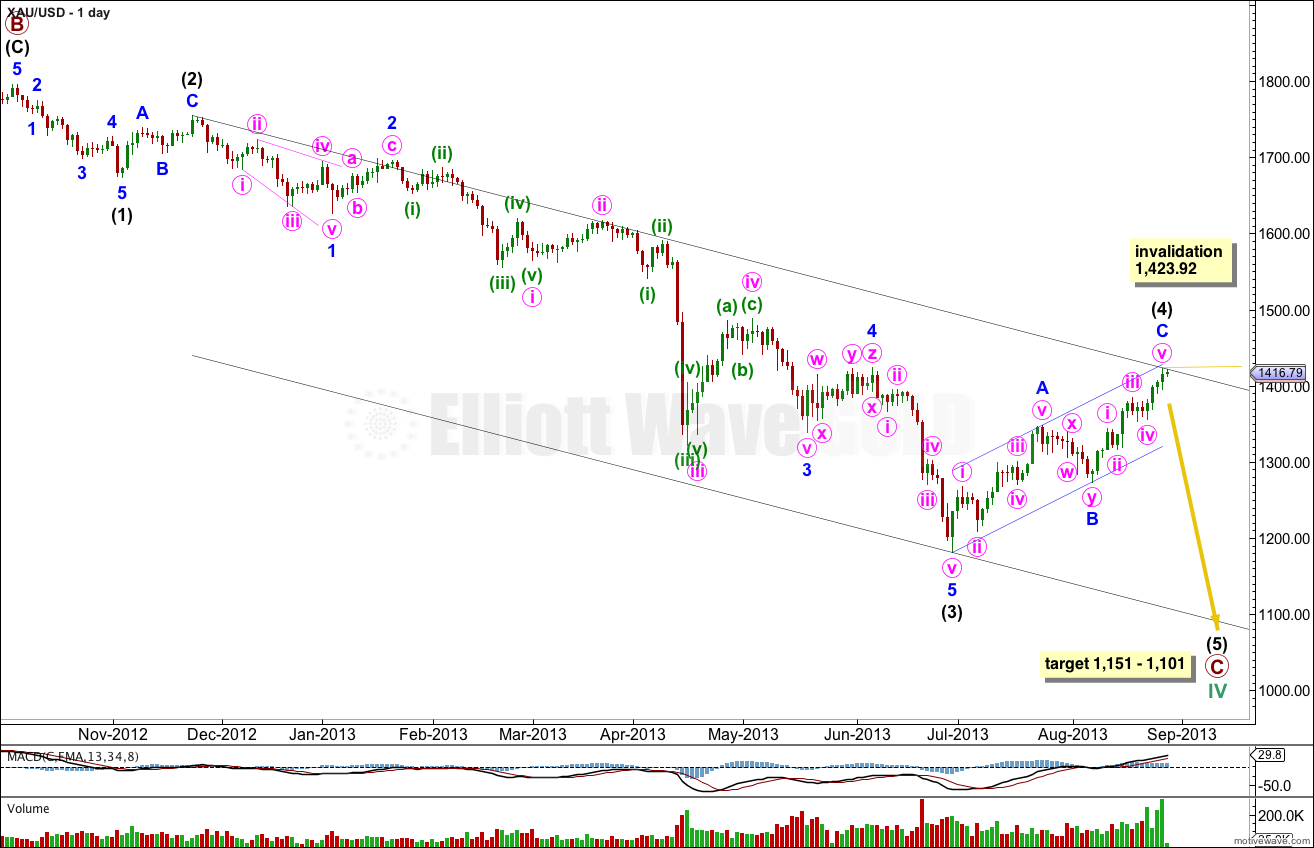
This daily chart focuses on the new downwards trend of primary wave C within a cycle degree wave IV.
Within primary wave C intermediate waves (1) through to (3) are complete.
Intermediate wave (4) so far has lasted a Fibonacci eight weeks and may now be complete. Intermediate wave (2) lasted three weeks and was a deep 66% zigzag. Intermediate wave (4) is shallower at 42%.
I would want to see some confirmation of this wave count before having confidence in it. For confirmation I will look for:
-
1. A red candlestick for the current session.
2. Movement below 1,384.60.
3. Movement below the channel on the hourly chart.
4. Movement below the channel on the daily chart.
At 1,151 primary wave C would reach 1.618 the length of primary wave A. At 1,101 intermediate wave (5) would reach 2.618 the length of intermediate wave (1).
Within intermediate wave (5) no second wave correction may move beyond the start of the first wave. This wave count is invalidated with movement above 1,423.92.
*There is a problem with the data I am using from FXCM. On the daily chart the price point at which minute wave iii within minor wave C within intermediate wave (4) begins is 1,315.92 (14th August, 2013). This makes minute wave iii 68.71 in length. Minute wave v is 68.64 in length, just shorter, so the core Elliott wave rule that states a third wave may not be the shortest is met. However, on the hourly chart there is no low of 1,315.92 on 14th August, 2013, instead the low there is 1,316.05. This makes minute wave iii as seen on the hourly chart (below) 68.54 in length, which is 0.10 shorter than minute wave v (and minute wave i is 71.20 long).
This wave count agrees with MACD, the strongest momentum is within the third wave. There is classic divergence with price trending higher and MACD trending lower, indicating a possible trend change here.
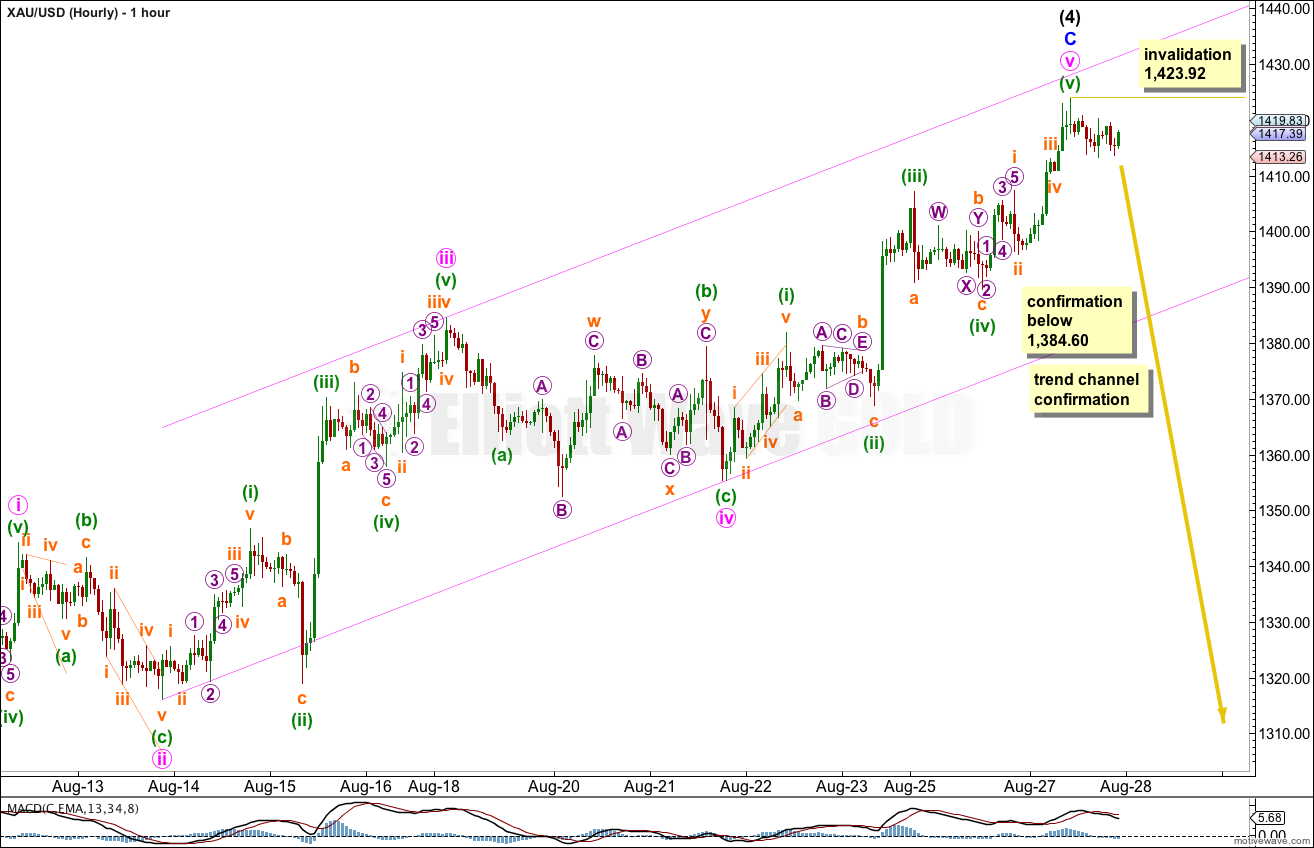
Within minute wave v there are no adequate Fibonacci ratios between minuette waves (i), (iii) and (v).
Draw a parallel channel about minor wave C. Draw the first trend line from the lows of minute waves ii to iv, then place a parallel copy upon the high of minute wave iii. When this channel is clearly breached we shall have some confirmation of a trend change.
Movement below 1,384.60 would invalidate the alternate below and provide some price confirmation of a trend change.
Alternate Wave Count.
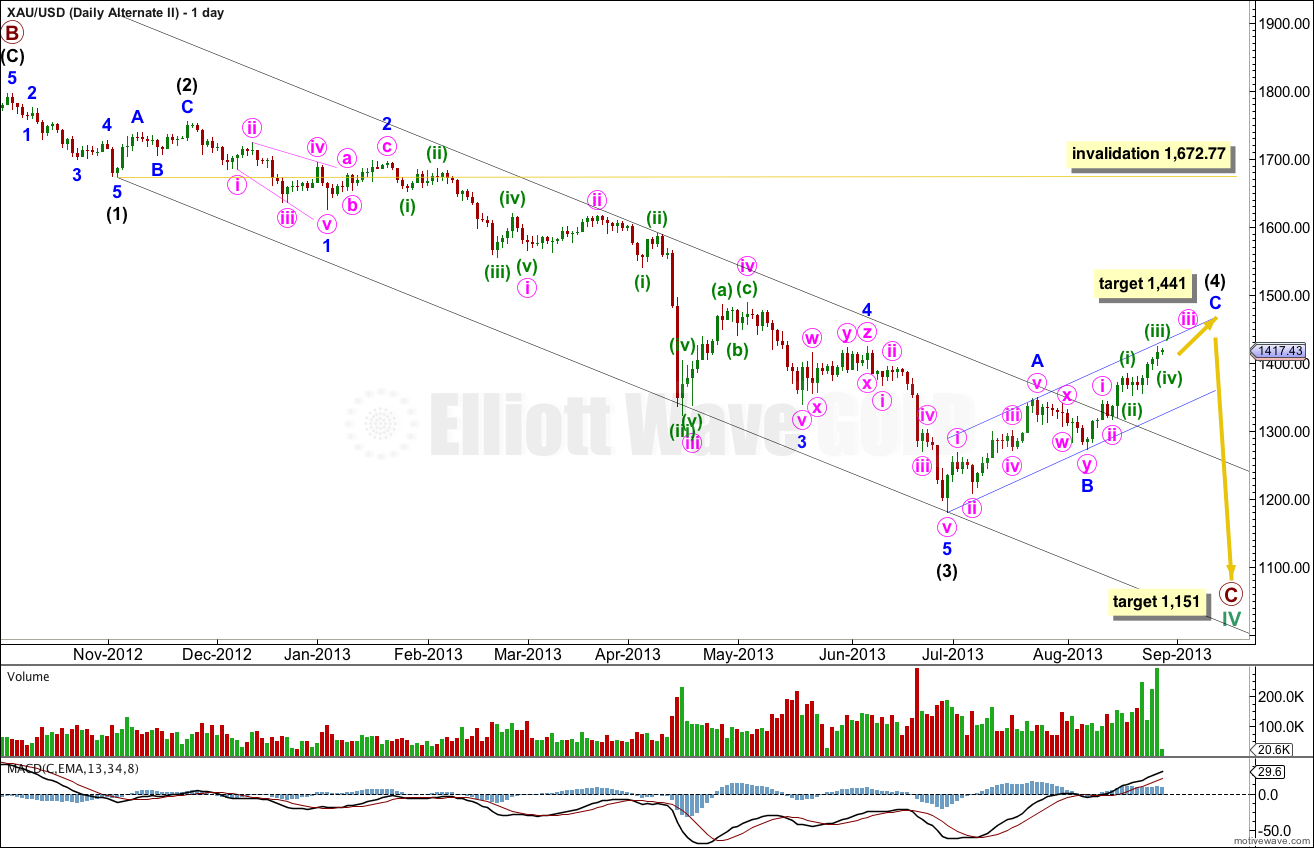
If we simply move the degree of labeling within recent movement within intermediate wave (4) all down one degree, this structure may be incomplete.
Minor wave C may be incomplete and minute wave iii within it may be extending.
This wave count resolves the problem of the length of minute wave iii within minor wave C being 0.10 too short on the hourly chart, but it still leaves the problem of inaccurate data!
At 1,441 minor wave C would reach equality in length with minor wave A. Minor wave C may overshoot the parallel channel containing intermediate wave (4).
Within primary wave C intermediate wave (4) may not move into intermediate wave (1) price territory. This wave count is invalidated with movement above 1,672.77.
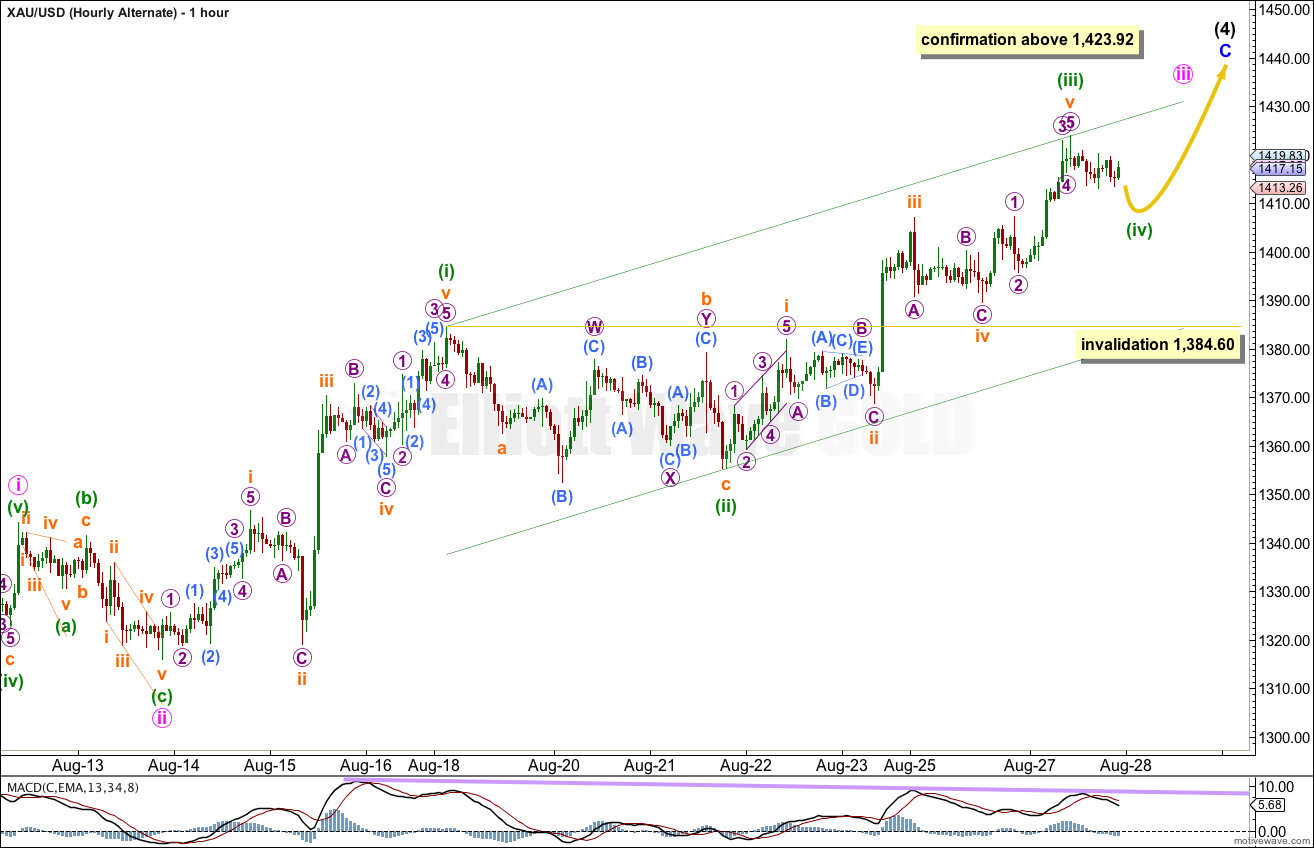
If minute wave iii within minor wave C is extending, then within it minuette wave (iii) is just 0.06 longer than equality with minuette wave (i).
Minuette wave (iv) is likely to be incomplete. It may not move into minuette wave (i) price territory. This wave count is invalidated with movement below 1,384.60.
We may draw a parallel channel about minute wave iii: draw the first trend line from the highs of minuette waves (i) to (iii), then place a parallel copy upon the low of minuette wave (ii). Expect minuette wave (v) to find resistance at the upper edge of this channel.
This wave count would be confirmed with movement above 1,384.60.
The biggest problem with this wave count, and the reason why it is my alternate, is that it does not agree with MACD. The first wave within minute wave iii has stronger momentum than the middle of the third wave.