
The small channel on the hourly chart was breached, but price has moved sideways not higher.
It looks like we may be seeing a small triangle complete. When this is done we should see a brief sharp downward thrust, to be followed by the resumption of upwards movement.
Click on the charts below to enlarge.
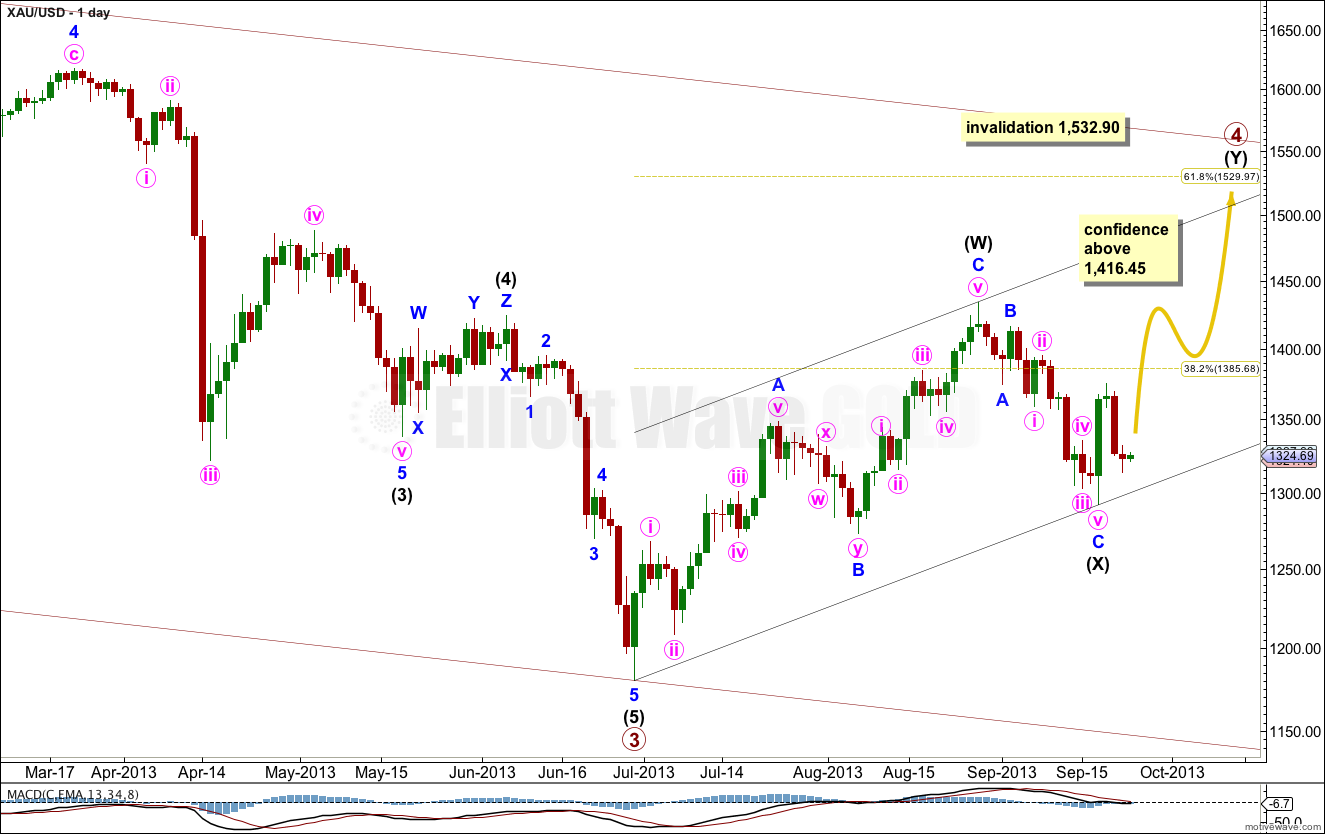
There are still several possible structures for primary wave 4. So far we have a three down from the high at 1,433.83. This three down is less than 90% the length of intermediate wave (W) so it cannot be a B wave within a flat over there. This structure may be a double zigzag or double combination. In a double combination the second structure labeled intermediate wave (Y) may be either a flat or triangle.
It is most likely at this stage that primary wave 4 is continuing as a double zigzag. Intermediate wave (Y) is most likely to be a zigzag.
Primary wave 2 was a deep 68% regular flat correction lasting 54 weeks. Given the guideline of alternation we may expect primary wave 4 to continue for longer than it has so far, possibly for another nine weeks to last a Fibonacci 21 (give or take one week either side of this). If it completed as a double zigzag there would be nice alternation in structure with primary wave 2.
Primary wave 4 has already passed the 0.382 Fibonacci ratio, so it may end about the 0.618 Fibonacci ratio of primary wave 3 at 1,529.97. It should find resistance at the upper edge of the parallel channel drawn here using Elliott’s first technique.
Primary wave 4 may not move into primary wave 1 price territory. This wave count is invalidated with movement above 1,532.90.
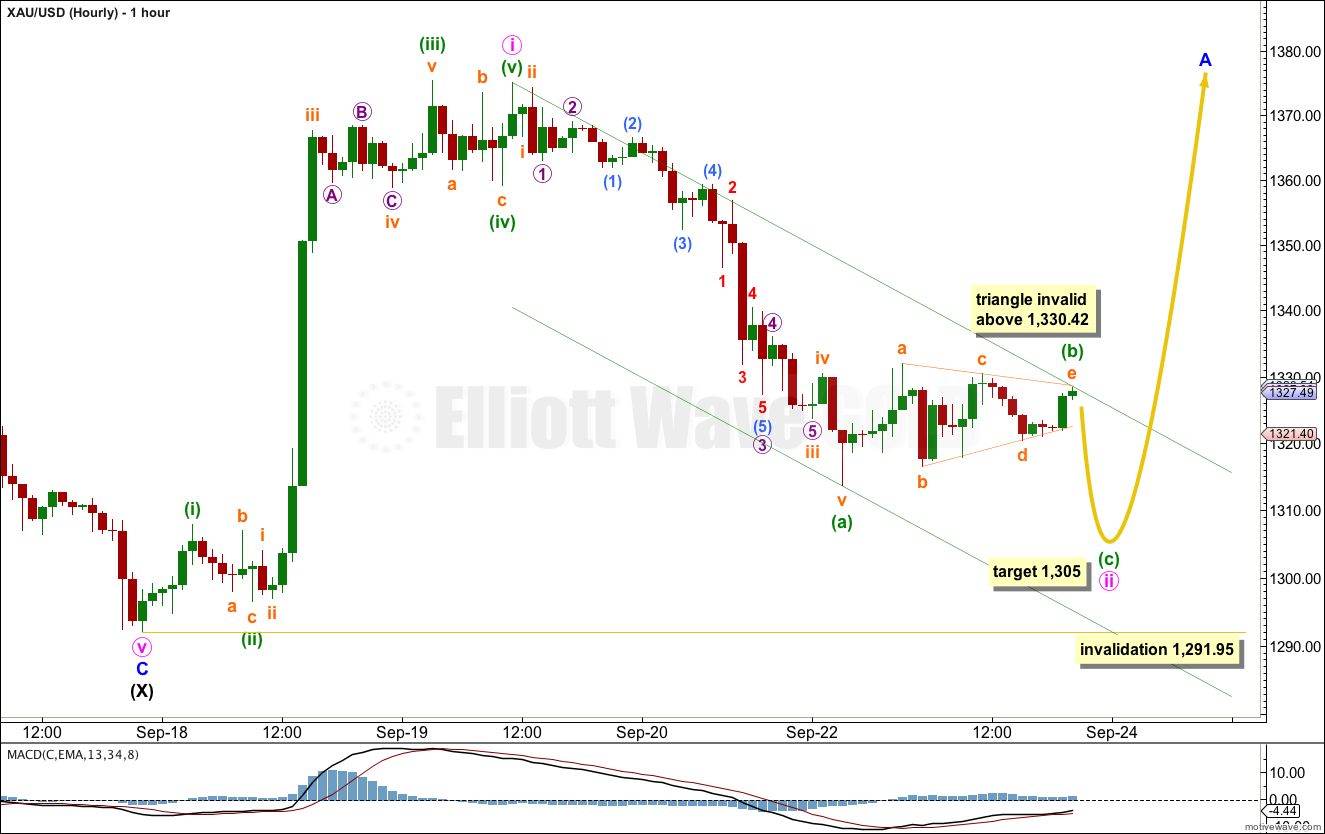
Last analysis expected that downwards movement was most likely over as minute wave ii had reached the 0.618 Fibonacci ratio of minute wave i. But it is not over and price moved lower.
Sideways movement has breached how I had previously drawn the channel, but it is not a convincing start for a third wave. This sideways movement subdivides easily as a series of corrective zigzags, and so a triangle is likely to be completing. Subminuette wave e may have just completed. Subminuette wave e may not move beyond the end of subminuette wave c above 1,330.42.
When the triangle is completed I would expect a short, sharp downwards thrust. Downwards movement may find support at the lower edge of the channel drawn about minute wave ii using Elliott’s technique. At 1,305 minuette wave (c) would reach 0.382 the length of minuette wave (a).
Draw the channel from the start of minuette wave (a) to the end of minuette wave (b). Place a parallel copy upon the end of minuette wave (a). If minuette wave (b) moves a little higher redraw the channel.
If the triangle remains valid and price moves out of it downwards, then extend the triangle trend lines out to the right. At the point in time where those trend lines cross over look out for a trend change.
When minuette wave (c) is complete then use the channel also to confirm a trend change. When price is above the channel then minute wave iii should have begun.
Minute wave ii may not move beyond the start of minute wave i. This wave count is invalidated with movement below 1,291.95.
Alternate Daily Wave Count.
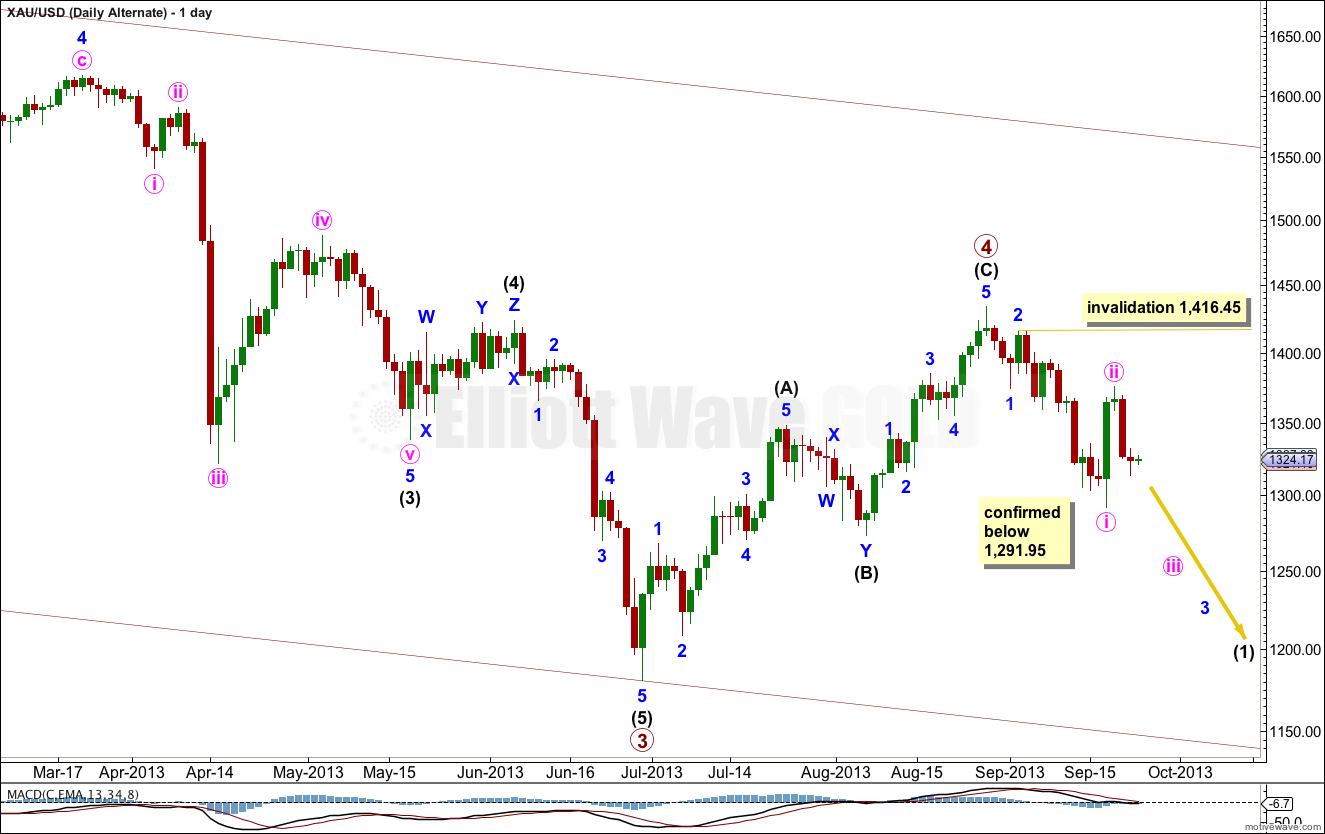
I have tried to see as many alternates as I can. This wave count is possible but it has problems of proportion which make it look odd. I will publish it as a slim outlying possibility. I would only use it if it is confirmed with movement below 1,291.95.
If primary wave 4 is over then it lasted only 9 weeks, compared to primary wave 2 which lasted 53 weeks. This gives the monthly chart the wrong look.
Within recent downwards movement minute wave ii may not move beyond the start of minute wave i. This wave count is invalidated with movement above 1,416.45. If price moves above this point next week I would have more confidence in the main wave count.