
Yesterday’s update expected more downwards movement with small fourth wave corrections along the way. This was not what happened as price moved higher in a deep second wave correction.
Click on the charts below to enlarge.
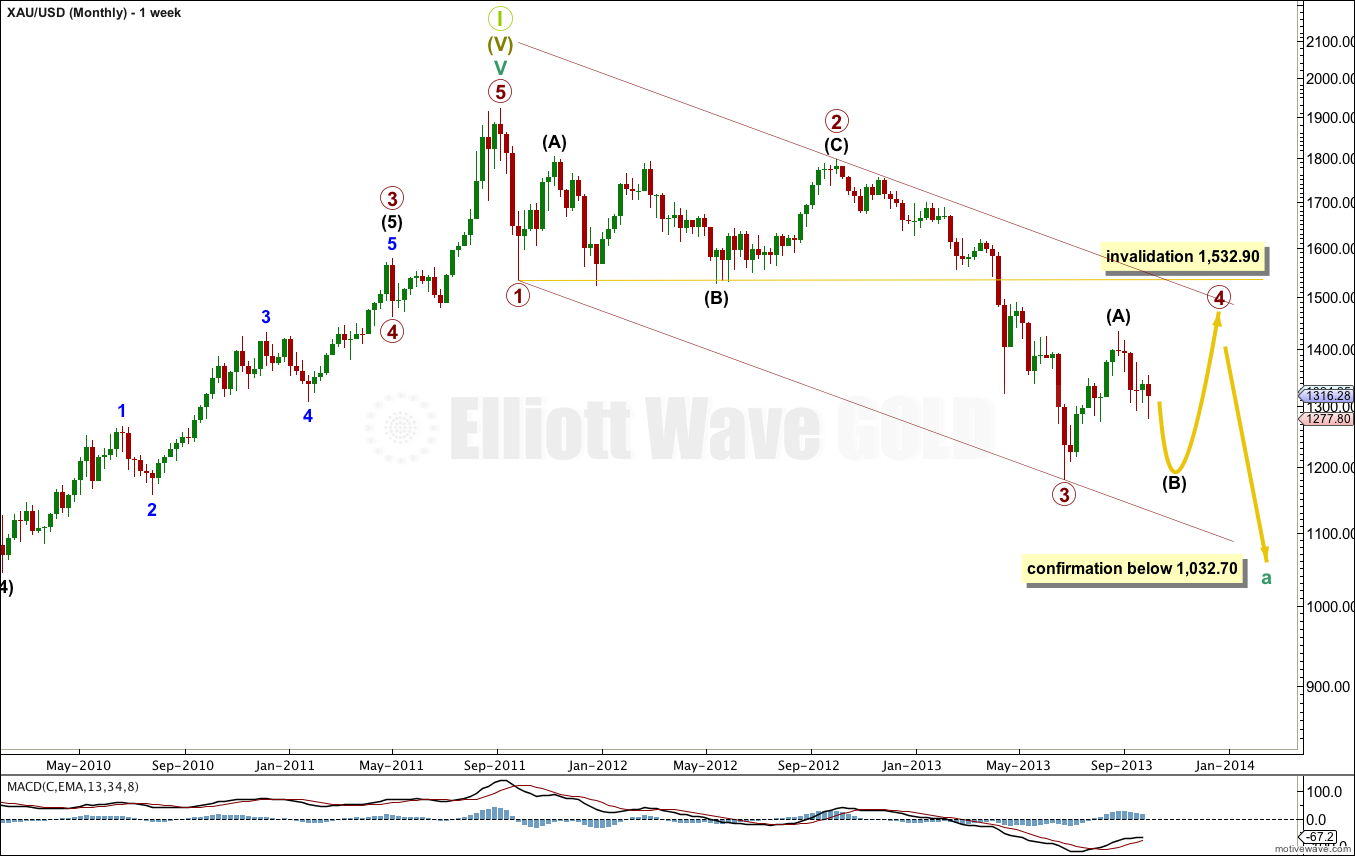
This wave count sees gold in a grand super cycle second wave correction. Within the correction cycle wave a is an incomplete impulse.
Within cycle wave a primary wave 2 lasted 53 weeks as a running flat. Primary wave 3 lasted 37 weeks, and primary wave 4 is most likely to continue further to be better in proportion to primary wave 2.
Draw a parallel channel about cycle wave a using Elliott’s first technique. I would expect primary wave 4 to find resistance at the upper edge of that channel.
Primary wave 4 may not move into primary wave 1 price territory. This wave count is invalidated with movement above 1,532.90.
It is most likely that primary wave 4 is not over and is unfolding as a large flat correction.
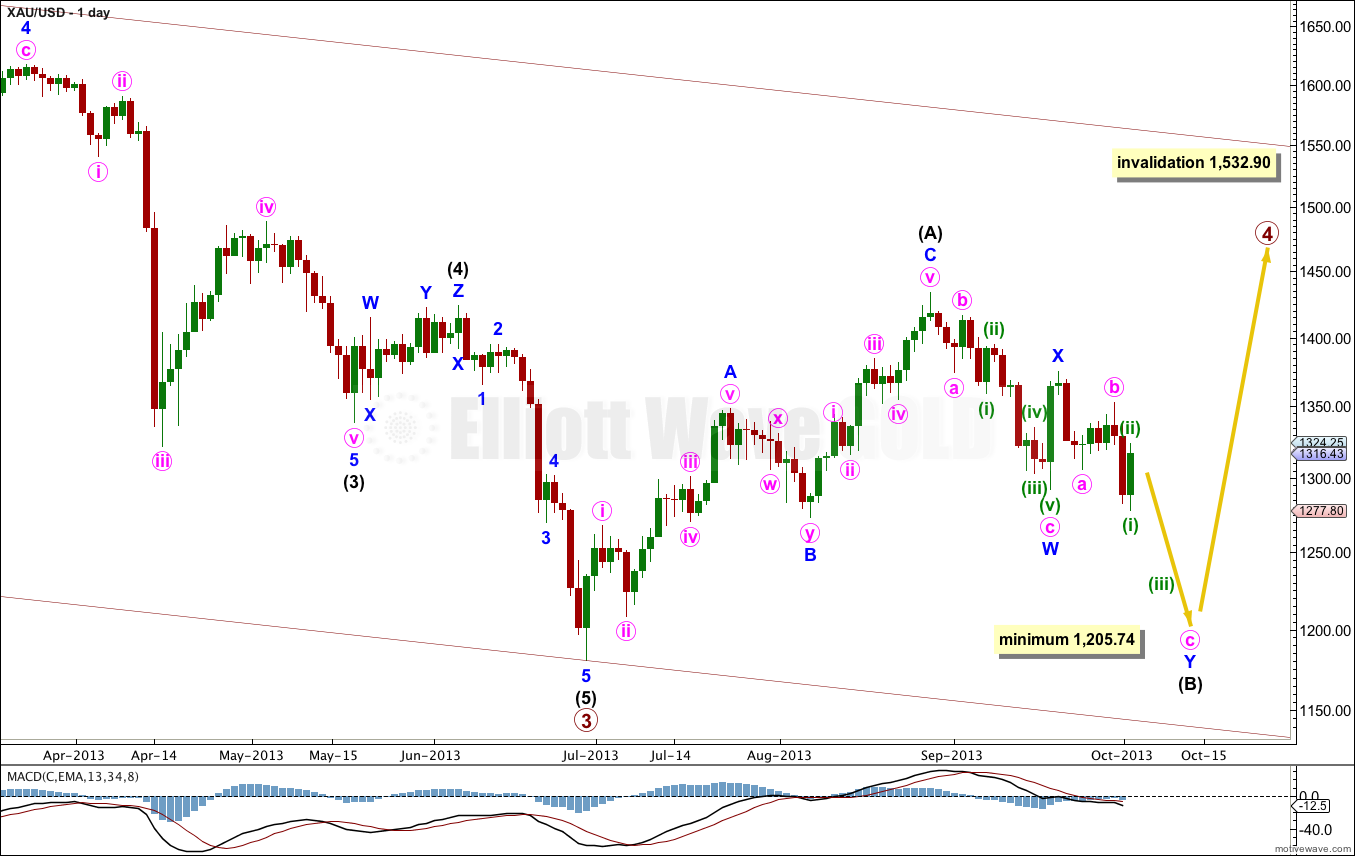
Within the flat correction intermediate wave (B) must be at least 90% the length of intermediate wave (A). This wave count requires more downwards movement to this minimum at 1,205.74.
Within an expanded flat the B wave is 105% the length of the A wave, so this wave count allows for a new low as quite likely, because expanded flats are the most common type of flat.
Intermediate wave (B) would be about three or so weeks away from ending.
The depth of upwards movement is more than was expected from yesterday’s analysis. This is not a fourth wave correction and it is a second wave correcting prior downwards movement.
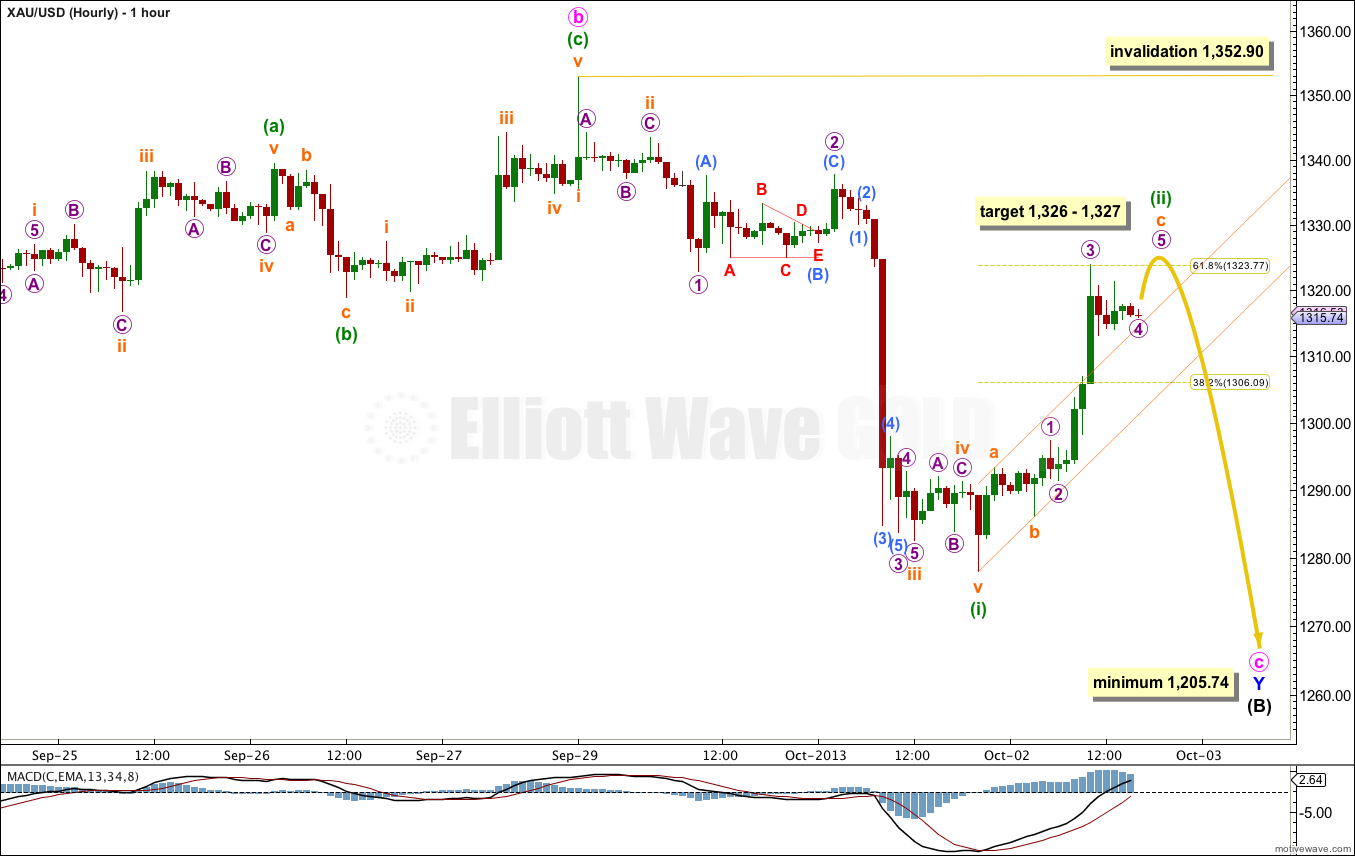
At the moment it looks most likely that micro wave 4 is completing as a triangle or combination. When this is done one final small upwards wave for micro wave 5 would complete the second wave correction for minuette wave (ii).
Micro wave 3 is 3.04 longer than 2.618 the length of micro wave 1. At 1,327 micro wave 5 would reach equality in length with micro wave 1.
At 1,326 subminuette wave c would reach 2.618 the length of subminuette wave a.
Draw a channel about minuette wave (ii). When this channel is clearly breached by downwards movement I would have confidence that minuette wave (ii) is over and minuette wave (iii) should be underway.
The next wave down should be a third wave and so should show an increase in momentum. It is most likely to be about 121.24 in length, to be 1.618 the length of the first wave. When minuette wave (ii) has ended I will calculate a target for minuette wave (iii) downwards for you.
Minuette wave (ii) may not move beyond the start of minuette wave (i). This wave count is invalidated with movement above 1,352.90.
Alternate Daily Wave Count.

This wave count has problems of proportion which make it look odd. However, with movement below 1,291.95 it has increased in probability.
If primary wave 4 is over then it lasted only 9 weeks, compared to primary wave 2 which lasted 53 weeks. This gives the monthly chart the wrong look. However, primary wave 2 was a double combination and primary wave 4 a single zigzag. These corrective structures do have different durations; the purpose of combinations is to take up time and move price sideways. This wave count is technically possible, but it does not have a good probability.
At 1,174 minute wave iii would reach 1.618 the length of minute wave i.
Within minute wave iii no second wave correction may move beyond the start of its first wave. This wave count is invalidated with movement above 1,375.38.