
Last analysis expected more upwards movement for gold, which is what happened. However, price did not complete the triangle and move up to the target as expected.
I will present all the alternate wave counts that I can see today, and keep publishing them until one by one they are invalidated.
There are 13 possible corrective structures that could be completing for this fourth wave (more if we include each type of combination as a different corrective structure). At this stage I can narrow down the possibilities, but it is impossible to say with certainty which structure will be the one which completes. The best I can do is present all possibilities. I will present them in order of probability.
Click on the charts below to enlarge.
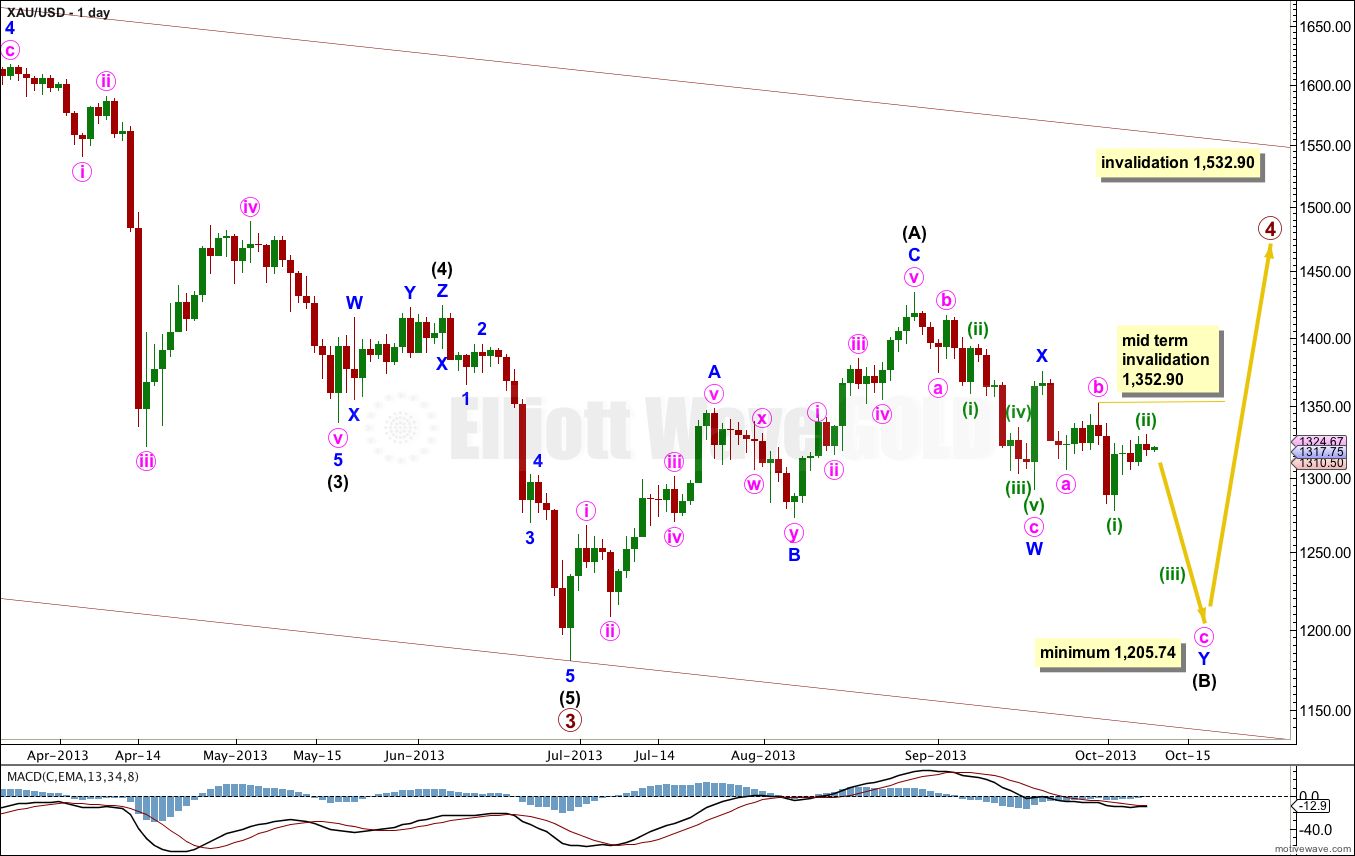
This is the main wave count with the highest probability. Flat corrections are extremely common structures, particularly in fourth waves. Primary wave 2 was a running flat, so primary wave 4 may exhibit alternation if it is a more common expanded flat or a still common regular flat. Primary wave 4 may also exhibit alternation if it is shallow; primary wave 2 was very deep.
Primary wave 2 lasted 53 weeks. It would be likely that primary wave 4 will continue for longer to be better in proportion to primary wave 2.
It is most likely that primary wave 4 is not over and is unfolding as a large flat correction. Within the flat intermediate wave (B) is an incomplete double zigzag. Within the second zigzag of this double, labeled minute wave y, minuette wave (ii) may not move beyond the start of minuette wave (i). This wave count is invalidated at this stage and for some time yet with movement above 1,532.90.
Within the flat correction intermediate wave (B) must be at least 90% the length of intermediate wave (A). This wave count requires more downwards movement to this minimum at 1,205.74.
Within an expanded flat the B wave is 105% the length of the A wave, so this wave count allows for a new low as quite likely, because expanded flats are the most common type of flat.
Intermediate wave (B) would be about three or so weeks away from ending.
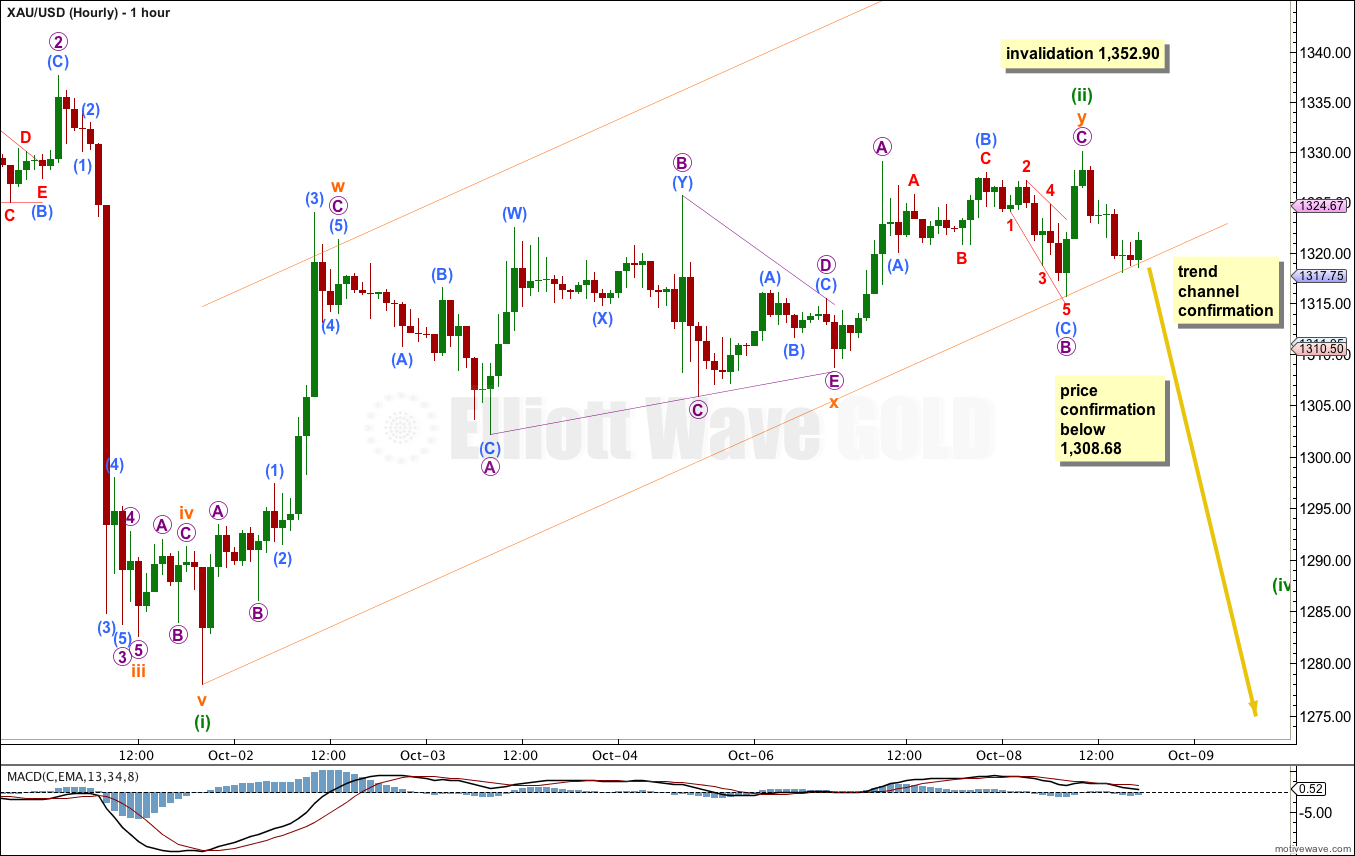
Minuette wave (ii) may again be a completed double zigzag.
Price has breached the channel as I had drawn it yesterday, but this breach would have happened before the high and the end for minuette wave (ii). For this reason I think the channel should be redrawn so that it contains all of the correction for minuette wave (ii). When this redrawn channel is breached I expect minuette wave (ii) may finally be over.
Movement below 1,308.68 would give me confidence that minuette wave (iii) downwards is underway. At that stage downwards movement could not be a continuation of a B wave within the second zigzag, and the corrective structure must be over.
While price remains above 1,308.68 I will leave the invalidation point at the same place as on the daily chart, for the same reason.
Minuette wave (ii) may not move beyond the start of minuette wave (i). This wave count is invalidated with movement above 1,352.90.
Daily Alternate Wave Count.
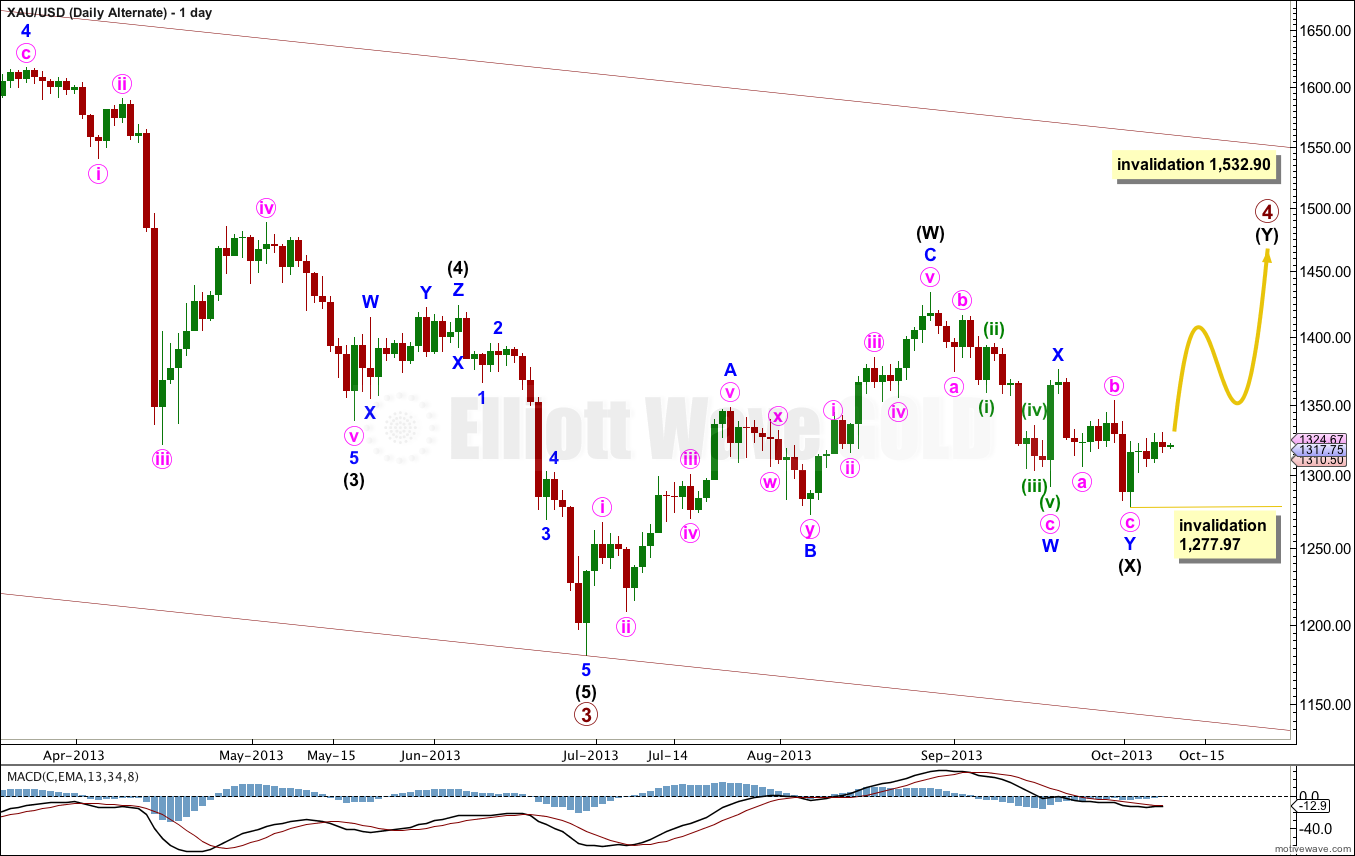
While flat corrections are extremely common structures, multiples are only slightly less common. For this reason this alternate has a lower probability than the main wave count.
This alternate would see better alternation with primary wave 2 which was a running flat; primary wave 4 as a double zigzag would provide perfect alternation in structure.
Within multiples X waves are usually single zigzags, or less likely single flats or triangles. It is unusual for an X wave to be a multiple itself, and this one is a double zigzag. This reduces the probability of this alternate wave count.
Within multiples subwaves W, Y (and if there is one subwave Z) can only subdivide into simple corrective structures, they cannot themselves be multiples. But X waves can, and rarely, do.
Within intermediate wave (Y) no second wave may move beyond the start of the first wave. This wave count is invalidated with movement below 1,277.97.
Daily Alternate Wave Count II.
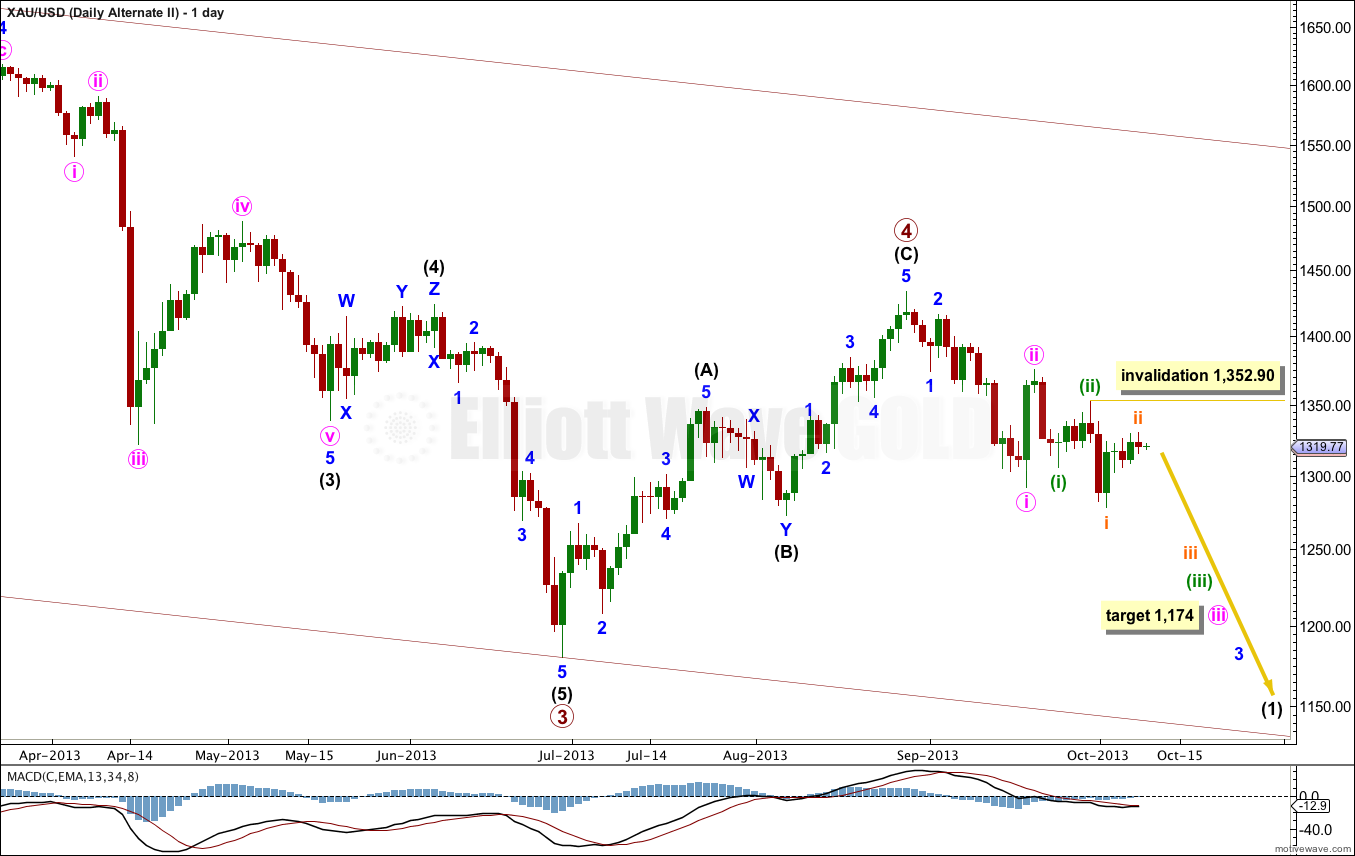
This wave count has the lowest probability because it would see primary wave 4 as having lasted only 9 weeks. Compared to primary wave 2 having lasted 53 weeks, this lack of proportion gives this alternate wave count the wrong look at the weekly chart level. This significantly reduces the probability of this wave count.
This alternate expects very strong downwards movement as the middle of a third wave unfolds. If the next wave down shows a very strong increase in momentum then I would more seriously consider this alternate.
At 1,174 minor wave 3 would reach 1.618 the length of minor wave 1.
Subminuette wave ii may not move beyond the start of subminuette wave i. This wave count is invalidated with movement above 1,352.90.
technical question.. your wave notation chart says, for example, Minute wave – “days”. Does that mean days for an entire 5 wave impulse or typically days for each individual wave? Thanks
Each individual wave.
Those durations are very rough guidelines only.