
Last analysis expected more sideways and slightly higher movement before one more downwards wave. Price did not move higher, it moved sideways, and was followed by another wave downwards. The target at 1,271 was comfortably exceeded.
I have a new alternate wave count for you today.
Click on the charts below to enlarge.
Main Wave Count.
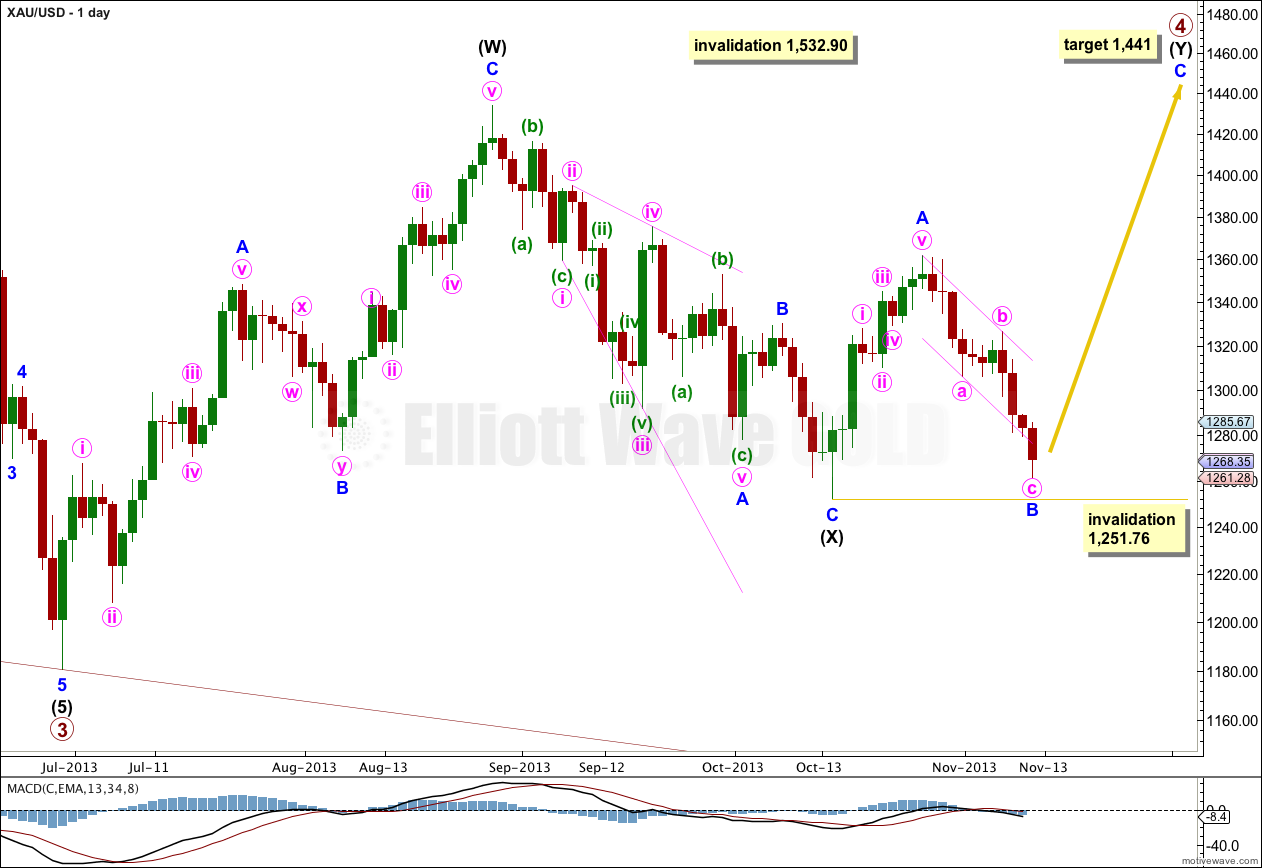
The structure for primary wave 4 cannot be a flat correction, because what would be the B wave is well less than 90% of what would be the A wave. That is why I have labeled it as a double.
Because intermediate wave (X) is quite shallow I would expect primary wave 4 is most likely a double zigzag rather than a double combination. Double combinations move price sideways and their X waves are usually deeper than this one is. Double zigzags trend against the main direction, and their purpose is to deepen a correction when the first zigzag did not take price deep enough. So I will be expecting intermediate wave (Y) to subdivide as a zigzag and to take price comfortably above 1,433.83. It should last about 35 to 45 days or sessions in total.
At 1,441 minor wave C within the zigzag of intermediate wave (Y) would reach 1.618 the length of minor wave A. This target is not high enough to achieve the purpose of a double zigzag. There may not be a ratio between minor waves A and C. When there is structure within minor wave C to analyse, specifically when minute waves i, ii, iii and iv within it are complete, I will use the ratios between minute waves i, iii and v within minor wave C to recalculate this target. It may be recalculated higher towards the end of the movement.
Within the zigzag of intermediate wave (Y) minor wave B may not move beyond the start of minor wave A. This wave count is invalidated with movement below 1,251.76.
The key difference between this main wave count and the alternate below is the structure of minor wave C within intermediate wave (X). This main wave count sees this downwards wave as a five, the alternate sees it as a three. It has a better fit as a five on the hourly chart, and so this main wave count has a higher probability.
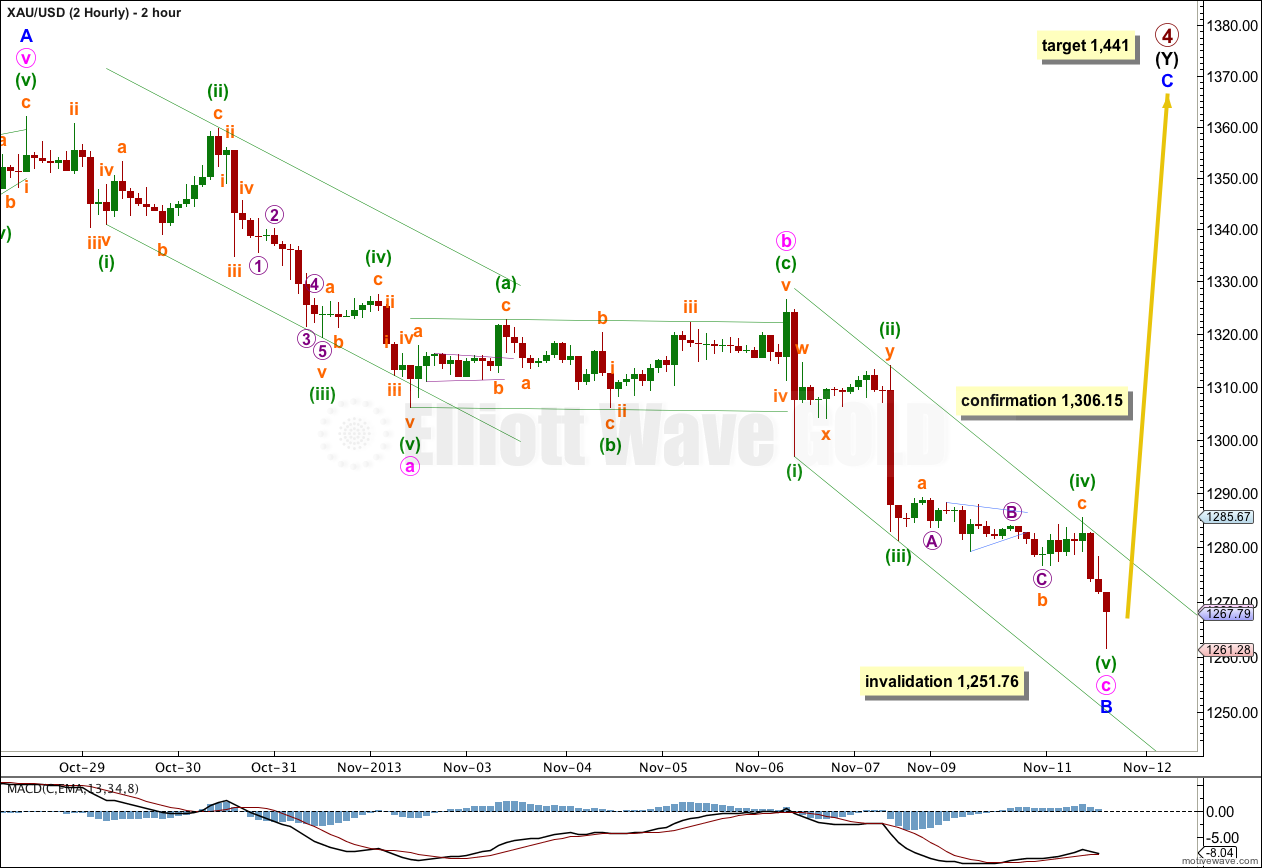
This 2 hourly chart shows all of minor wave B downwards. I am publishing it in order to compare with the alternate below.
This wave count has an excellent fit. On the 2 hourly chart minute wave a lasted 48 candles, minute wave b 47 candles, and minute wave c 40 candles. This gives the wave count overall the right look with good proportions.
All of minute waves a, b and c fit perfectly within their Elliott channels.
Within minute wave a on the one hourly chart there is perfect divergence with the ends of minuette waves (iii) and (v); minuette wave (iii) has the strongest downwards momentum indicated by the lowest level on MACD, and minuette wave (v) has less momentum.
Within minute wave c there is also clear divergence between minuette waves (iii) and (v) on the hourly and 2 hourly charts.
There is no Fibonacci ratio between minute waves a and c.
Movement above 1,306.15 would invalidate the alternate below, and provide confirmation of this main wave count.
Alternate Wave Count.
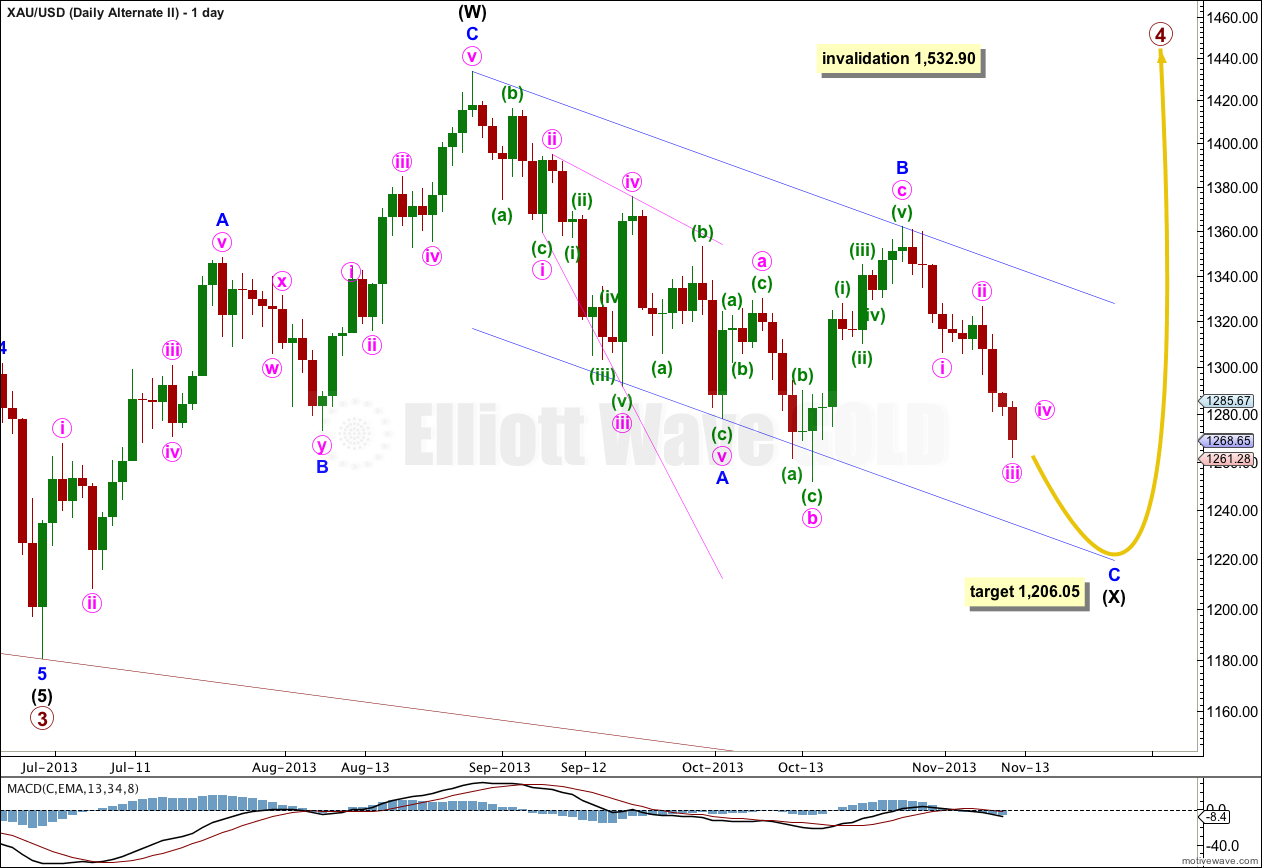
It is possible that we may see more downwards movement if intermediate wave (X) is incomplete.
Within intermediate wave (X) minor wave C may be incomplete. Minor wave B here is seen as an expanded flat. Within it, minute wave b is a 150% correction of minute wave a, and there is no Fibonacci ratio between minute waves a and c. The maximum common length of B waves within flats is 138% the length of the A wave. This structure exceeds the common length which slightly reduces the probability of this wave count.
Within minor wave C this wave count sees the subdivisions in exactly the same way as the main wave count, because A-B-C and 1-2-3 subdivide in exactly the same way.
At 1,206.05 minor wave C would reach equality in length with minor wave A.
For this alternate I would expect primary wave 4 is a double combination because within it the X wave would be relatively deep. Intermediate wave (Y) would most likely be a flat, but may also be a triangle. I would expect it to end about the same level as intermediate wave (W) at 1,433.83.
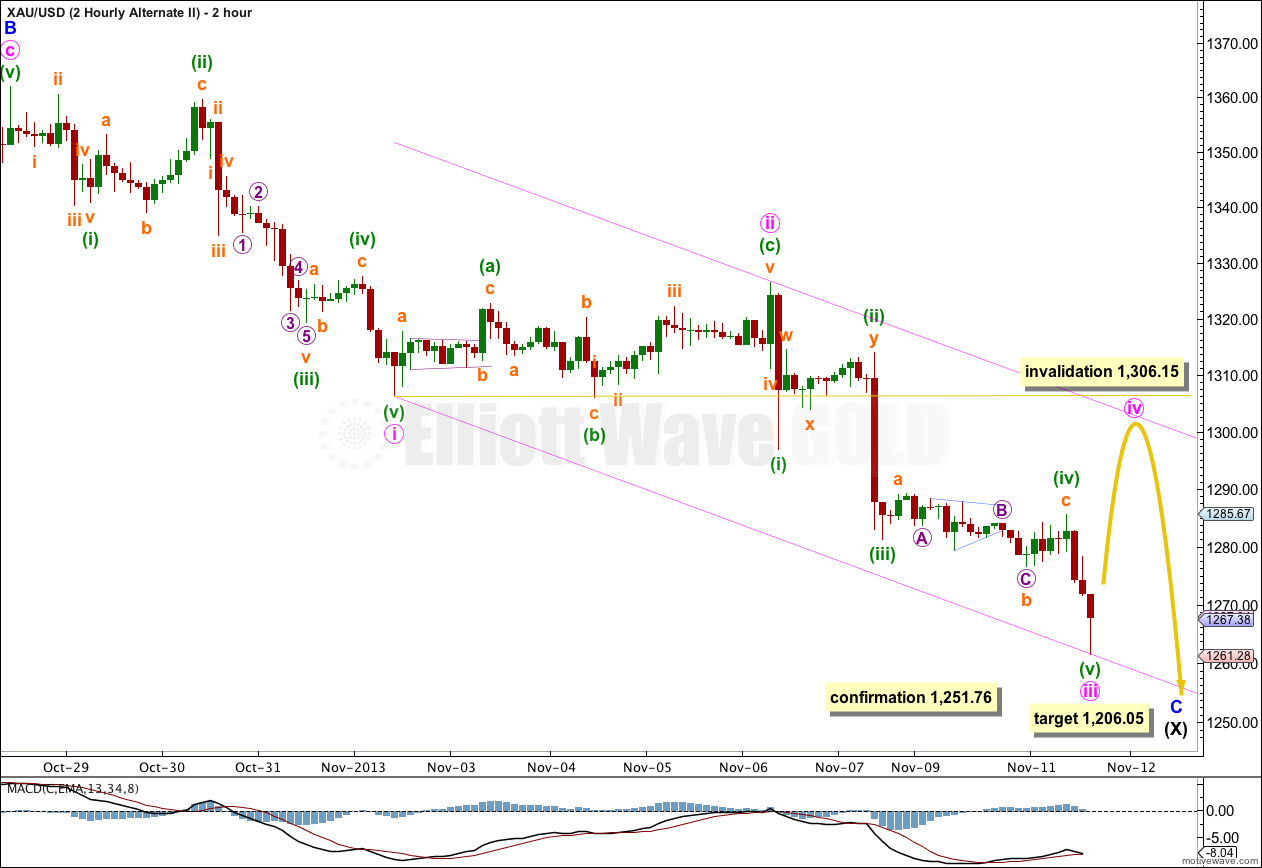
If downwards movement from the high at 1,361.91 is a new impulse downwards then only minute waves i to iii would be complete. Minute wave iii shows a slight increase in downwards momentum, just enough to see this part of the wave count as valid but not enough to be convincing.
Upwards movement would now be expected for a fourth wave correction. Minute wave iv may not move into minute wave i price territory. This wave count is invalidated with movement above 1,306.15.
Movement below 1,251.76 would invalidate the main wave count and confirm this alternate. At that stage I would expect further downwards movement towards the target.