
Movement above 1,249.06 confirmed the main wave count shortly after publication of yesterday’s analysis. At that stage the analysis expected a little more upwards movement, to be followed by a deep second wave correction. This is exactly what happened.
Click on the charts below to enlarge.
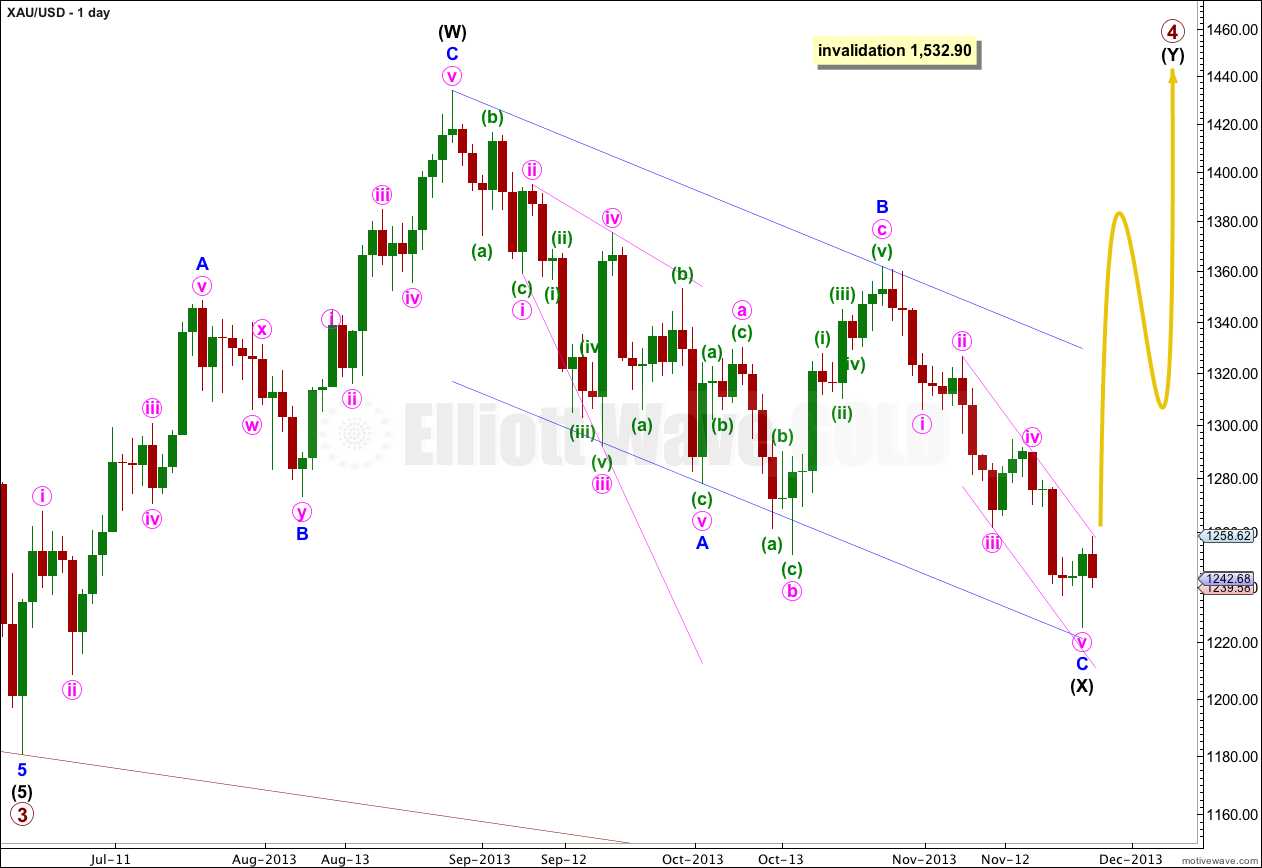
Gold is still within a large fourth wave correction at primary wave degree which is incomplete. It is unlikely that primary wave 4 was over at 1,433.83 as a single zigzag because it would have lasted only nine weeks. Its counterpart primary wave 2 lasted 53 weeks. This is too big a difference for the wave count to have the “right look”.
It is likely to continue as a double combination because within it intermediate wave (X) is reasonably deep. Double zigzags normally have more shallow X waves than this one is.
The purpose of double combinations is to take up time and move price sideways, and, I would expect intermediate wave (Y) to end about the same level as intermediate wave (W) at 1,433.83. Double combinations in fourth wave positions are quite common.
I have drawn a parallel channel about the zigzag of intermediate wave (X) using Elliott’s technique for a correction. Draw the first trend line from the start of minor wave A to the end of minor wave B. Place a parallel copy upon the end of minor wave A. Minor wave C may have ended slightly short of touching the lower edge of the channel. When this channel is finally breached by upwards movement then I would consider that final confirmation that intermediate wave (Y) is underway.
I have also drawn a parallel channel about minor wave C downwards using Elliott’s second technique. Draw the first trend line from the highs labeled minute waves ii and iv, place a parallel copy upon the low labeled minute wave iii. An earlier confirmation of a trend change would come with a clear breach of this channel by upwards movement.
Primary wave 4 may not move into primary wave 1 price territory. This wave count is invalidated with movement above 1,532.90.
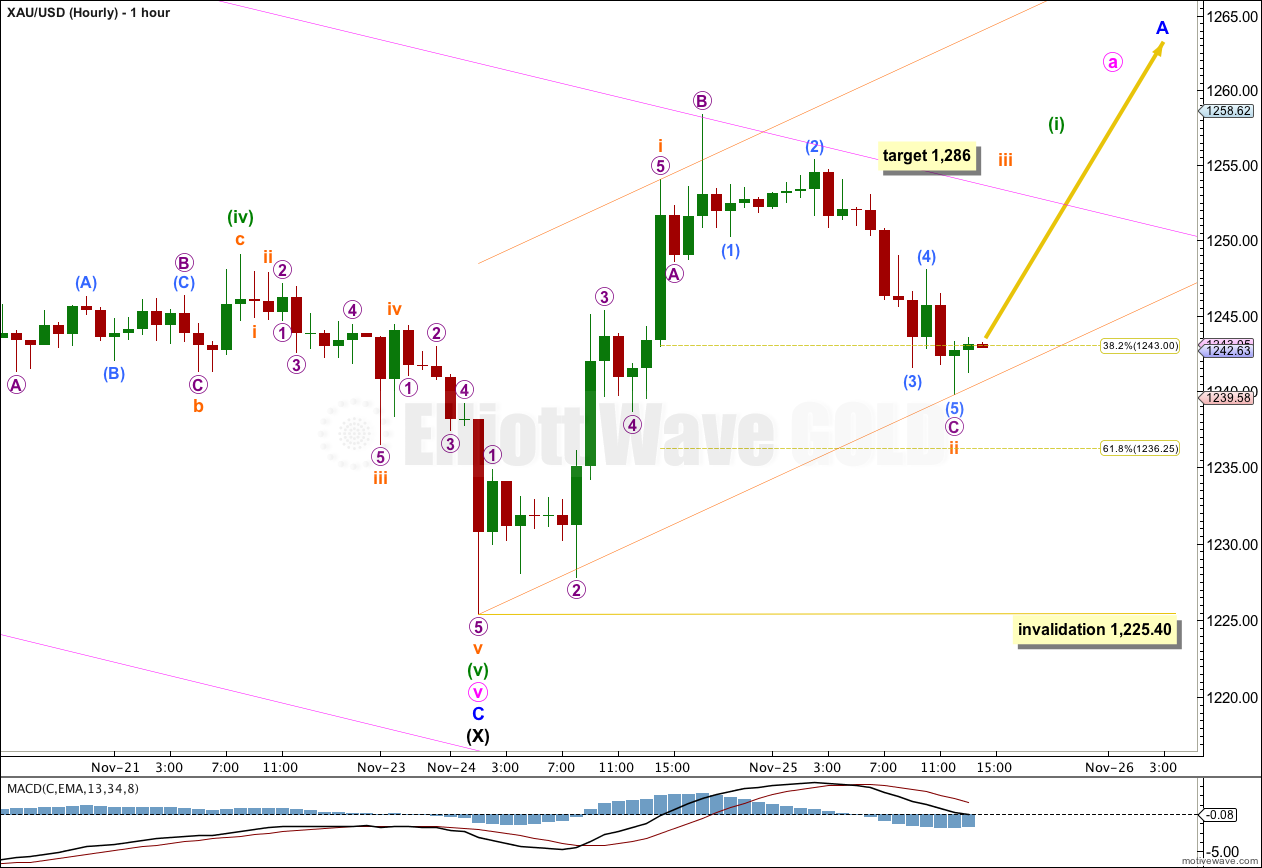
Upwards movement found resistance at the upper edge of the pink parallel channel drawn on the daily chart.
There is now a five wave structure upwards ending at the high labeled subminuette wave i. Thereafter, subminuette wave ii subdivides as an expanded flat correction. Micro wave B within it is a very clear three wave structure on the five minute chart, and this upwards wave is part of a correction and not a fifth wave.
Ratios within subminuette wave i are: micro wave 3 has no Fibonacci ratio to micro wave 1, and micro wave 5 is just 0.01 longer than 1.618 the length of micro wave 1.
Within subminuette wave ii micro wave B is a 180% correction of micro wave A, and there is no Fibonacci ratio between micro waves A and C.
At 1,286 subminuette wave iii would reach 1.618 the length of subminuette wave i.
When price breaks through resistance at the upper edge of the pink channel copied over here today from the daily chart to the hourly chart, then I would have more confidence in this trend change.
Subminuette wave ii may not move beyond the start of subminuette wave i. This wave count is invalidated with movement below 1,225.40.
Alternate Daily Wave Count.
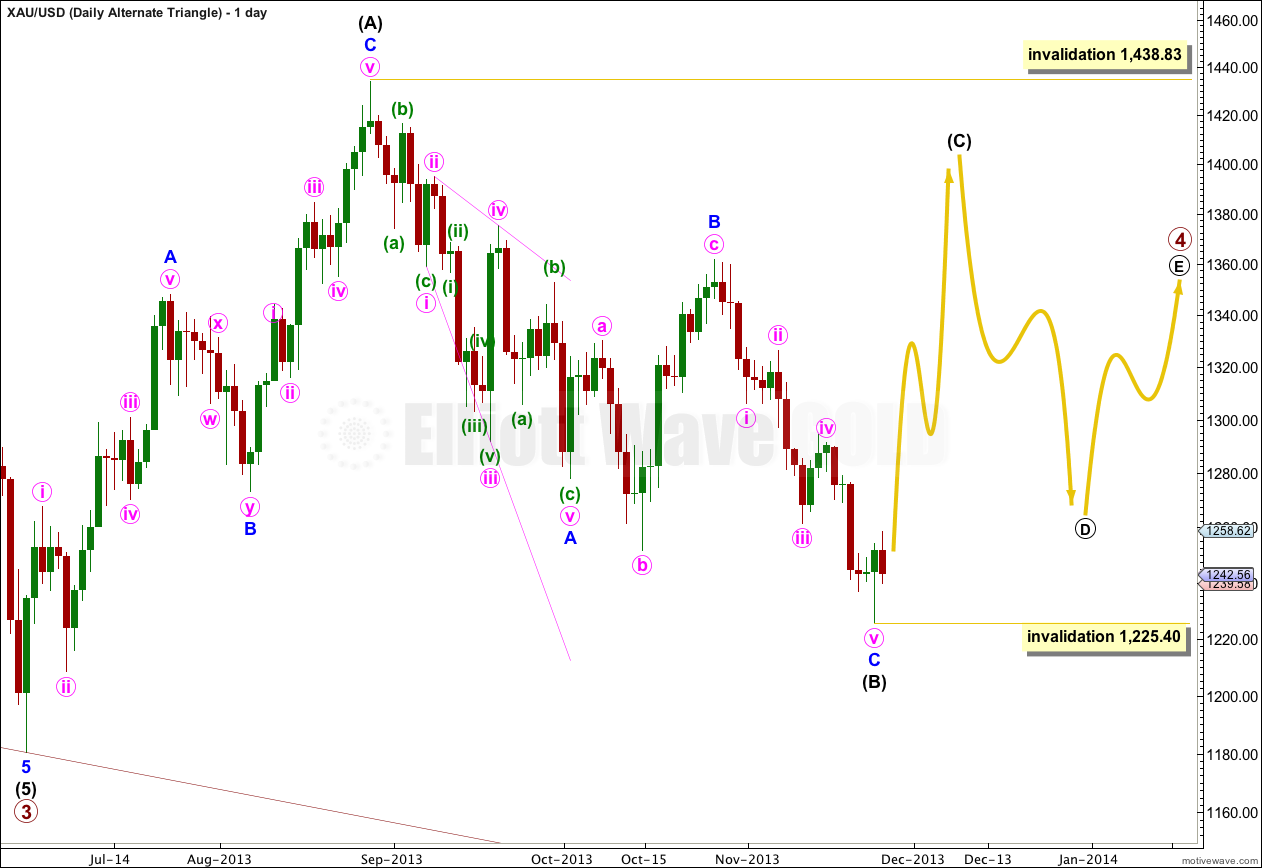
It is also possible that primary wave 4 may continue as a regular contracting (or barrier) triangle.
The expected direction and structure of this next upwards wave is the same, but for this alternate intermediate wave (C) of the triangle may not move beyond the end of intermediate wave (A). The triangle is invalidated with movement above 1,438.83.
If the triangle is contracting then the following downwards wave for intermediate wave (D) may not move beyond the end of intermediate wave (B) at 1,225.40.
If the triangle is a barrier triangle then intermediate wave (D) may end about the same level as intermediate wave (B) at 1,225.40, as long as the B-D trend line is essentially flat. What this means in practice is that intermediate wave (D) could end slightly lower than 1,225.40. This is the only area where Elliott wave rules are not black and white; this is the only grey.
The final intermediate wave (E) upwards may not move above the end of intermediate wave (C) for both a contracting and barrier triangle. E waves most commonly end short of the A-C trend line.
All five subwaves of a triangle must divide into corrective structures. If this next upwards movement subdivides as a zigzag which does not make a new high above 1,438.83 then this alternate would be correct.
Triangles take up time and move price sideways. If primary wave 4 unfolds as a triangle then I would expect it to last months rather than weeks.
Lara,
How likely is it that we finished Primary 4 at 1435 and heading straight down now, due to very weak upward price action?
Primary Wave 2 was 265 points and at 1435 Primary 4 is 254 points fairly close.
Would you say nearly equal point movements is more important than time equality far waves 2’s & 4’s?
Also do you have an alt. count if it heads straight down? Thank you for nice work.
Your question is answered in the first paragraph: “Gold is still within a large fourth wave correction at primary wave degree which is incomplete. It is unlikely that primary wave 4 was over at 1,433.83 as a single zigzag because it would have lasted only nine weeks. Its counterpart primary wave 2 lasted 53 weeks. This is too big a difference for the wave count to have the “right look”.”
I do not mean nearly equal price movements, I mean duration.
And no, at this stage I do not have an alt allowing for straight down movement.
Thank you