
Yesterday’s analysis had a main and alternate wave count which I judged to have an even probability. Upwards movement for Friday has taken Gold outside of the parallel channel on the daily chart. This is the first thing I was looking for to indicate which wave count is correct.
For the end of week analysis I can now state I judge the main wave count to have a higher probability than the alternate.
The alternate remains valid, but the probability that it is correct has reduced.
Click on the charts below to enlarge.
Main Wave Count.
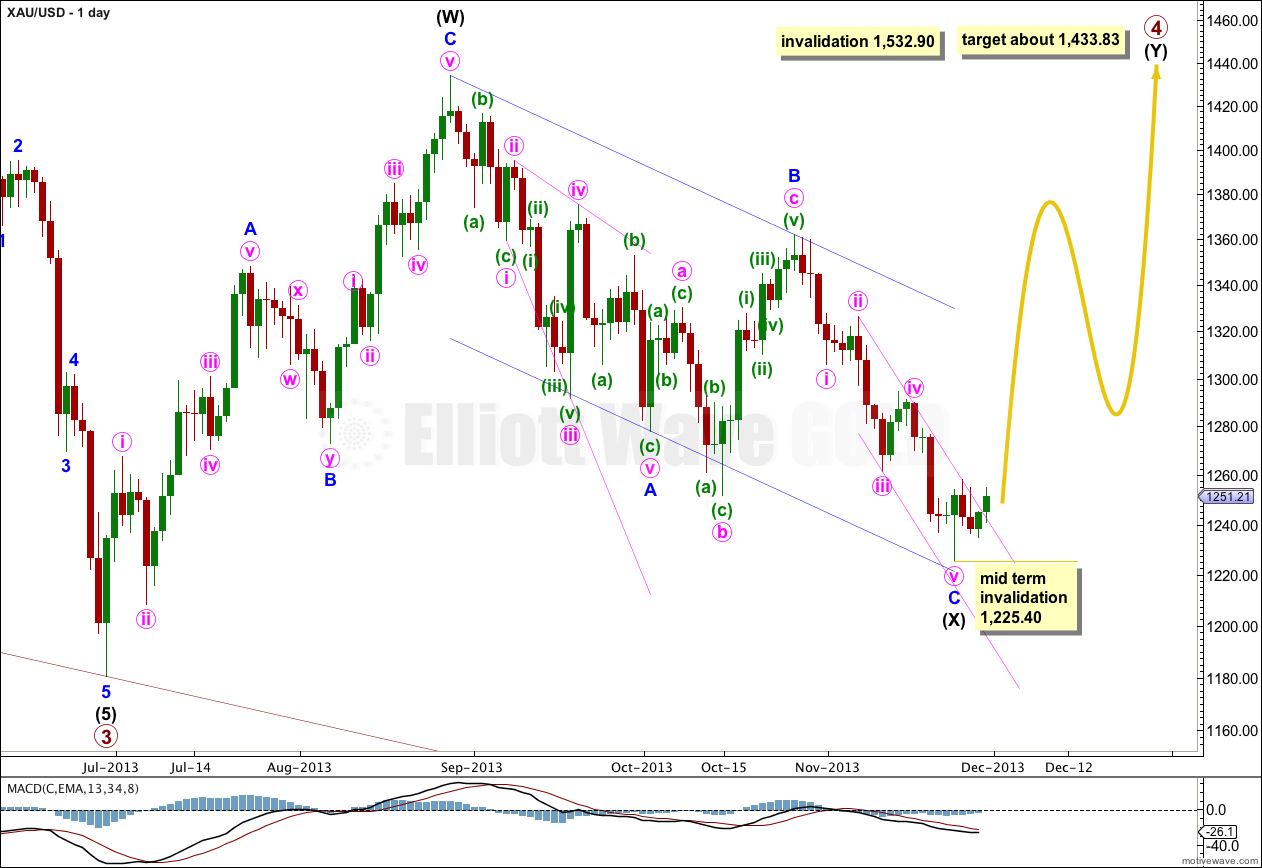
Gold is still within a large fourth wave correction at primary wave degree which is incomplete. It is unlikely that primary wave 4 was over at 1,433.83 as a single zigzag because it would have lasted only nine weeks. Its counterpart primary wave 2 lasted 53 weeks. This is too big a difference for the wave count to have the “right look”.
It is likely to continue as a double combination because within it intermediate wave (X) is reasonably deep. Double zigzags normally have more shallow X waves than this one is.
The purpose of double combinations is to take up time and move price sideways, and I would expect intermediate wave (Y) to end about the same level as intermediate wave (W) at 1,433.83. Double combinations in fourth wave positions are quite common.
I have drawn a parallel channel about the zigzag of intermediate wave (X) using Elliott’s technique for a correction. Draw the first trend line from the start of minor wave A to the end of minor wave B. Place a parallel copy upon the end of minor wave A. Minor wave C may have ended slightly short of touching the lower edge of the channel. When this channel is finally breached by upwards movement then I would consider that final confirmation that intermediate wave (Y) is underway.
I have also drawn a parallel channel about minor wave C downwards using Elliott’s second technique. Draw the first trend line from the highs labeled minute waves ii and iv, place a parallel copy upon the low labeled minute wave iii. Confirmation of a trend change would come with a clear breach of this channel by upwards movement.
Primary wave 4 may not move into primary wave 1 price territory. This wave count is invalidated with movement above 1,532.90.
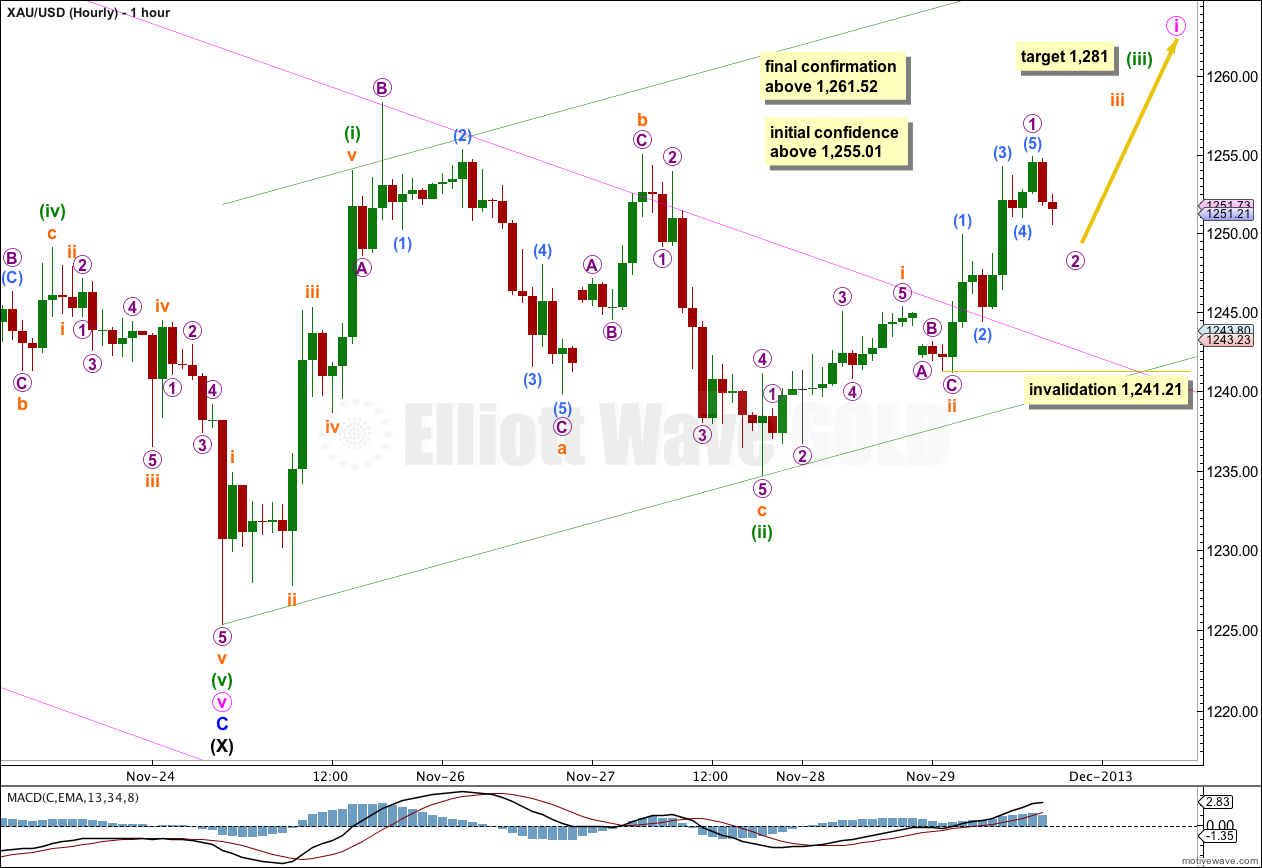
Upwards movement at the end of Friday’s session took price outside of the pink parallel channel which is copied over here from the daily chart. This channel breach indicates that minor wave C is over and the next wave is underway.
So far within minuette wave (iii) the middle strongest part has not yet completed because momentum within minuette wave (iii) has not increased beyond that seen for minuette wave (i). I would expect a strong increase in upwards momentum early next week as the middle of a third wave unfolds.
Within the middle of minuette wave (iii), subminuette wave iii is incomplete. Within subminuette wave iii micro wave 2 may not move beyond the start of micro wave 1. So far micro wave 2 looks incomplete on the five minute chart, and I would expect the market to open next week with a little downwards movement.
Minuette wave (iii) should breach the upper edge of the upwards sloping green acceleration channel. At 1,281 minuette wave (iii) would reach 1.618 the length of minuette wave (i).
Movement above 1,255.01 would give me further confidence in a big trend change at 1,225.40. Movement above 1,261.52 would give me full and final confidence in this trend change.
First Alternate Wave Count.
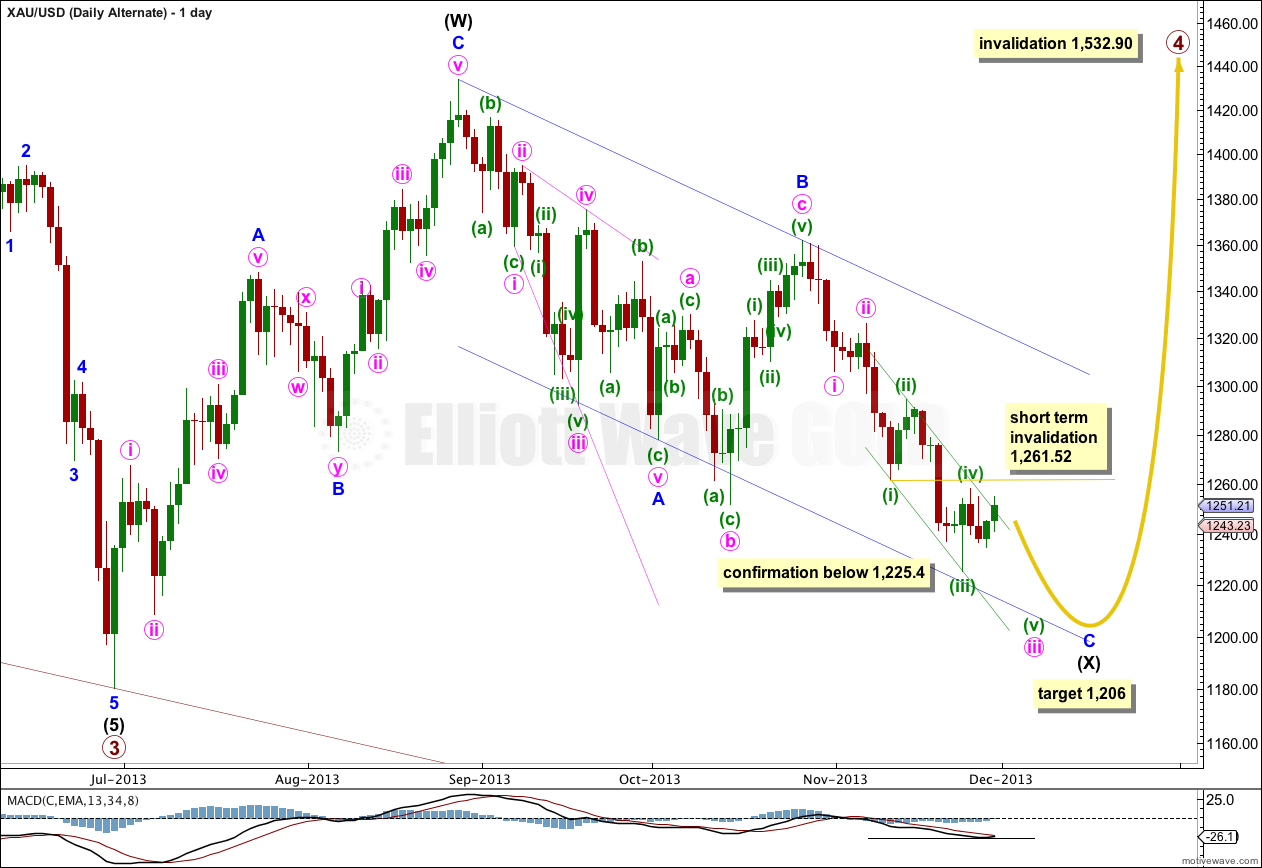
This alternate is mostly the same as the main wave count except it sees minute wave iii within minor wave C extending. At 1,206 minor wave C would reach equality in length with minor wave A.
Within the extending third wave of minute wave iii, minuette wave (iv) may not move into minuette wave (i) price territory. This alternate would be invalidated above 1,261.52.
If price moves above 1,261.52 then I would have full confidence in the main wave count, and I would expect that gold is in a new upwards trend to last for weeks.
Second Alternate Wave Count – Triangle.
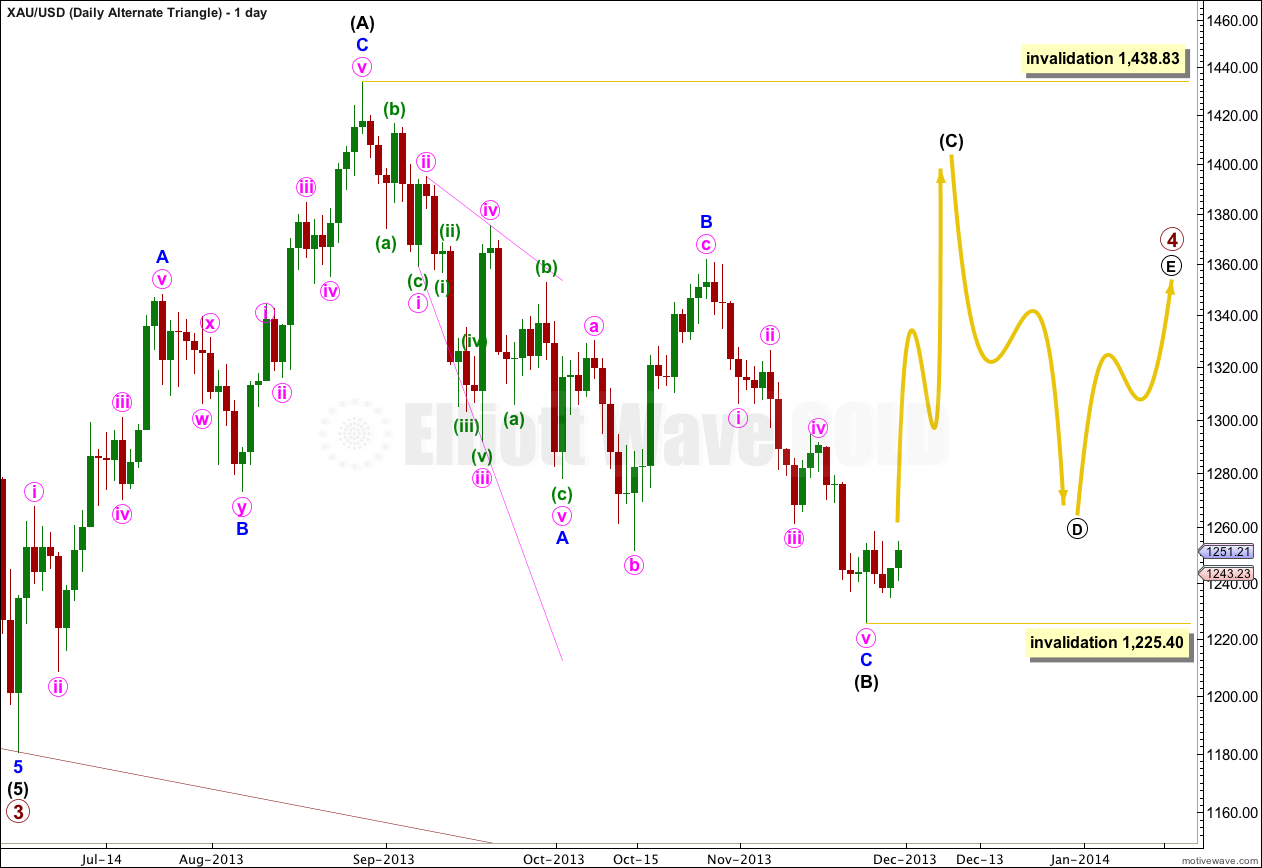
It is also possible that primary wave 4 may continue as a regular contracting (or barrier) triangle.
The expected direction and structure of this next upwards wave is the same, but for this alternate intermediate wave (C) of the triangle may not move beyond the end of intermediate wave (A). The triangle is invalidated with movement above 1,438.83.
If the triangle is contracting then the following downwards wave for intermediate wave (D) may not move beyond the end of intermediate wave (B) at 1,225.40.
If the triangle is a barrier triangle then intermediate wave (D) may end about the same level as intermediate wave (B) at 1,225.40, as long as the B-D trend line is essentially flat. What this means in practice is that intermediate wave (D) could end slightly lower than 1,225.40. This is the only area where Elliott wave rules are not black and white.
The final intermediate wave (E) upwards may not move above the end of intermediate wave (C) for both a contracting and barrier triangle. E waves most commonly end short of the A-C trend line.
All five subwaves of a triangle must divide into corrective structures. If this next upwards movement subdivides as a zigzag which does not make a new high above 1,438.83 then this alternate would be correct.
Triangles take up time and move price sideways. If primary wave 4 unfolds as a triangle then I would expect it to last months rather than weeks.
Lara, do you believe it is possible to have a 7 wave impulsive moves? For example, for your first alternative wave count, if the market continues down, would you consider that a 7th minuette wave extension of a single minute wave instead of a 5th wave of 3 waves? If so, when would you favour one count over the other?
No, it is not.
Which means now that the alternate was confirmed and the main wave count invalidated it has a more yet to go down.
Impulsive waves have a count of 5, 9, 13 etc. with each extension increasing the count by 4.
Corrective waves have a count of 3, 7, 11 etc. with each extension increasing the count by 4.