
Yesterday’s analysis expected upwards movement to a short term target at 1,324, before a trend change within 24 hours and the resumption of the downwards trend. Price did move higher, reaching 1,326.51, just 2.51 above the target, before turning down to make new lows.
The wave count remains mostly the same.
Click on the charts below to enlarge.
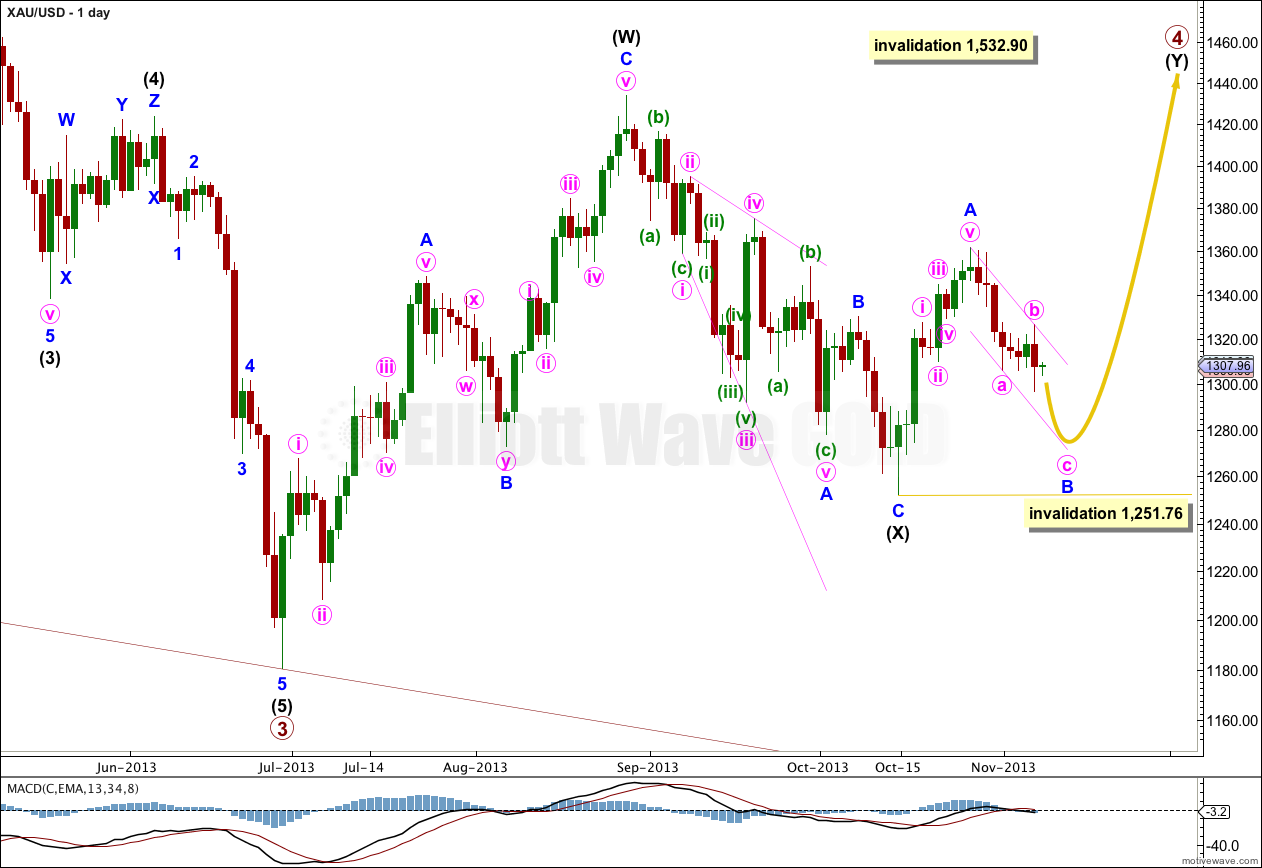
The structure for primary wave 4 cannot be a flat correction, because what would be the B wave is well less than 90% of what would be the A wave. That is why I have labeled it as a double.
Because intermediate wave (X) is quite shallow I would expect primary wave 4 is most likely a double zigzag rather than a double combination. Double combinations move price sideways and their X waves are usually deeper than this one is. Double zigzags trend against the main direction, and their purpose is to deepen a correction when the first zigzag did not take price deep enough. So I will be expecting intermediate wave (Y) to subdivide as a zigzag and to take price comfortably above 1,433.83. It should last about 35 to 45 days or sessions in total.
Within the zigzag of intermediate wave (Y) minor wave B may not move beyond the start of minor wave A. This wave count is invalidated with movement below 1,251.76.
Main Hourly Wave Count.
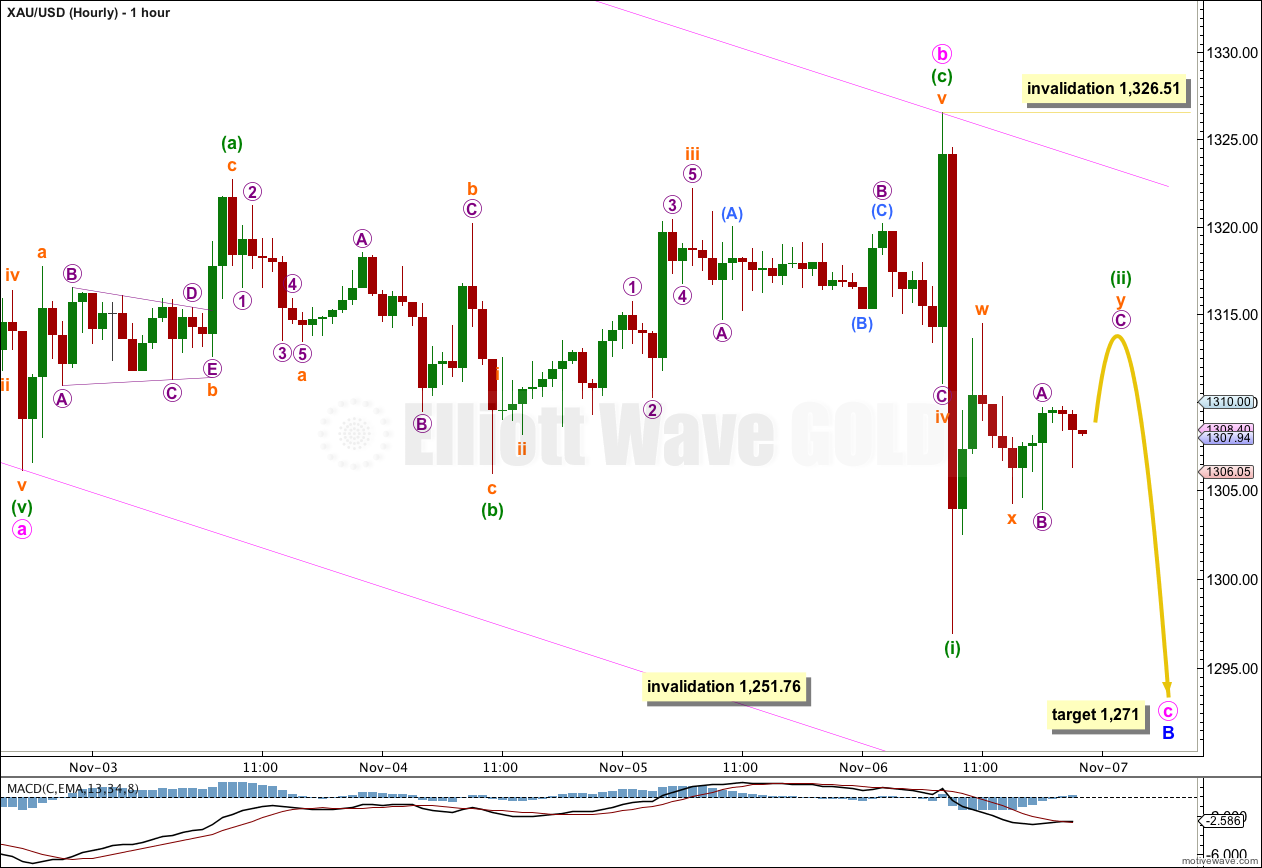
At this stage it is most likely that minute wave c is incomplete, and within it that only minuette wave (i) downwards is complete. I would expect minute wave c to continue to take price lower for another one or two days.
At 1,271 minute wave c would reach equality in length with minute wave a. I would expect minute wave c to find support at the lower edge of the parallel channel drawn about minor wave B downwards.
Within minute wave c minuette wave (ii) is probably an incomplete double combination: zigzag – X – flat. It should complete within a few hours. This should be followed by an increase in downwards momentum as a third wave unfolds.
Minuette wave (ii) may not move beyond the start of minuette wave (i). This wave count is invalidated with movement above 1,326.51.
If this wave count is invalidated by upwards movement then I would use the alternate below.
Alternate Hourly Wave Count.
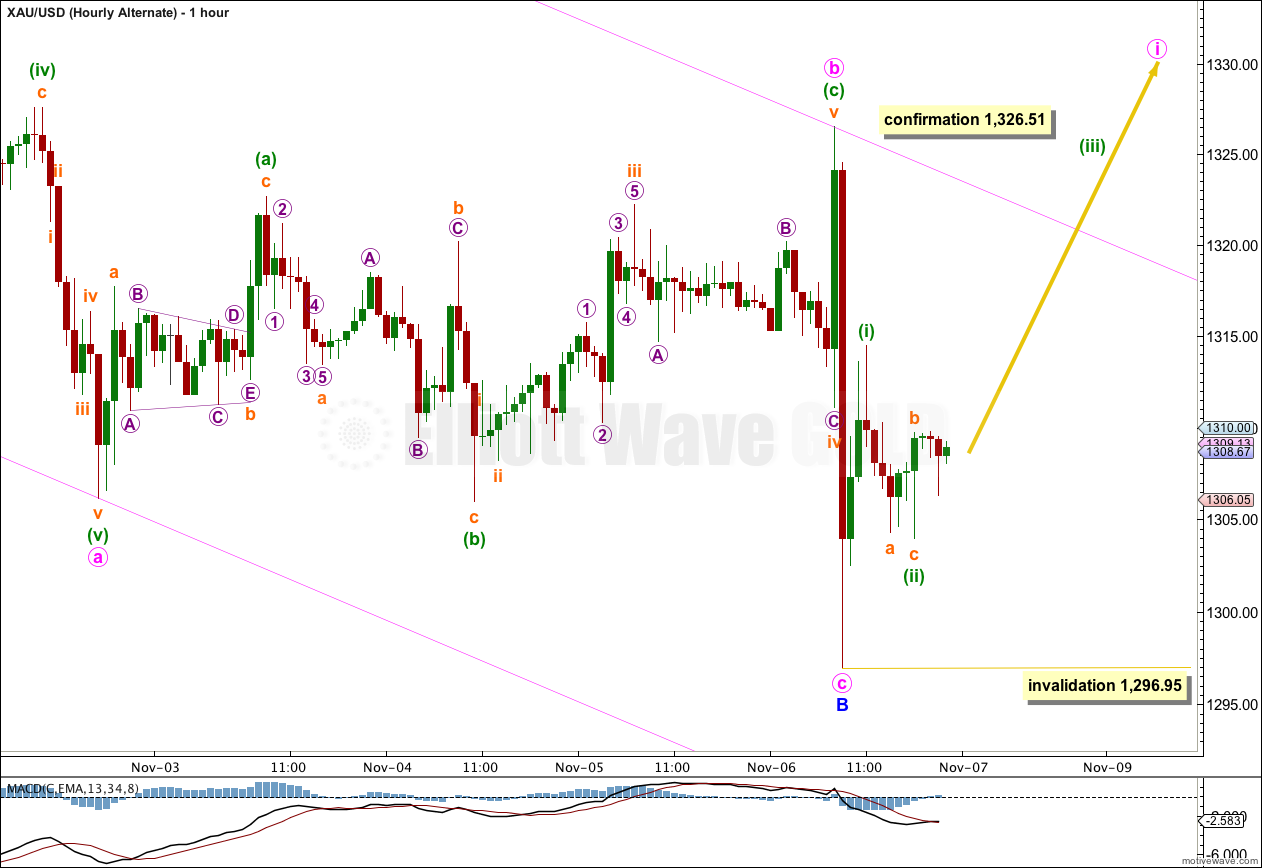
If we simply move the degree of labeling within minute wave c up one degree it is possible that it is complete. However, this wave count has a lower probability than the main hourly wave count above because it would see a remarkably short C wave within this zigzag, which has no Fibonacci ratio to the A wave. Also, on the five minute chart, the upwards wave labeled here minuette wave (i) within minor wave C subdivides best as a three wave zigzag; it does not fit well as a five wave impulse.
I would only use this wave count if it is confirmed with price movement above 1,326.51. At that stage I would expect that gold is in a new upwards trend to last several days to a couple of weeks.
*I will not publish the alternate daily wave count again for a few days for the sake of brevity. It remains valid, but has a lower probability. At this stage it does not diverge at all from this main wave count.
Lara, is there an analysis due for yesterday, Friday 8th Nov?
You have been pretty close this week.
I publish the end of week analysis often on Sunday EST.
I thought last week was pretty impressive actually. I got direction right five days in a row, and some targets were pretty close.
Impressive Lara.
Thank you! I’m really happy with this last week of analysis.
Next week gets more difficult – with a reasonable trend change expected.