
Movement below 1,244.74 has clarified the situation. At that stage the second hourly chart for the main wave count was confirmed, and more downwards movement was expected.
Today I have the same main daily chart and two hourly charts for you.
Click on the charts below to enlarge.
Main Wave Count.
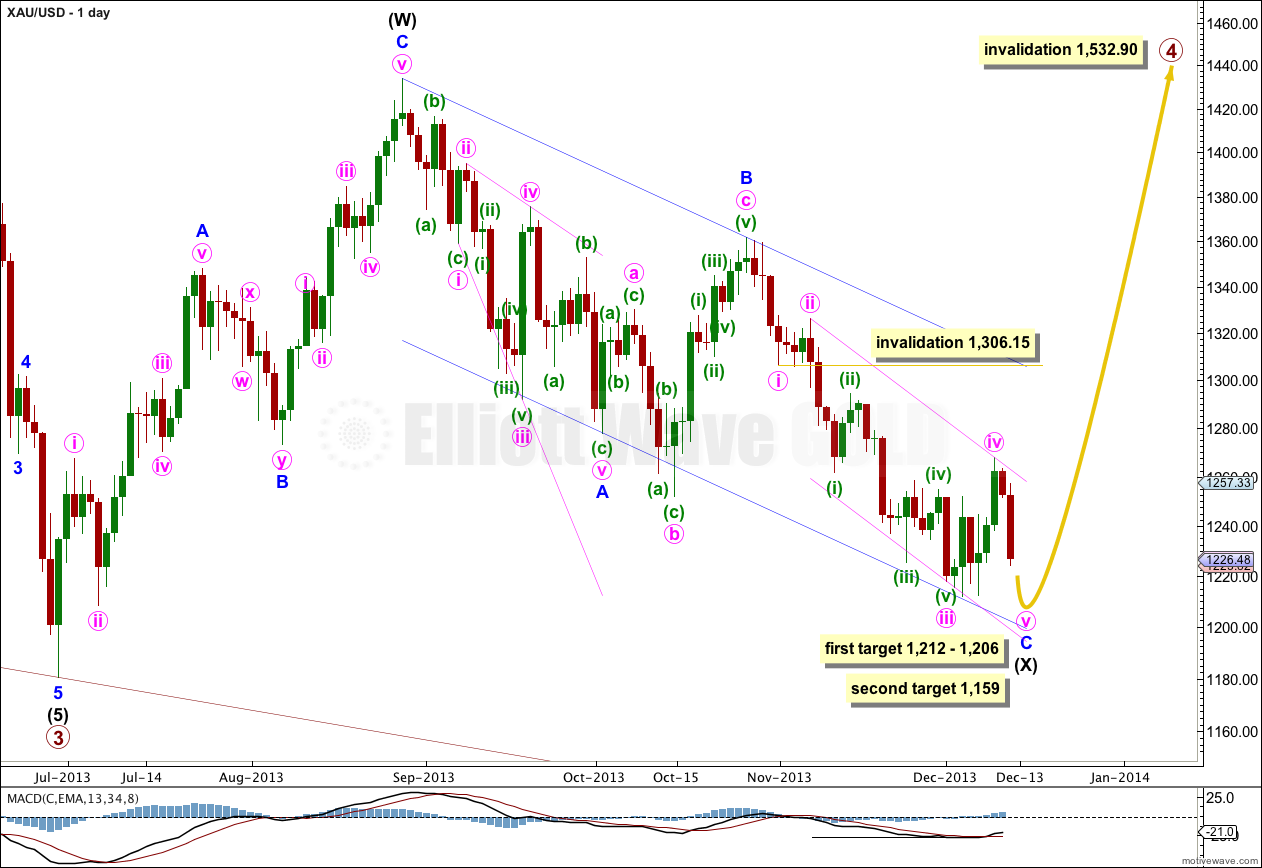
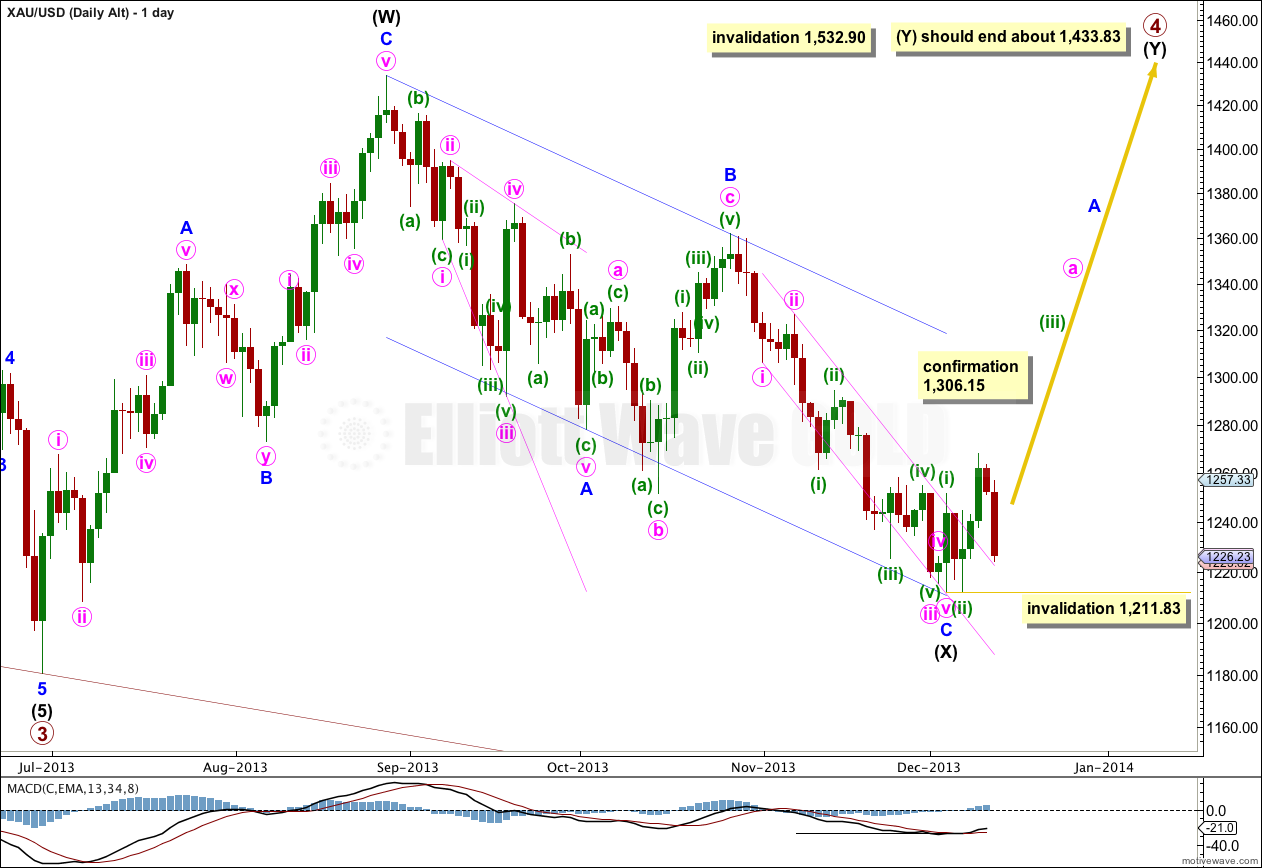
Gold is still within a large fourth wave correction at primary wave degree which is incomplete. To see a full explanation of my reasoning for expecting that primary wave 4 is not over and is continuing see this.
Primary wave 2 was a rare running flat correction, and was a deep 68% correction of primary wave 1. In order to show alternation in structure primary wave 4 may be a zigzag, double zigzag, combination, triangle or even an expanded or regular flat. We can rule out a zigzag because the first wave subdivides as a three. This still leaves several structural possibilities.
If primary wave 4 is a combination, expanded flat or running triangle then we may see a new low below 1,180.40 within it. This is why there is no lower invalidation point for intermediate wave (X).
If price reaches 1,205.74 then downwards movement labeled intermediate wave (X) would be 90% of upwards movement labeled intermediate wave (W). I would relabel primary wave 4 as an A-B-C flat correction. If price does not reach 1,205.74 then primary wave 4 is most likely a double combination.
Minor wave C must subdivide either as an ending diagonal or an impulse. It is clearly not an ending diagonal so it can only be an impulse. This impulsive structure is now almost complete, the final fifth wave downwards just needs to finish.
There was no Fibonacci ratio between minute waves iii and i within minor wave C. This makes it more likely we shall see a Fibonacci ratio exhibited between minute wave v and either of i or iii. The most common ratio for a fifth wave is equality with the first, which would be achieved at 1,212. Minor wave C would reach equality with minor wave A at 1,206. This gives a six dollar target zone calculated at two wave degrees.
Draw a parallel channel about minor wave C downwards with the first trend line from the highs labeled minute waves ii to iv, then place a parallel copy upon the low labeled minute wave iii. If it gets that low downwards movement should find support at the lower edge of this channel.
I would expect downwards movement to also find support at the lower edge of the parallel channel drawn here about intermediate wave (X).
Draw a parallel channel about the zigzag of intermediate wave (X): draw the first trend line from the start of minor wave A to the end of minor wave B, then place a parallel copy upon the end of minor wave A. When this channel is finally breached by upwards movement then I would consider that final confirmation that intermediate wave (Y) is underway.
Primary wave 4 may not move into primary wave 1 price territory. This wave count is invalidated with movement above 1,532.90.
First Hourly Chart For Main Wave Count.
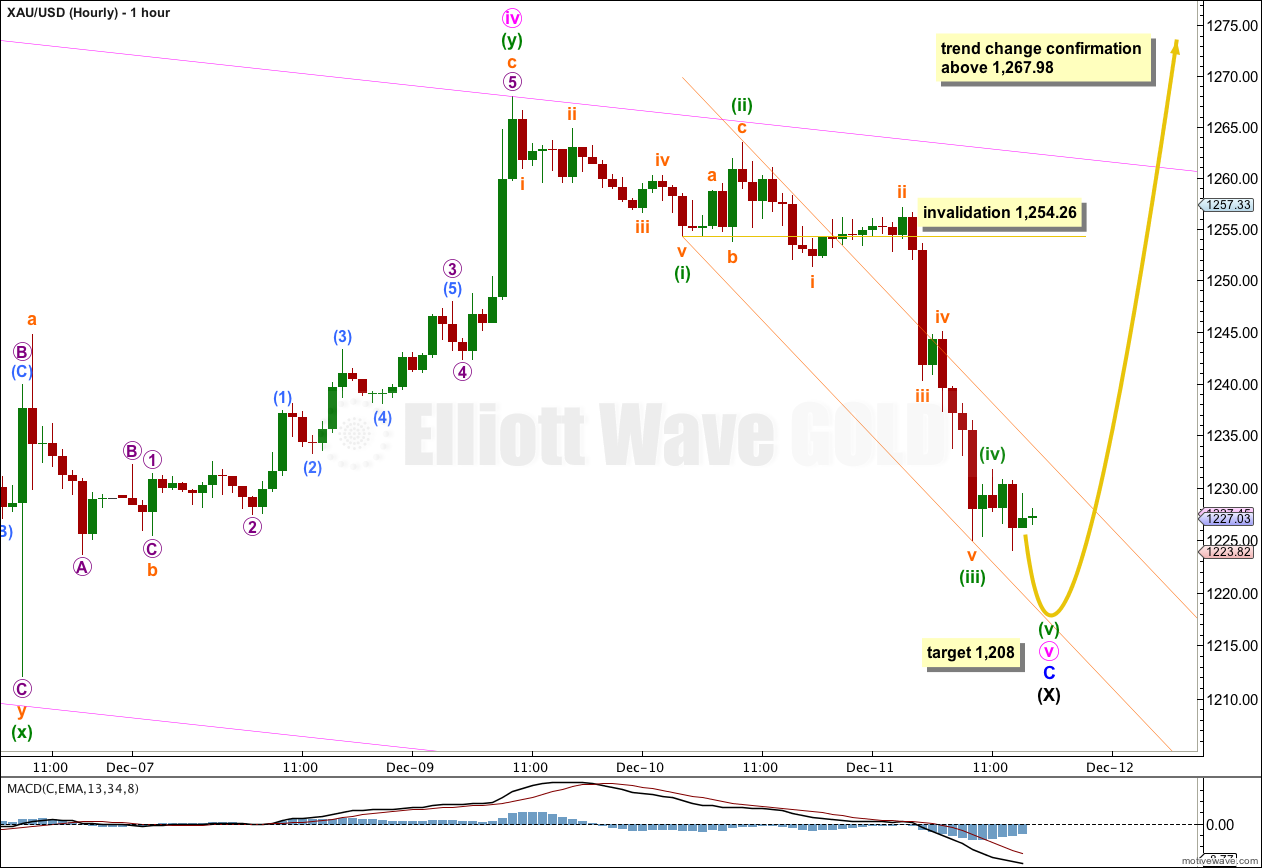
Minute wave iv completed as a double combination: flat – X – zigzag. It is not a typical looking combination, but the subdivisions fit perfectly.
Minute wave iv is showing some alternation with minute wave ii; minute wave ii was a shallow 36.5% regular flat correction, and minute wave iv is a deeper 46% double combination correction.
Within the downwards movement for minute wave v a third wave has completed. Minuette wave (iii) is 2.61 longer than 2.618 the length of minuette wave i.
Minuette wave (iv) may not be over; it could be continuing a little further as an expanded flat or double. If it does continue then it may not move into minuette wave (i) price territory. This wave count is invalidated with movement above 1,254.26.
If this main hourly wave count is correct then minute wave v is very close to completion and would reach equality with minute wave i at 1,212.
Within minute wave v minuette wave (v) would reach equality with minuette wave (i) at 1,208. This target is within the zone of 1,212 to 1,206, and so it may be used to narrow the target within the zone. I would favour 1,208 within the zone because it is calculated at the lowest wave degree.
This main wave count expects that minute wave v will not be extended. The alternate hourly wave count below expects that minute wave v will be extended.
When the downwards structure for minute wave v is a completed impulse then subsequent movement above 1,267.98 would confirm a trend change at intermediate degree. At that stage I would have confidence that Gold has begun on a new upwards trend to last several weeks or a few months.
Second Hourly Chart For Main Wave Count.
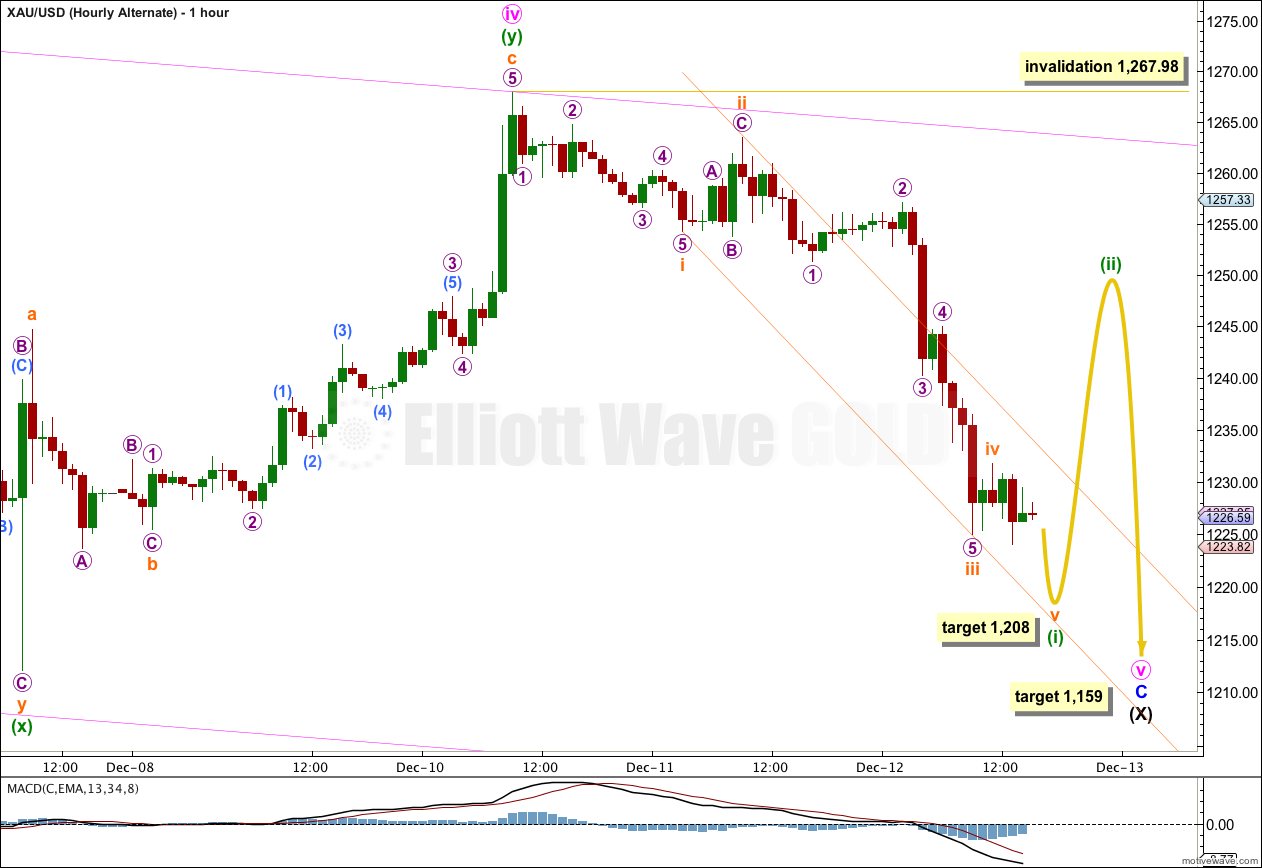
This alternate simply moves the degree of labeling within minute wave v down one degree. All the subdivisions are seen in exactly the same way.
It is possible that minute wave v will be extended. Within an impulse most often one of the actionary waves is extended, but sometimes two of the actionary waves are extended. Within minor wave C minute wave iii was extended and minute wave i was not extended. So it is possible minute wave v may also be extended. This is a possibility we must be aware of.
At 1,208 within minuette wave (i) subminuette wave v would reach equality with subminuette wave i. This would complete minuette wave (i). Minuette wave (ii) upwards should follow and may not move beyond the start of minuette wave (i) above 1,267.98.
If upwards movement subdivides as a three wave structure and remains below 1,267.98 then this alternate would be correct. If upwards movement subdivides as an impulsive structure then the main wave count would be correct.
At 1,159 minute wave v would reach equality in length with minute wave iii and would be extended. It would be expected to last about three or four weeks.
Alternate Daily Wave Count – Triangle.
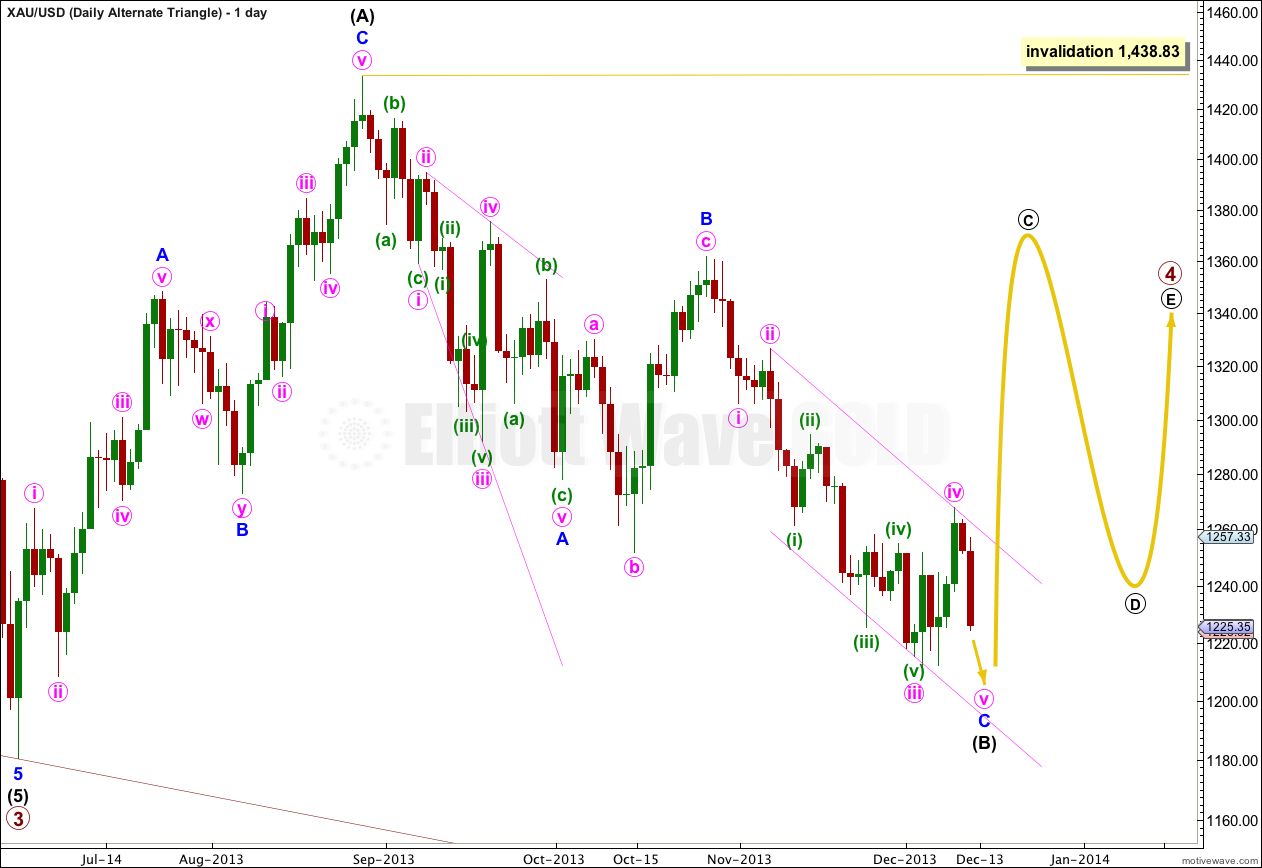
It is also possible that primary wave 4 may continue as a regular contracting (or barrier) triangle.
The expected direction and structure of this next upwards wave is the same, but for this alternate intermediate wave (C) of the triangle may not move beyond the end of intermediate wave (A). The triangle is invalidated with movement above 1,438.83.
The final intermediate wave (E) upwards may not move above the end of intermediate wave (C) for both a contracting and barrier triangle. E waves most commonly end short of the A-C trend line.
All five subwaves of a triangle must divide into corrective structures. If this next upwards movement subdivides as a zigzag which does not make a new high above 1,438.83 then this alternate would be correct.
Triangles take up time and move price sideways. If primary wave 4 unfolds as a triangle then I would expect it to last months rather than weeks.
Alternate Daily Wave Count – Bullish.
It has been suggested that Gold could have turned back up already at 1,211.83 six days ago. If that is the case then minor wave C downwards must be a completed five wave impulse. The only other structural possibility for minor wave C is an ending diagonal, which is clearly not.
The problem with this wave count is the structure of minor wave C. It has a best fit count of eight so far, and does not fit well as a completed impulse. This would see minute wave iv as lasting only one day and minute wave v extremely short. This wave count does not have the “right look”.
Within the first wave up of intermediate wave (Y) no second wave correction may move beyond the start of its first wave. This wave count is invalidated with movement below 1,211.83.
i might go with the bullish crowd on this one.
today’s downtrend bounced off all the fib retracement levels from the 1211 ->1267 high (except for passing straight thru the 38%).
it stopped less than $1 short of the 1222.9 (78% level).
so is this not most likely a wave 2 correction?