
Both the first and second hourly wave counts expected more downwards movement to a target at 1,208 before price turned upwards. We did see some downwards movement before price turned upwards, but it ended at 1,220.65, which is $12.65 short of the target.
Both wave counts remain the same and both remain valid.
Click on the charts below to enlarge.
Main Wave Count.
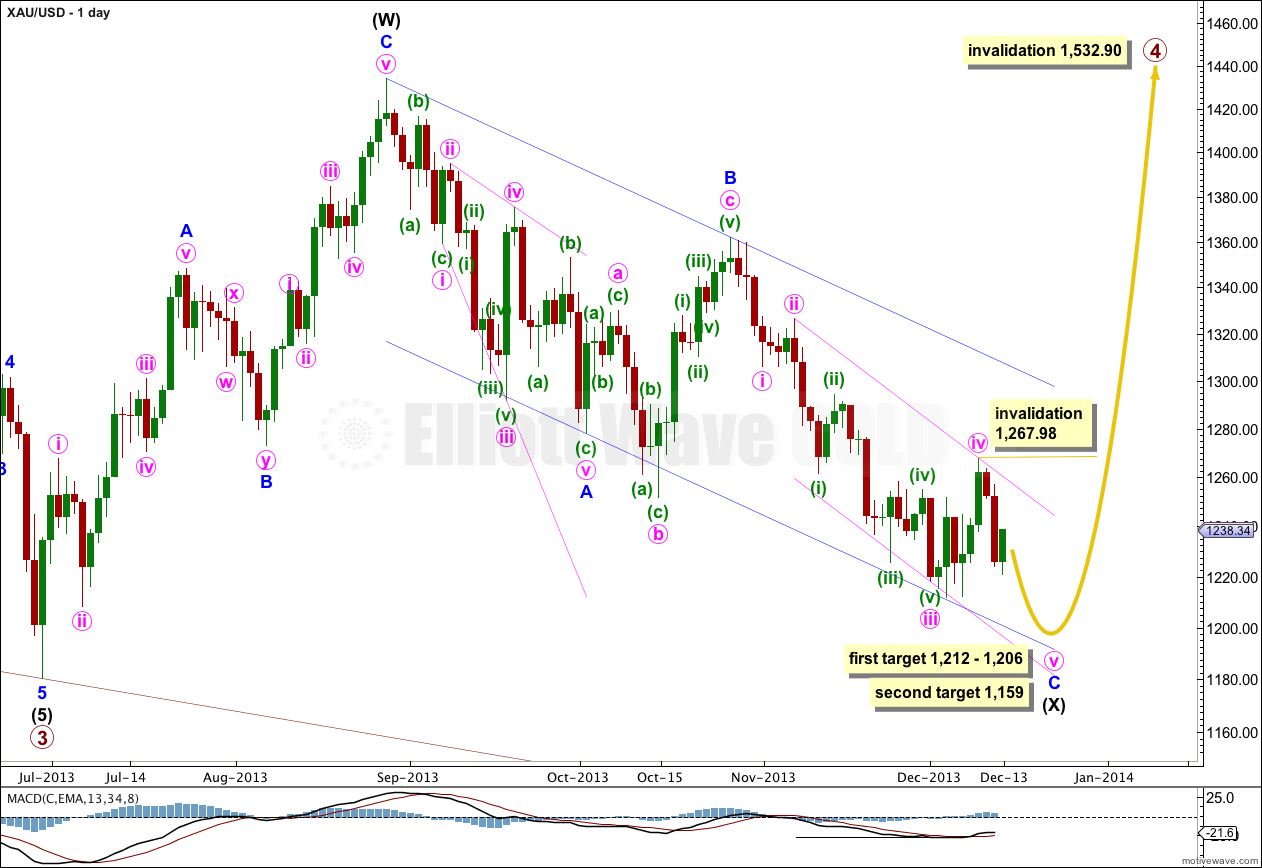
Gold is still within a large fourth wave correction at primary wave degree which is incomplete. To see a full explanation of my reasoning for expecting that primary wave 4 is not over and is continuing see this.
Primary wave 2 was a rare running flat correction, and was a deep 68% correction of primary wave 1. In order to show alternation in structure primary wave 4 may be a zigzag, double zigzag, combination, triangle or even an expanded or regular flat. We can rule out a zigzag because the first wave subdivides as a three. This still leaves several structural possibilities.
If primary wave 4 is a combination, expanded flat or running triangle then we may see a new low below 1,180.40 within it. This is why there is no lower invalidation point for intermediate wave (X).
If price reaches 1,205.74 then downwards movement labeled intermediate wave (X) would be 90% of upwards movement labeled intermediate wave (W). I would relabel primary wave 4 as an A-B-C flat correction. If price does not reach 1,205.74 then primary wave 4 is most likely a double combination.
Minor wave C must subdivide either as an ending diagonal or an impulse. It is clearly not an ending diagonal so it can only be an impulse. This impulsive structure is now almost complete; the final fifth wave downwards just needs to finish.
There was no Fibonacci ratio between minute waves iii and i within minor wave C. This makes it more likely we shall see a Fibonacci ratio exhibited between minute wave v and either of i or iii. The most common ratio for a fifth wave is equality with the first, which would be achieved at 1,212. Minor wave C would reach equality with minor wave A at 1,206. This gives a six dollar target zone calculated at two wave degrees.
At 1,159 minute wave v would reach equality in length with minute wave iii. At this stage this lower target may have a higher probability because it allows enough room for minute wave v to complete.
Draw a parallel channel about minor wave C downwards with the first trend line from the highs labeled minute waves ii to iv, then place a parallel copy upon the low labeled minute wave iii. If it gets that low downwards movement should find support at the lower edge of this channel.
I would expect downwards movement to also find support at the lower edge of the parallel channel drawn here about intermediate wave (X).
Draw a parallel channel about the zigzag of intermediate wave (X): draw the first trend line from the start of minor wave A to the end of minor wave B, then place a parallel copy upon the end of minor wave A. When this channel is finally breached by upwards movement then I would consider that final confirmation that intermediate wave (Y) is underway.
Primary wave 4 may not move into primary wave 1 price territory. This wave count is invalidated with movement above 1,532.90.
Main Hourly Wave Count.
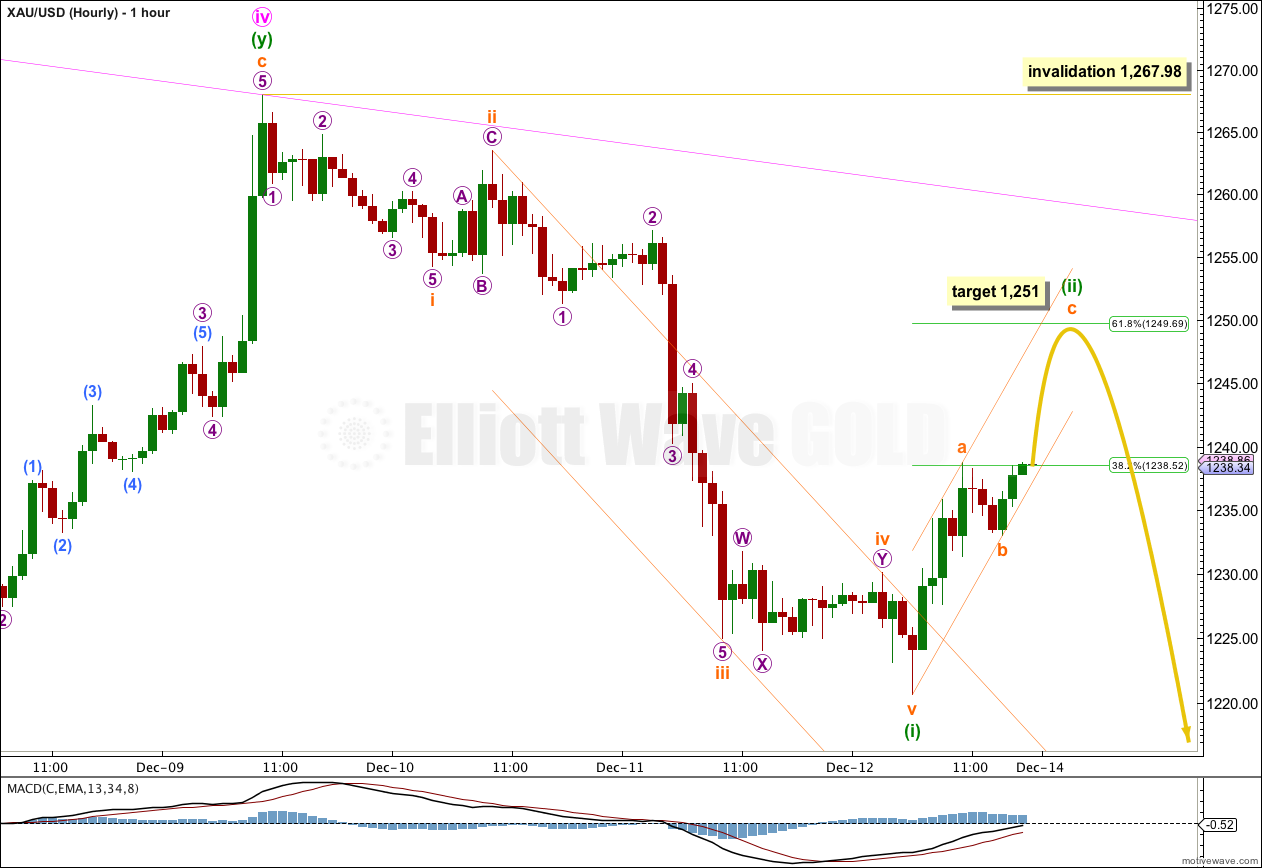
There is now a clear five wave structure downwards. This is most likely to be just minuette wave (i) within minute wave v, and so minute wave v would most likely be extending. This is most likely because the alternate below sees minute wave v as truncated, which reduces the probability of that wave count.
Ratios within minuette wave (i) are: subminuette wave iii is 2.61 longer than 2.618 the length of subminuette wave i, and subminuette wave v is 0.36 longer than 0.236 the length of subminuette wave iii.
When markets open for the new trading week I would expect some more upwards movement for minuette wave (ii). This second wave looks like it may be unfolding as a zigzag. At 1,251 subminuette wave c would reach equality in length with subminuette wave a and minuettte wave (ii) would reach to just above the 0.618 Fibonacci ratio of minuette wave (i) at 1,249.69.
I would expect subminuette wave c to most likely end at the upper edge of the parallel channel drawn about minuette wave (ii). When this channel is clearly breached by subsequent downwards movement that may be a first indication that minuette wave (iii) downwards has begun.
Minuette wave (iii) must make a new low below the end of minuette wave (i) at 1,220.65. When I know where minuette wave (ii) has ended then I can calculate a target downwards for minuette wave (iii) for you. I cannot do that today.
If minute wave v is most likely extending then the second, lower target (on the daily chart) would have a higher probability. At 1,159 minute wave v would reach equality in length with minute wave iii.
Minuette wave (ii) may not move beyond the start of minuette wave (i). This wave count is invalidated with movement above 1,267.98.
If price moves above 1,267.98 the alternate below would be confirmed.
Alternate Hourly Wave Count.
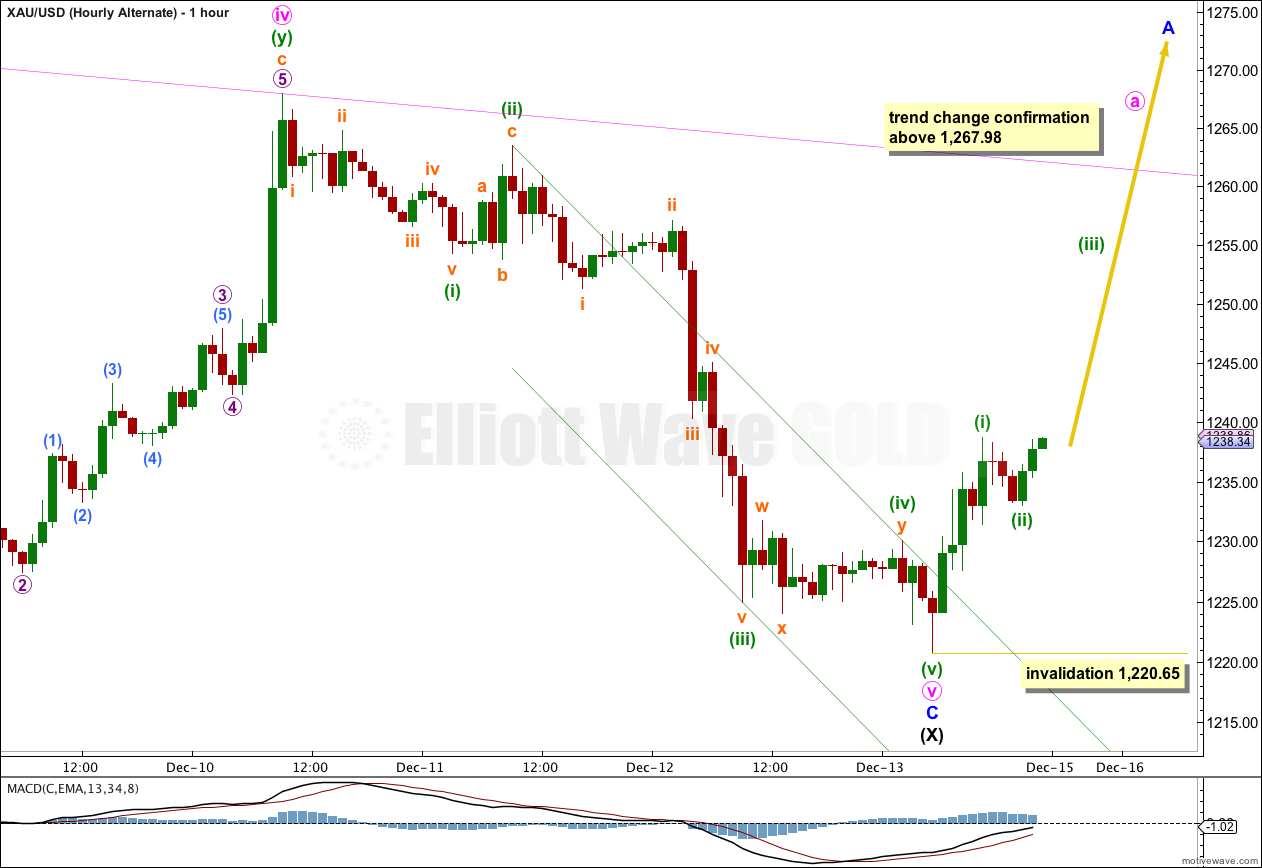
There is now a clear five wave structure downwards from the end of minute wave iv. It could be an end to minute wave v, but if this is the case minute wave v would be truncated. This truncation reduces the probability of this wave count.
The channel drawn about minute wave v is drawn using Elliott’s second technique, and it is now clearly breached by upwards movement. This indicates the downwards wave is over and the next wave is underway. It is either a second wave correction (main hourly wave count) or the very start of a new upwards trend which should last several weeks or a few months.
This alternate wave count requires confirmation with movement above 1,267.98 before I would have confidence in it.
Alternate Daily Wave Count – Triangle.
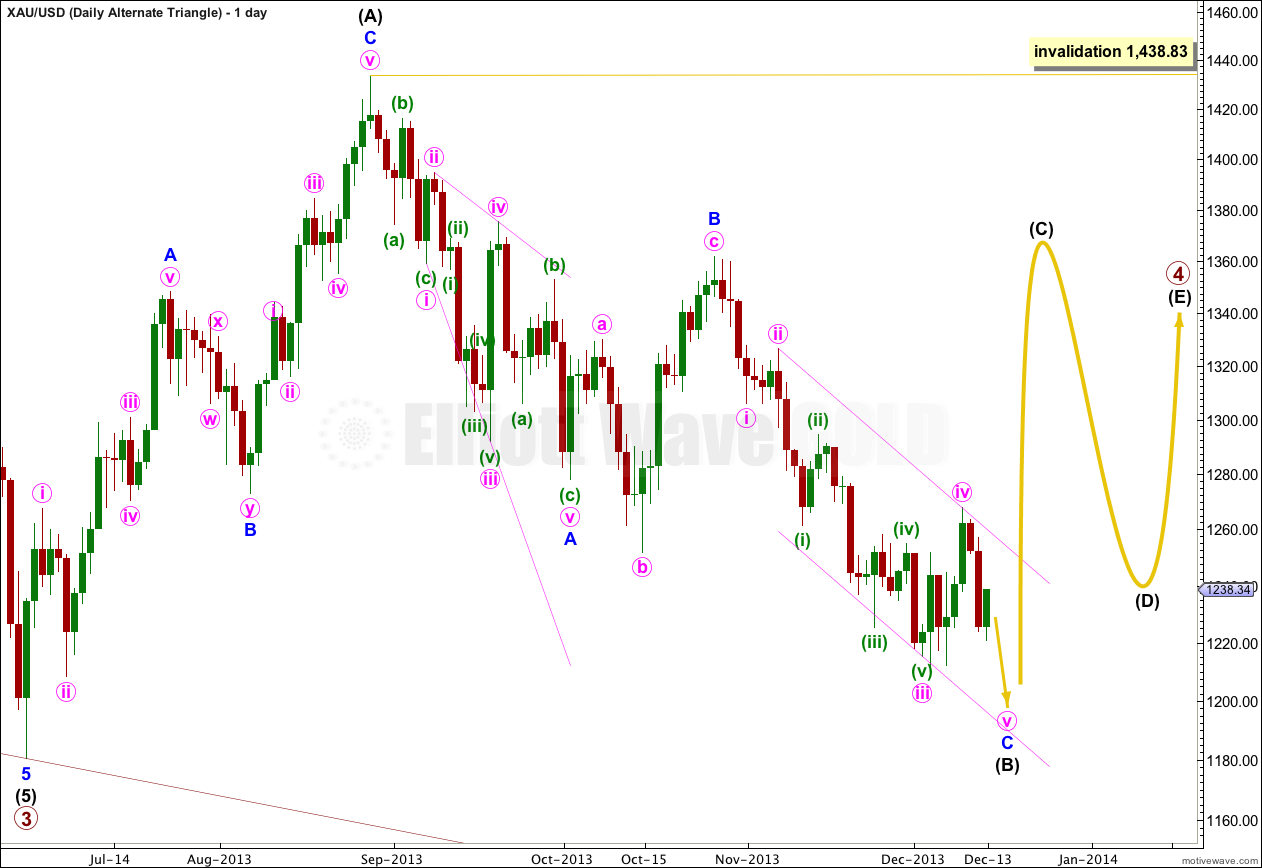
It is also possible that primary wave 4 may continue as a regular contracting (or barrier) triangle.
The expected direction and structure of this next upwards wave is the same, but for this alternate intermediate wave (C) of the triangle may not move beyond the end of intermediate wave (A). The triangle is invalidated with movement above 1,438.83.
The final intermediate wave (E) upwards may not move above the end of intermediate wave (C) for both a contracting and barrier triangle. E waves most commonly end short of the A-C trend line.
All five subwaves of a triangle must divide into corrective structures. If this next upwards movement subdivides as a zigzag which does not make a new high above 1,438.83 then this alternate would be correct.
Triangles take up time and move price sideways. If primary wave 4 unfolds as a triangle then I would expect it to last months rather than weeks.
Went long at 1230 and closed at 1246. Now just opened a short at 1245 with stop very close at 1252. Looking forward to the Gold update.
No. Because both wave counts are identical at the weekly chart level; at primary degree.
Dear Lara,
Main hourly wave count: wave v orange is a tree not five, I have double checked from 2 minutes to 15 minutes, not a five. I think I will carry with your main hourly wave count of yesterday: we have a wave iv orange that is ending ( expanded flat ).
Best Regards,
Emmanuel
You’re right.
Either subminuette wave iv is still unfolding, or the fifth wave does not begin where I’ve labeled it but slightly lower at 1,228.18.
If subminuette wave iv is continuing it would be over 6.5 times the duration of subminuette wave ii; wave ii was six hours, so far wave iv would be 39 hours.
Lara, do you think showing a weekly wave count would help determine whether the likely outcome between the main or alternative for next week? perhaps from the Jun 28 lows?
Lara, do you think showing a weekly wave count would help determine whether the likely outcome between the main or alternative for next week? perhaps from the Jun 28 lows?