
Last analysis expected a little more upwards movement towards a short term target at 1,210 before price turned lower. This is not what happened.
Last analysis stated that if Monday produced a red candlestick that the current fourth wave correction would be unlikely to be over.
Price has moved a little lower in a slow sideways moving day.
The wave count remains the same. I have two hourly charts for you today looking at two possible structures for the completion of this fourth wave.
Click on the charts below to enlarge.
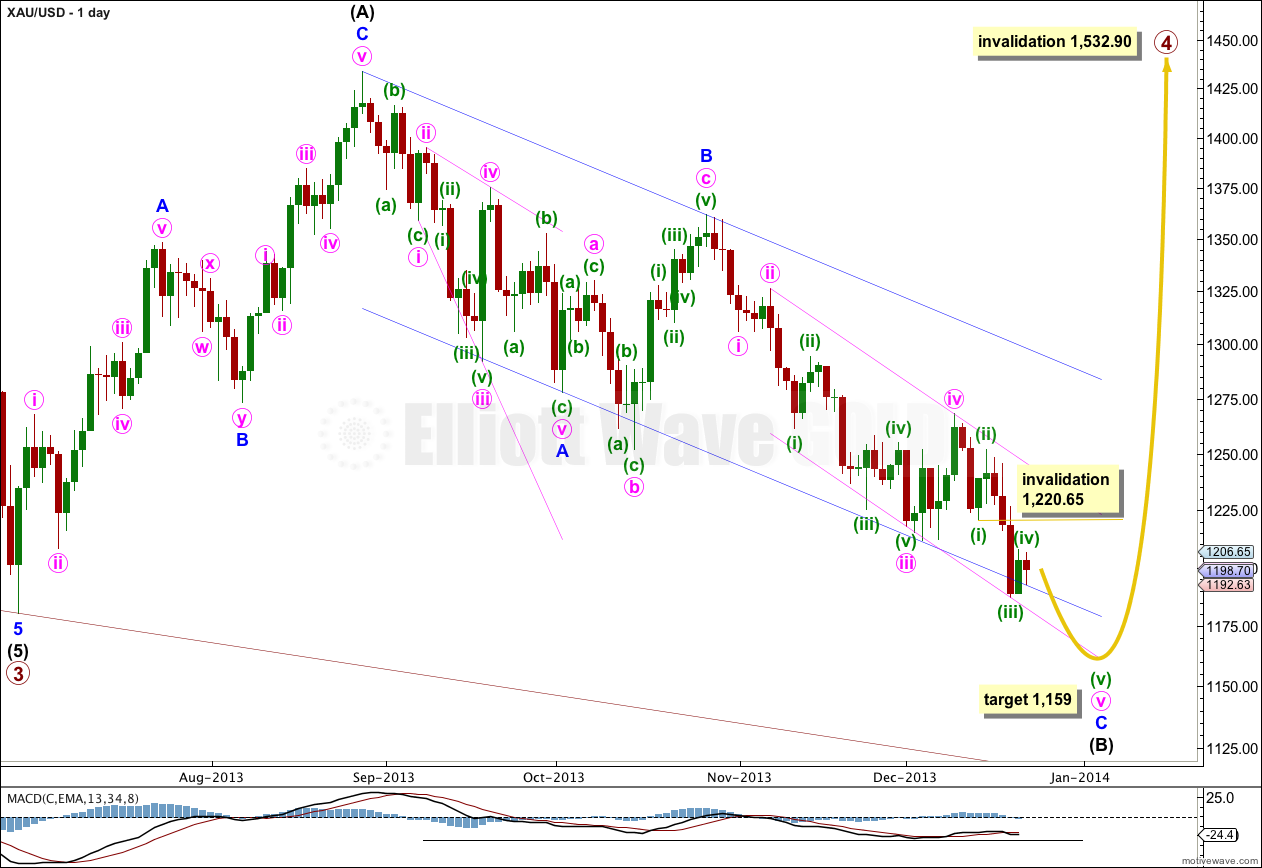
Gold is still within a large fourth wave correction at primary wave degree which is incomplete. To see a full explanation of my reasoning for expecting that primary wave 4 is not over and is continuing see this.
Primary wave 2 was a rare running flat correction, and was a deep 68% correction of primary wave 1. In order to show alternation in structure primary wave 4 may be a zigzag, double zigzag, combination, triangle or even an expanded or regular flat. We can rule out a zigzag because the first wave subdivides as a three. This still leaves several structural possibilities.
The downwards wave labeled intermediate wave (B) is now over 90% the length of the upwards wave labeled intermediate wave (A). Primary wave 4 may be a flat correction, but it may also still be a combination or triangle as there are still several different structural possibilities.
At 1,167.73 intermediate wave (B) would be 105% the length of intermediate wave (A), and primary wave 4 may be an expanded flat correction. Expanded flats normally have C waves which move substantially beyond the end of the A wave, and which are often 1.618 and sometimes 2.618 the length of the A wave. If 1,167.73 is reached and passed then the subsequent upwards wave for intermediate wave (C) may reach well above 1,433.83.
Within minor wave C there was no Fibonacci ratio between minute waves iii and i. This makes it more likely we shall see a Fibonacci ratio exhibited between minute wave v and either of i or iii. At 1,159 minute wave v would reach equality in length with minute wave iii. This lower target allows enough room for minute wave v to complete.
Downwards movement has breached the parallel channel drawn about intermediate wave (B) downwards, and it has found support at the next trend line.
Draw a parallel channel about minor wave C downwards with the first trend line from the highs labeled minute waves ii to iv, then place a parallel copy upon the low labeled minute wave iii. Downwards movement is finding support at the lower edge of this channel.
When the channel about intermediate wave (B) is finally breached by upwards movement then I would consider that final confirmation that intermediate wave (C) is underway.
Primary wave 4 may not move into primary wave 1 price territory. This wave count is invalidated with movement above 1,532.90.
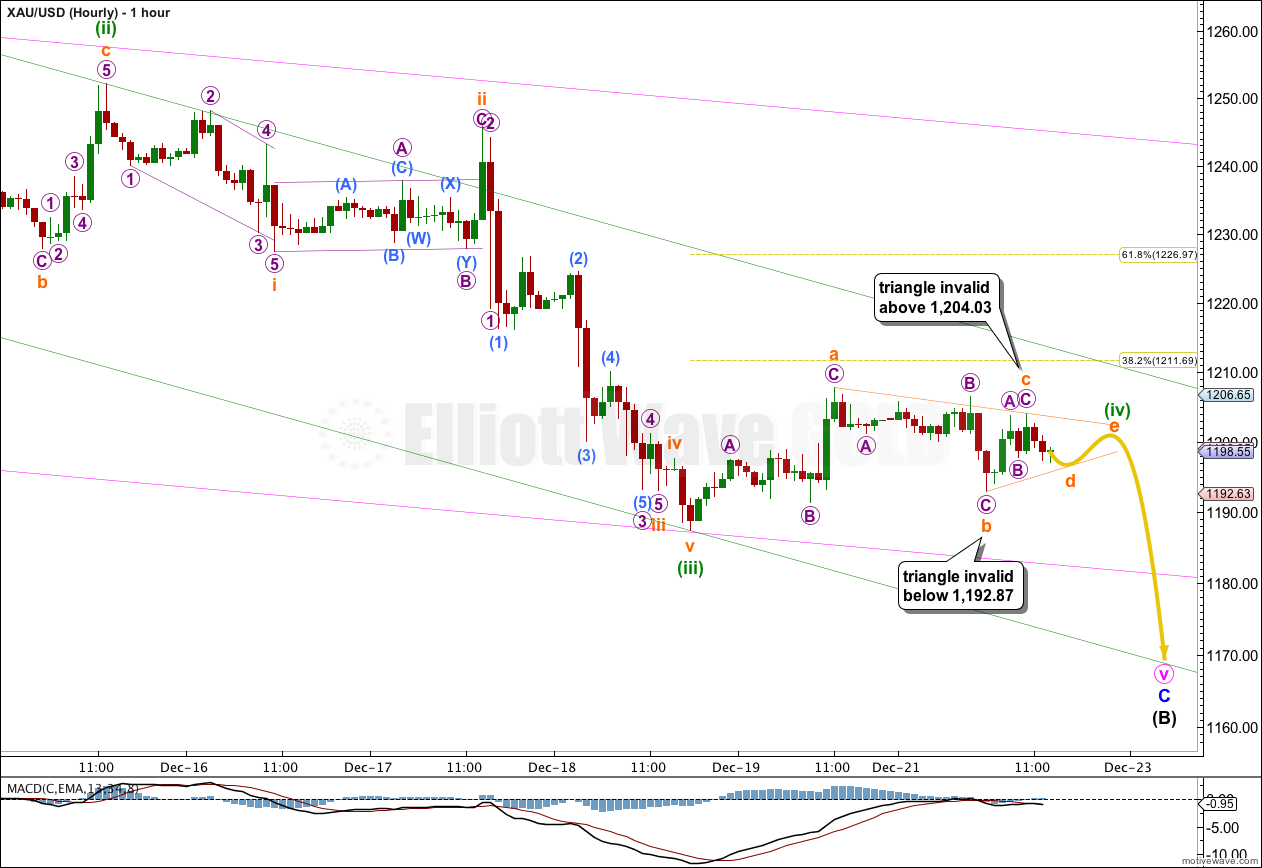
Upwards movement for Friday is showing up very clearly on the daily chart, and so it is most likely to be minuette wave (iv).
This leaves subminuette waves ii and iv out of proportion on the hourly chart though. I have looked at alternate ways to see minuette wave (iii) and there is more than one way to label this downwards movement. The second hourly chart below looks at a different possibility, but the subdivisions do not fit quite as well.
Minuette wave (ii) was a relatively deep 66% zigzag correction. Given the guideline of alternation I would expect minuette wave (iv) to be more shallow, and to not be a zigzag.
Minuette wave (iv) may be unfolding as a triangle. Within the triangle subminuette wave d may not move beyond the end of subminuette wave b below 1,192.87. The following final wave of the triangle subminuette wave e may not move beyond the end of subminuette wave c above 1,204.03. If the triangle completes and remains valid then keep drawing the trend lines about the triangle and extend them to the right. The point in time at which the trend lines cross over may see a trend change, and that may be where the following fifth wave downwards ends.
Draw a parallel channel about minute wave v. Draw the first trend line from the lows of minuette waves (i) to (iii), place a parallel copy upon the high of minuette wave (ii). I would expect minuette wave (iv) to find resistance at the upper edge of that channel.
When minuette wave (iv) is complete then one final wave down may complete the entire structure at intermediate wave degree. When minuette wave (iv) is complete then I will add to the target calculation at minuette wave degree so the final target at 1,159 may widen to a small zone or it may change.
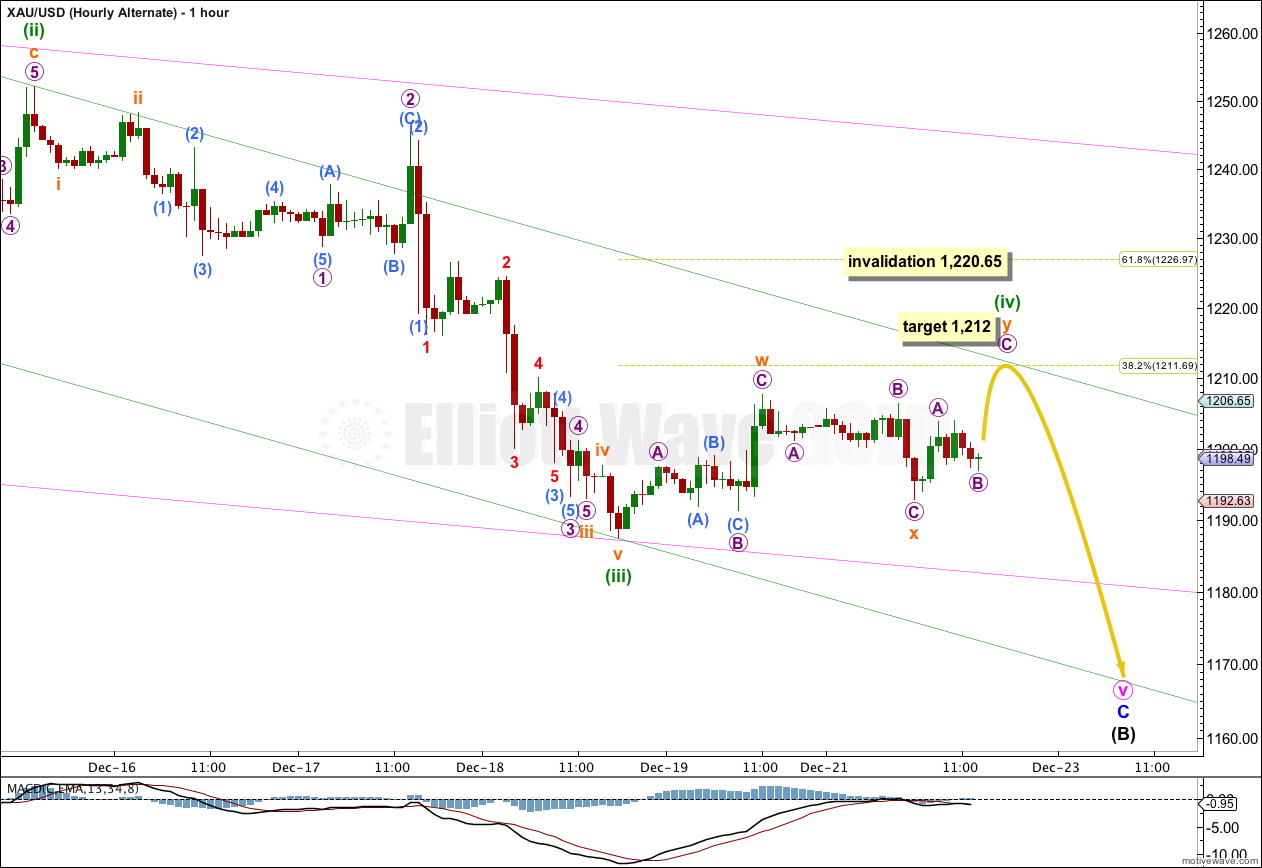
Alternatively, it is possible that minuette wave (iv) is completing as a double zigzag or double combination. Both of these structures would also provide alternation with minuette wave (ii) single zigzag.
If price moves above 1,204.03 then I would expect upwards movement to end about the upper edge of the green channel drawn about minute wave v, and it may end about the 0.382 Fibonacci ratio at 1,212.
Minuette wave (iv) may not move into minuette wave (i) price territory. This wave count is invalidated with movement above 1,220.65.
Alternate Daily Wave Count – Triangle.
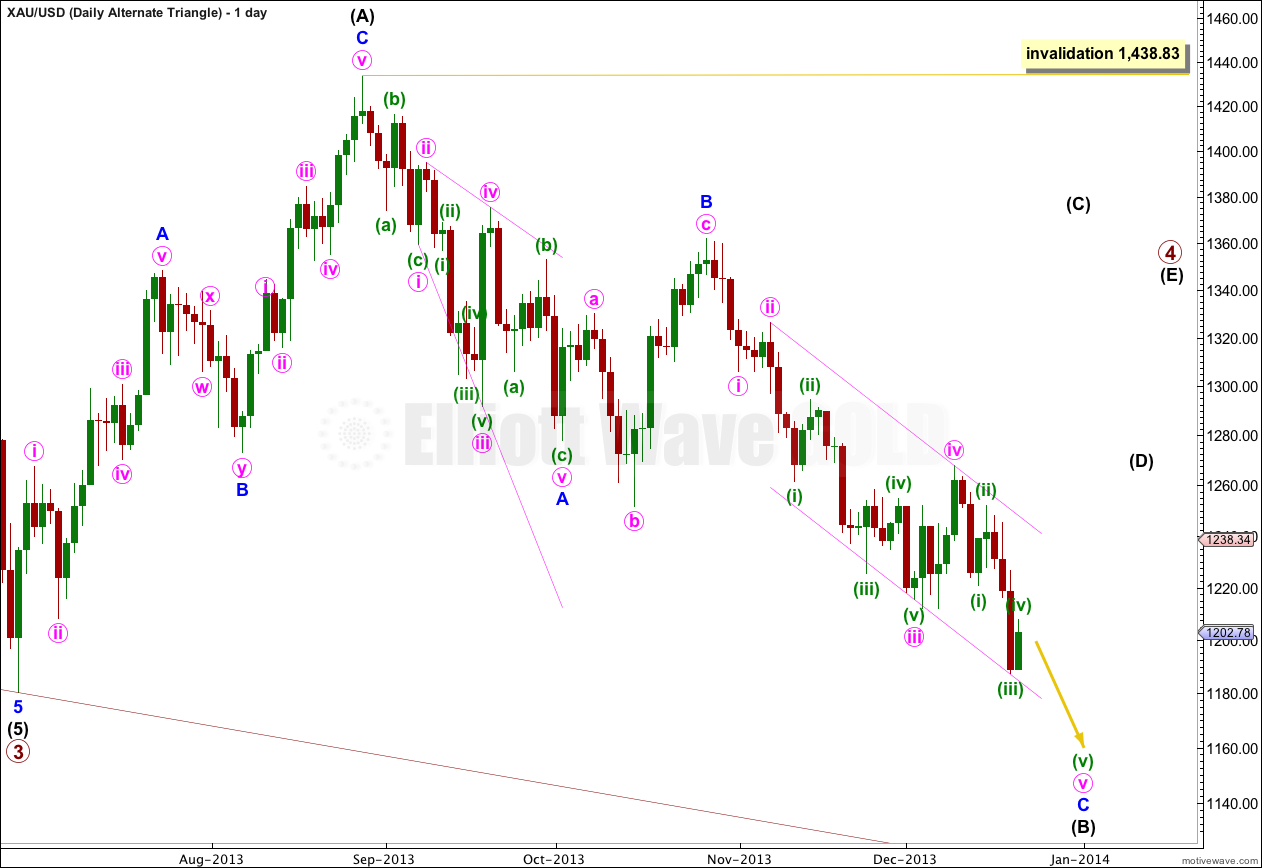
It is also possible that primary wave 4 may continue as a regular contracting (or barrier) triangle.
A new low below 1,180.40 is also possible for this wave count if the triangle is a running triangle, as about 40% of triangles are.
The expected direction and structure of this next upwards wave is the same, but for this alternate intermediate wave (C) of the triangle may not move beyond the end of intermediate wave (A). The triangle is invalidated with movement above 1,438.83.
The final intermediate wave (E) upwards may not move above the end of intermediate wave (C) for both a contracting and barrier triangle. E waves most commonly end short of the A-C trend line.
All five subwaves of a triangle must divide into corrective structures. If this next upwards movement subdivides as a zigzag which does not make a new high above 1,438.83 then this alternate would be correct.
Triangles take up time and move price sideways. If primary wave 4 unfolds as a triangle then I would expect it to last months rather than weeks.