
Last analysis expected a continuation of a fourth wave correction, with two hourly charts for two possible structures.
The triangle was invalidated and this fourth wave subdivides nicely as a double zigzag, which may now be complete.
Click on the charts below to enlarge.
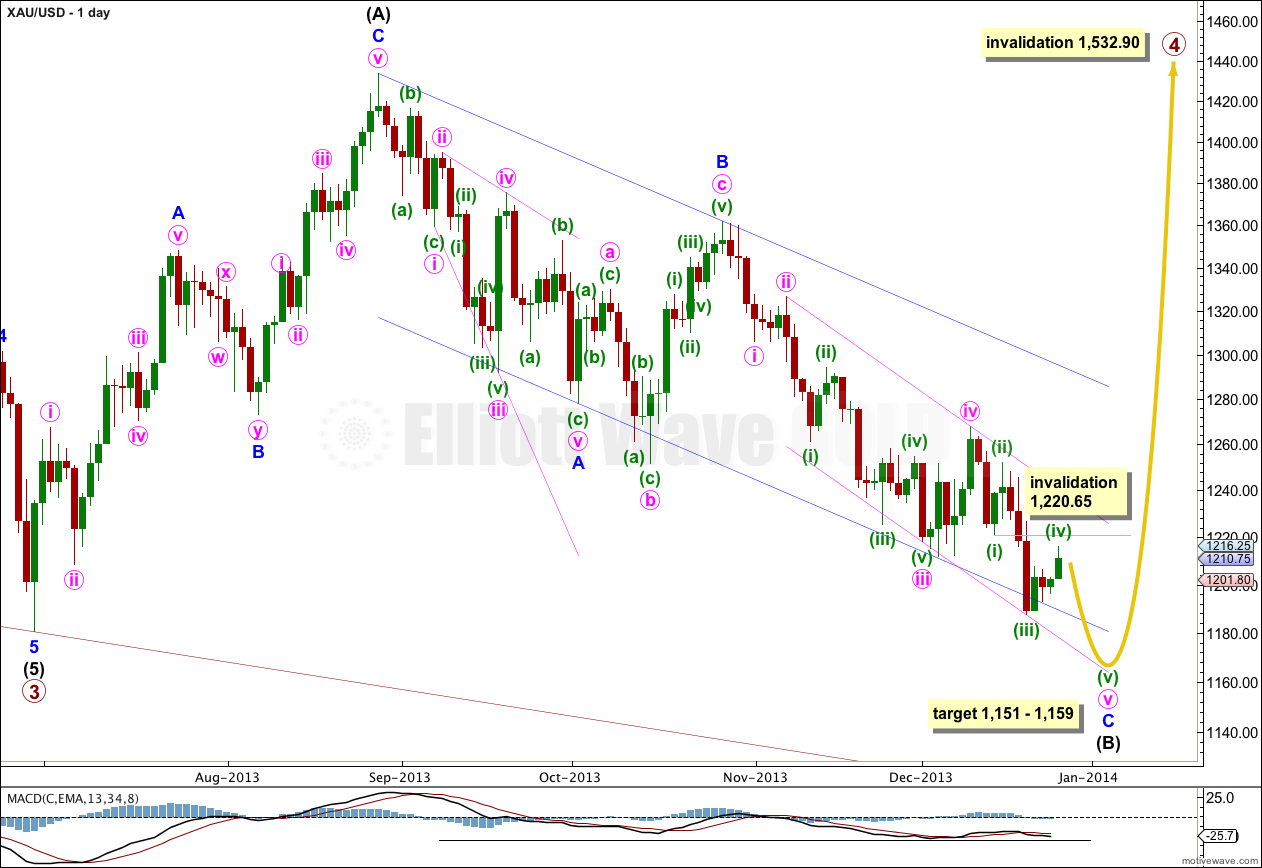
Gold is still within a large fourth wave correction at primary wave degree which is incomplete. To see a full explanation of my reasoning for expecting that primary wave 4 is not over and is continuing see this.
Primary wave 2 was a rare running flat correction, and was a deep 68% correction of primary wave 1. In order to show alternation in structure primary wave 4 may be a zigzag, double zigzag, combination, triangle or even an expanded or regular flat. We can rule out a zigzag because the first wave subdivides as a three. This still leaves several structural possibilities.
The downwards wave labeled intermediate wave (B) is now over 90% the length of the upwards wave labeled intermediate wave (A). Primary wave 4 may be a flat correction, but it may also still be a combination or triangle as there are still several different structural possibilities.
At 1,167.73 intermediate wave (B) would be 105% the length of intermediate wave (A), and primary wave 4 may be an expanded flat correction. Expanded flats normally have C waves which move substantially beyond the end of the A wave, and which are often 1.618 and sometimes 2.618 the length of the A wave. If 1,167.73 is reached and passed then the subsequent upwards wave for intermediate wave (C) may reach well above 1,433.83.
Within minor wave C there was no Fibonacci ratio between minute waves iii and i. This makes it more likely we shall see a Fibonacci ratio exhibited between minute wave v and either of i or iii. At 1,159 minute wave v would reach equality in length with minute wave iii. This lower target allows enough room for minute wave v to complete.
Downwards movement has breached the parallel channel drawn about intermediate wave (B) downwards, and it has found support at the next trend line.
Draw a parallel channel about minor wave C downwards with the first trend line from the highs labeled minute waves ii to iv, then place a parallel copy upon the low labeled minute wave iii. Downwards movement is finding support at the lower edge of this channel.
When the channel about intermediate wave (B) is finally breached by upwards movement then I would consider that final confirmation that intermediate wave (C) is underway.
Primary wave 4 may not move into primary wave 1 price territory. This wave count is invalidated with movement above 1,532.90.
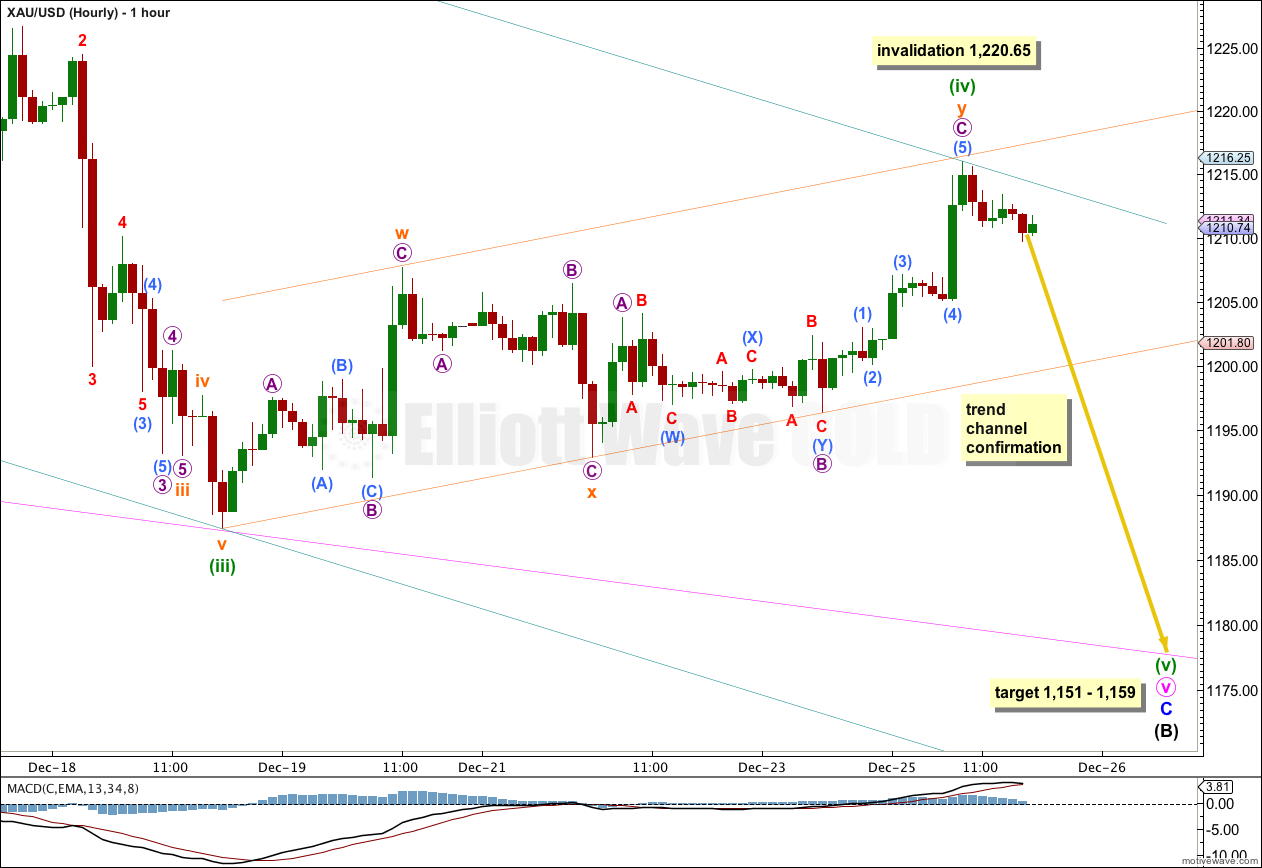
The target for this double structure to end was about 1,212. Upwards movement has reached to 1,216.02 and is most likely to be over now.
As a double zigzag minuette wave (iv) exhibits alternation in structure with minuette wave (ii) being a single zigzag.
I have drawn a best fit parallel channel about this upwards movement. Draw the first trend line from the start of minuette wave (iv) to the end of subminuette wave x, then place a parallel copy upon the high of subminuette wave w. This channel shows perfectly where price continues to find support and resistance. Minuette wave (iv) may have recently ended at the upper edge of the channel. When this channel is clearly breached by downwards movement I would have confidence that minuette wave (iv) is over and minuette wave (v) is underway.
The parallel channel drawn about minute wave v was overshot by upwards movement, and so I have redrawn it using Elliott’s second technique. Draw the first trend line from the highs of minuette waves (ii) to (iv), then place a parallel copy upon the low of minuette wave (iii). If downwards movement breaches the larger pink channel drawn about minor wave C, then expect downwards movement to find support at the lower edge of this green channel.
Within minute wave v so far there is no Fibonacci ratio between minuette waves (iii) and (i). This makes it more likely we shall see a Fibonacci ratio between minuette wave (v) and either of (iii) or (i). At 1,151 minuette wave (v) would reach equality in length with minuette wave (iii). This gives us an $8 target zone, and I favour the lower end because it is calculated at a lower wave degree.
While price remains within the parallel channel containing minuette wave (iv) I must accept the slim possibility that this correction may not be over. Minuette wave (iv) may not move into minuette wave (i) price territory. This wave count is invalidated with movement above 1,220.65.
Alternate Daily Wave Count – Triangle.
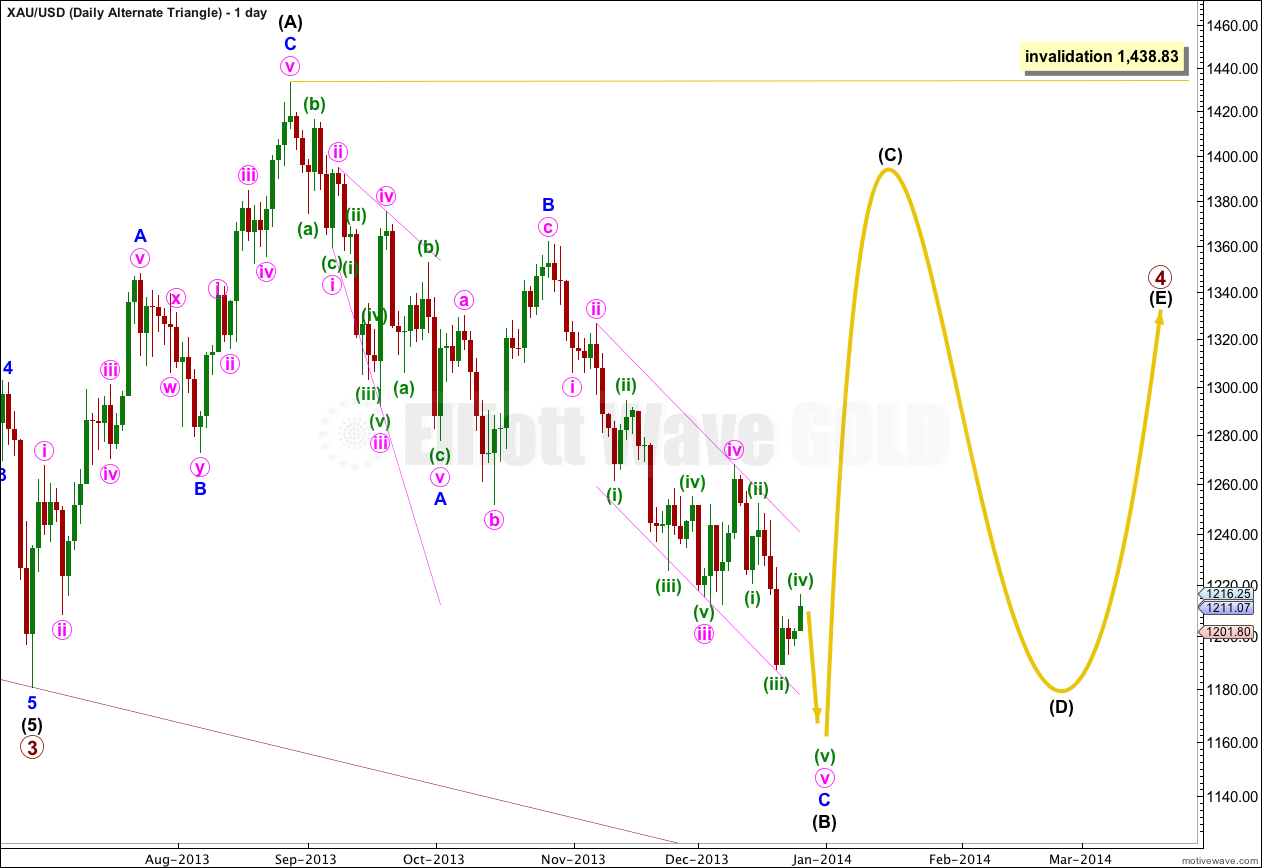
It is also possible that primary wave 4 may continue as a regular contracting (or barrier) triangle.
A new low below 1,180.40 is also possible for this wave count if the triangle is a running triangle, as about 40% of triangles are.
The expected direction and structure of this next upwards wave is the same, but for this alternate intermediate wave (C) of the triangle may not move beyond the end of intermediate wave (A). The triangle is invalidated with movement above 1,438.83.
The final intermediate wave (E) upwards may not move above the end of intermediate wave (C) for both a contracting and barrier triangle. E waves most commonly end short of the A-C trend line.
All five subwaves of a triangle must divide into corrective structures. If this next upwards movement subdivides as a zigzag which does not make a new high above 1,438.83 then this alternate would be correct.
Triangles take up time and move price sideways. If primary wave 4 unfolds as a triangle then I would expect it to last months rather than weeks.