
Yesterday’s short term target was at 1,212 for the end of a fifth wave. Downwards movement ended at 1,215.36, 3.36 short of the target. The structure looks complete.
The wave count is unchanged from yesterday.
Click on the charts below to enlarge.
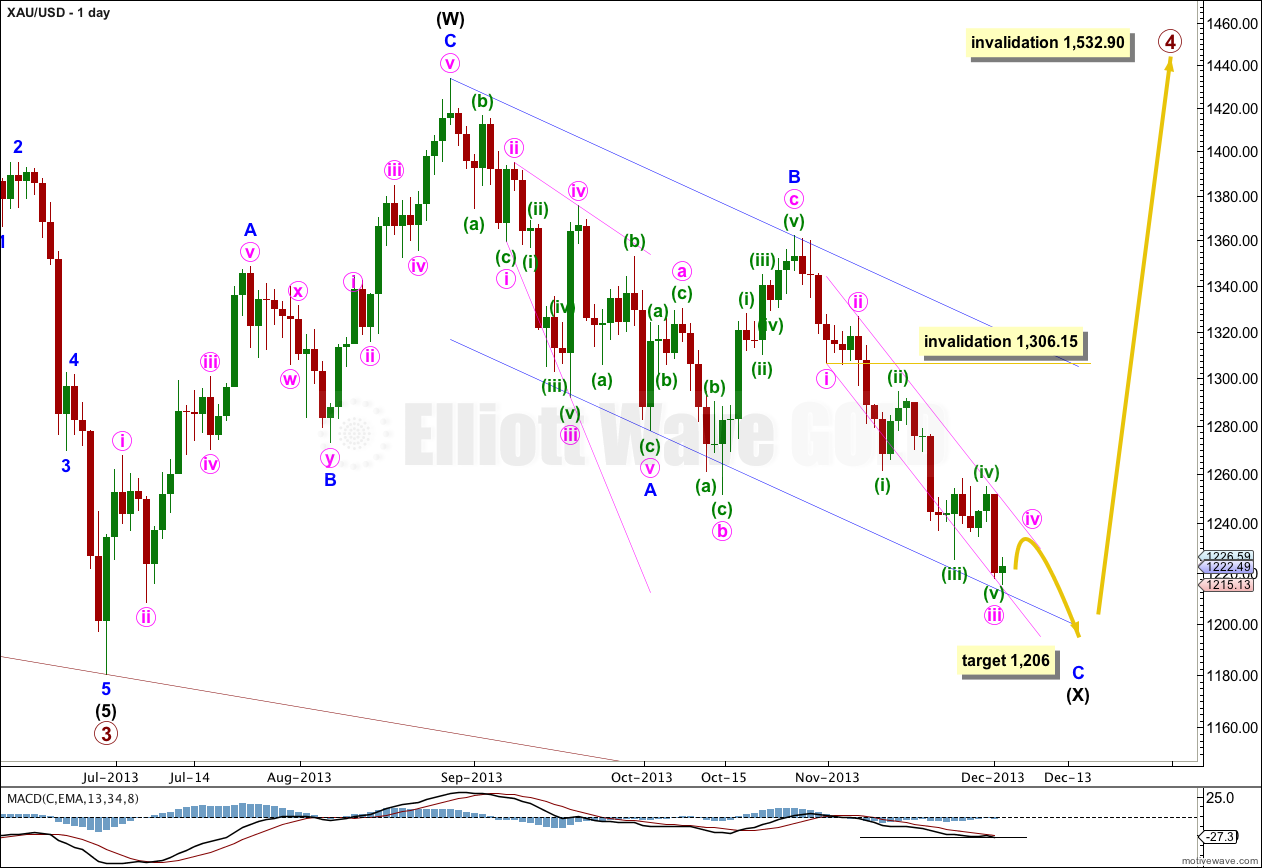
Gold is still within a large fourth wave correction at primary wave degree which is incomplete. It is unlikely that primary wave 4 was over at 1,433.83 as a single zigzag because it would have lasted only nine weeks. Its counterpart primary wave 2 lasted 53 weeks. This is too big a difference for the wave count to have the “right look”.
Primary wave 4 may be continuing as a flat, double combination or possibly a triangle. If price reaches 1,205.74 then downwards movement labeled intermediate wave (X) would be 90% of upwards movement labeled intermediate wave (W). I would relabel primary wave 4 as an A-B-C flat correction. If price does not reach 1,205.74 then primary wave 4 is most likely a double combination.
Within intermediate wave (X) zigzag downwards minor wave C has an extended third wave which is now just complete.
I have redrawn the parallel channel about minor wave C downwards. Draw the first trend line from the lows labeled minute waves i to iii, then place a parallel copy upon the lows labeled minute waves i to iii, then place a parallel copy upon the high labeled minute wave ii. I would expect minute wave iv to find resistance at the upper edge of the channel, and it may end there.
I would expect downwards movement to find support at the lower edge of the parallel channel drawn here about intermediate wave (X).
I have drawn a parallel channel about the zigzag of intermediate wave (X) using Elliott’s technique for a correction. Draw the first trend line from the start of minor wave A to the end of minor wave B. Place a parallel copy upon the end of minor wave A. When this channel is finally breached by upwards movement then I would consider that final confirmation that intermediate wave (Y) is underway.
Primary wave 4 may not move into primary wave 1 price territory. This wave count is invalidated with movement above 1,532.90.
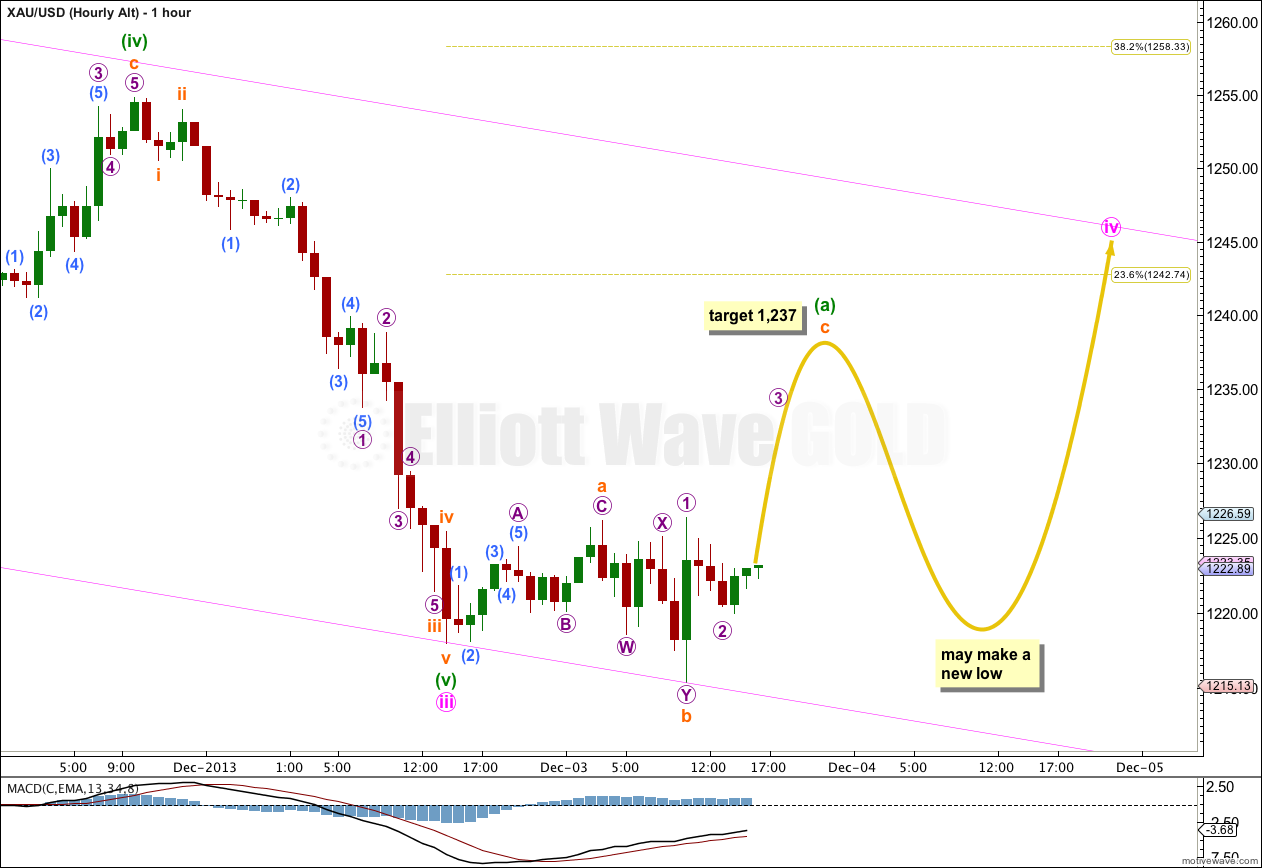
I have copied over the pink channel from the daily chart. I would expect minute wave iv to find resistance at the upper trend line.
Minute wave ii was a shallow 36.5% regular flat correction. If minute wave iv ends about the 0.236 Fibonacci ratio of minute wave iii at 1,240.72 then it may end at the upper trend line and would show alternation in depth with minute wave ii.
So far movement within minute wave iv looks like the start of a combination or flat correction. If it is a combination or expanded flat then it would show alternation in structure with minute wave ii. Minute wave iv may also be a running triangle.
If minute wave iv is a combination, expanded flat or running triangle then within it there may be a new low below 1,215.36, and so there can be no lower invalidation point.
Within minute wave iv minuette wave (a) looks like it is unfolding as a three wave structure, and expanded flat. Within minuette wave (a) subminuette wave b is a 131% correction of minuette wave (a). Minuette wave (c) may be incomplete. At 1,237 it would reach 2.618 the length of minuette wave (a).
When minuette wave (a) is complete then I would expect downwards movement for minuette wave (b) which may make a new low below the start of minuette wave (a).
At this very early stage there are several different structural possibilities for minute wave iv. Overall I would expect very choppy, overlapping sideways and upwards movement for about four days. As this corrective structure unfolds and becomes clearer the labeling within it will probably change.
Minute wave ii lasted four days, and I would expect minute wave iv to be about the same duration.
Minute wave iv may not move into minute wave i price territory. This wave count is invalidated with movement above 1,306.15.
Alternate Daily Wave Count – Triangle.
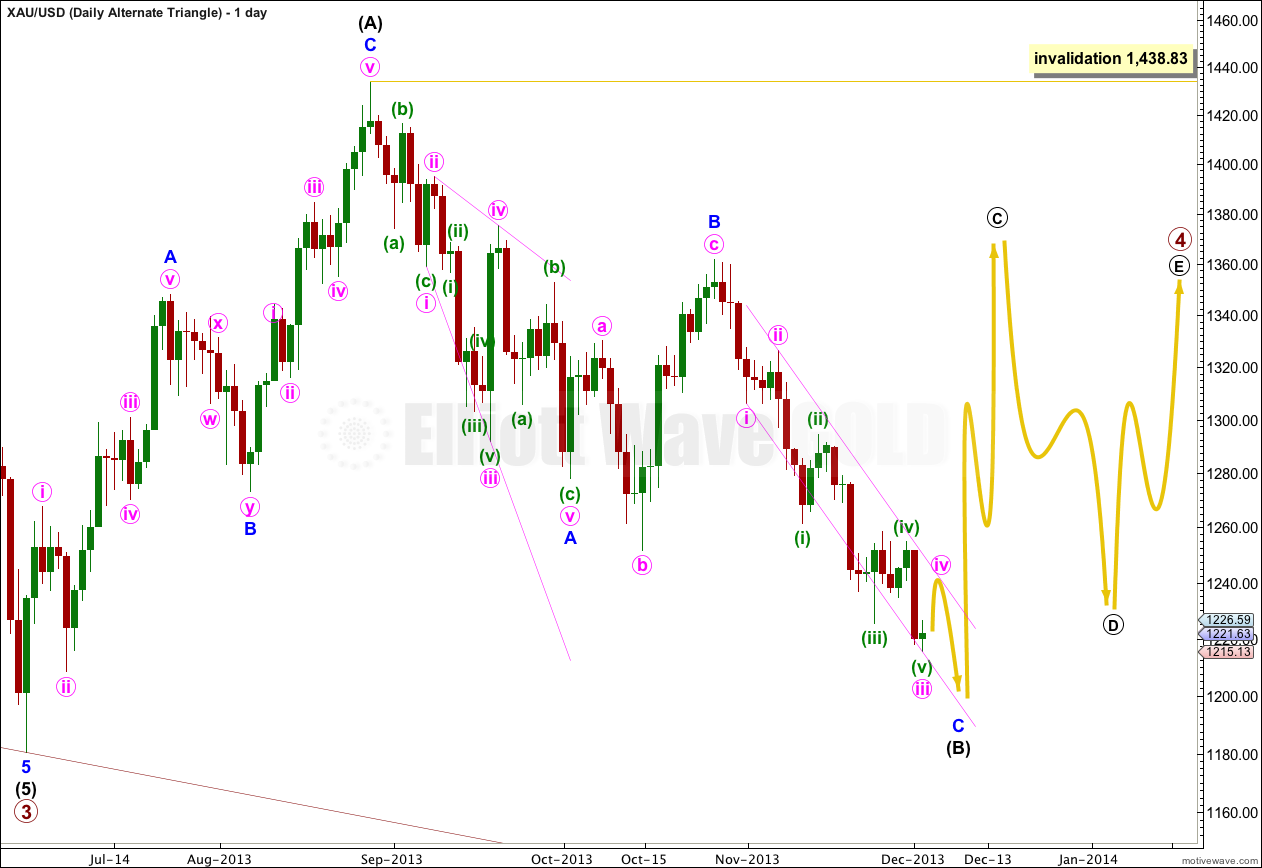
It is also possible that primary wave 4 may continue as a regular contracting (or barrier) triangle.
The expected direction and structure of this next upwards wave is the same, but for this alternate intermediate wave (C) of the triangle may not move beyond the end of intermediate wave (A). The triangle is invalidated with movement above 1,438.83.
The final intermediate wave (E) upwards may not move above the end of intermediate wave (C) for both a contracting and barrier triangle. E waves most commonly end short of the A-C trend line.
All five subwaves of a triangle must divide into corrective structures. If this next upwards movement subdivides as a zigzag which does not make a new high above 1,438.83 then this alternate would be correct.
Triangles take up time and move price sideways. If primary wave 4 unfolds as a triangle then I would expect it to last months rather than weeks.
Lara,do you still expect to see 1206 to 1198??? DEC.4TH AT 1:05 pm.
I think the market has answered your question for me.