
The main hourly wave count for last analysis had a higher probability than the alternate and expected more upwards movement. This is what happened, and price movement above 1,231.64 invalidated the alternate providing further confidence in the main wave count.
As more structure unfolds I will be able to calculate a better target for you. For now the target will remain the same.
Click on the charts below to enlarge.
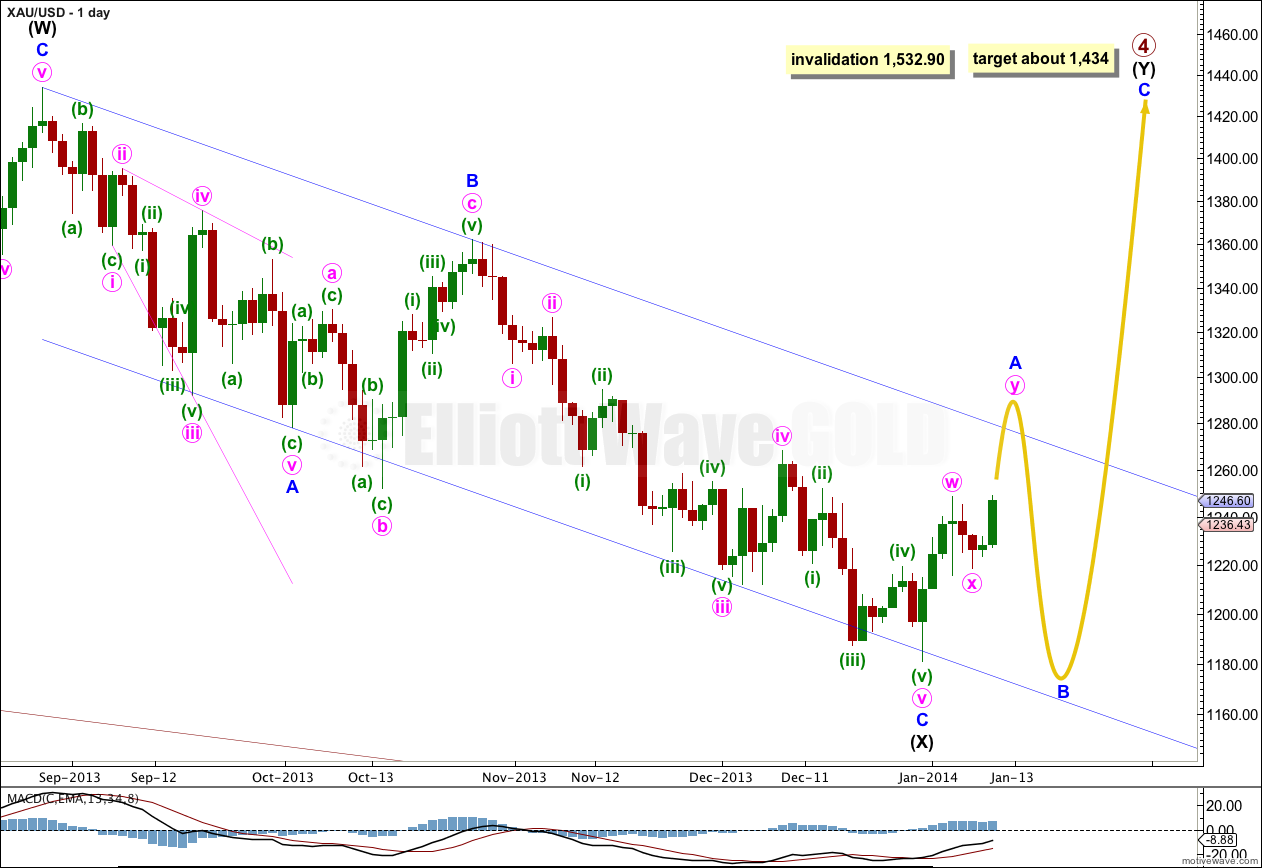
Gold is still within a large fourth wave correction at primary wave degree which is incomplete. To see a full explanation of my reasoning for expecting that primary wave 4 is not over and is continuing see this.
Movement above 1,277.97 would provide confirmation that primary wave 4 is not over. At that stage upwards movement could not be a fourth wave correction within primary wave 5 because it would be in its first wave price territory, and the downwards movement labeled intermediate wave (X) would be confirmed as a completed three wave structure.
When the channel about intermediate wave (X) is finally breached by upwards movement then I would consider that final confirmation that intermediate wave (Y) is underway.
Primary wave 2 was a rare running flat correction, and was a deep 68% correction of primary wave 1. In order to show alternation in structure primary wave 4 may be a zigzag, double zigzag, combination, triangle or even an expanded or regular flat. We can rule out a zigzag because the first wave subdivides as a three. This still leaves several structural possibilities.
The downwards wave labeled intermediate wave (X) is now 99% the length of the upwards wave labeled intermediate wave (W). Primary wave 4 is most likely to be a combination or triangle in order to show structural alternation with the running flat of primary wave 2.
Primary wave 4 is unlikely to be a flat correction because if it were it would be a regular flat. These have similar behaviour and a similar look to running flats, and so there would be little structural alternation between primary waves 2 and 4.
Primary wave 4 is most likely to be a combination rather than a double zigzag because of the depth of intermediate wave (X). Double combinations take up time and move price sideways, and their X waves can be very deep. Double zigzags are different because their purpose is to deepen a correction when the first zigzag does not move price deep enough, so their X waves are not normally very deep. Thus intermediate wave (Y) is most likely to be a flat correction, and less likely a triangle and least likely a zigzag. It is most likely to end about the same level as intermediate wave (W) at 1,434 so that the whole structure moves sideways. It may last about 43 to 89 days, depending upon what structure it takes.
If intermediate wave (Y) is a flat correction then within it minor wave B must retrace a minimum of 90% the length of minor wave A, and it may make a new low below 1,180.84.
If intermediate wave (Y) is a flat correction then within it minor wave A must subdivide as a three wave structure. At this stage it looks like minor wave A may be unfolding as a double zigzag, or possibly a very rare triple.
Primary wave 4 may not move into primary wave 1 price territory. This wave count is invalidated with movement above 1,532.90.
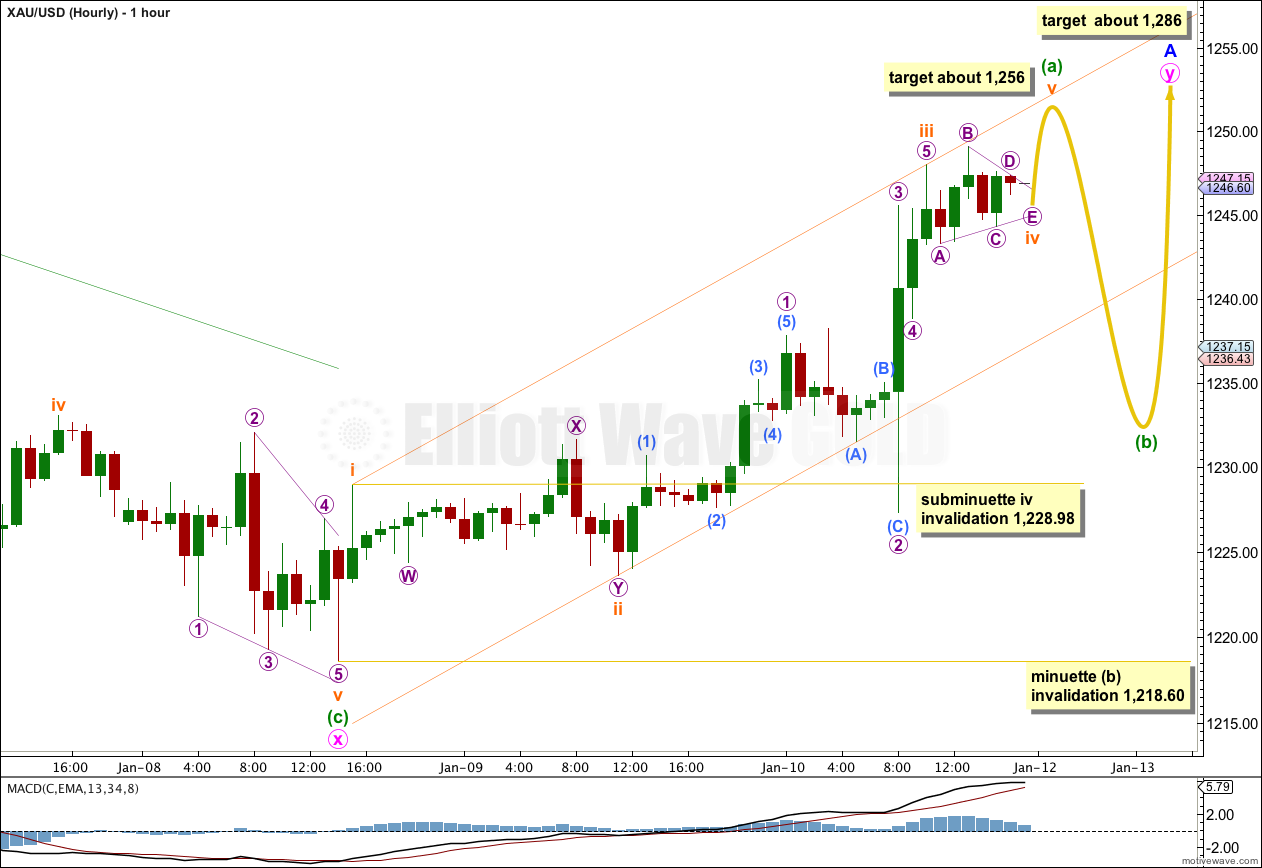
Movement above 1,231.64 invalidated yesterday’s alternate, providing confidence for this main wave count.
The slow overlapping movement upwards did not complete a leading diagonal, price moved into a third wave. Upwards momentum as indicated by MACD shows a clear increase. There is no Fibonacci ratio between subminuette waves i and iii, so it is more likely we shall see a Fibonacci ratio between subminuette wave v to either of i or iii. At 1,256 subminuette wave v would reach equality in length with subminuette wave i. (This target is a rough estimate at this stage because subminuette wave iv is incomplete – I don’t expect subminuette wave iv to move much lower).
Ratios within subminuette wave iii are: micro wave 3 has no Fibonacci ratio to micro wave 1, and micro wave 5 is 0.40 longer than 0.618 the length of micro wave 1.
I have checked the subdivisions within micro wave 3 carefully on a one minute chart. Although micro waves 2 and 4 are disproportionate, this is how it subdivides. I expect this means that subminuette wave iii within minuette wave (a) is over.
Subminuette wave iv may not move into subminuette wave i price territory. This wave count is invalidated in the short term (while subminuette wave iv is incomplete) with movement below 1,228.98.
Subminuette wave iv looks like it is unfolding as a running contracting triangle on the five minute chart. Within the triangle just the end of micro wave E downwards is required to complete, and it may not move beyond the end of micro wave C at 1,244.31.
When subminuette wave iv is completed then I would expect one more upwards thrust about 10.38 in length for subminuette wave v. This should exhibit a slowing of upwards momentum. I would expect this fifth wave to unfold during Monday.
When minuette wave (a) is a completed five wave impulse then minuette wave (b) should unfold downwards in a corrective three wave structure (or a triangle). Minuette wave (b) may not move beyond the end of minuette wave (a). This wave count is invalidated with movement below 1,218.60.
Draw a parallel channel about minuette wave (a) using Elliott’s first technique. Draw the first trend line from the highs labeled subminuette waves i to iii, then place a parallel copy upon the low of subminuette wave ii. I would expect subminuette wave iv to remain within this channel, and subminuette wave v to end about the upper edge. When the channel is clearly breached by downwards movement then I would expect that minuette wave (a) is over and minuette wave (b) downwards has begun.
If minute wave y is about equal in length with minute wave w then it may end about 1,286. However, please note, this is a rough target only and will be revised. Within double zigzags there is not usually a ratio between the two structures in the double, but sometimes they are about even in length. The best way to calculate a target is to use the lengths of minuette waves (a) and (c) within this second zigzag. When minuette wave (b) is completed then the target will change.
Alternate Daily Wave Count – Triangle.

It is also possible that primary wave 4 may continue as a regular contracting (or barrier) triangle.
The expected direction of this next upwards wave is the same, but for this alternate intermediate wave (C) of the triangle may not move beyond the end of intermediate wave (A). The triangle is invalidated with movement above 1,438.83.
Intermediate wave (C) must unfold as either a single or double zigzag. Within it no second wave correction, nor wave B of the zigzag, may move beyond the start of the first wave or A wave. This wave count is invalidated with movement below 1,180.84.
The final intermediate wave (E) upwards may not move above the end of intermediate wave (C) for both a contracting and barrier triangle. E waves most commonly end short of the A-C trend line.
All five subwaves of a triangle must divide into corrective structures. If this next upwards movement subdivides as a zigzag which does not make a new high above 1,438.83 then this alternate would be correct.
Triangles take up time and move price sideways. If primary wave 4 unfolds as a triangle then I would expect it to last months rather than weeks.