
Last analysis expected two more days of downwards movement towards a target at 1,155 to 1,159. We have seen one more day of downwards movement reaching only to 1,180.84.
I expect we have just seen an intermediate degree trend change one day earlier and $21.84 short of the target. I will use specific price points and trend channels to provide confirmation and confidence in this wave count.
Click on the charts below to enlarge.
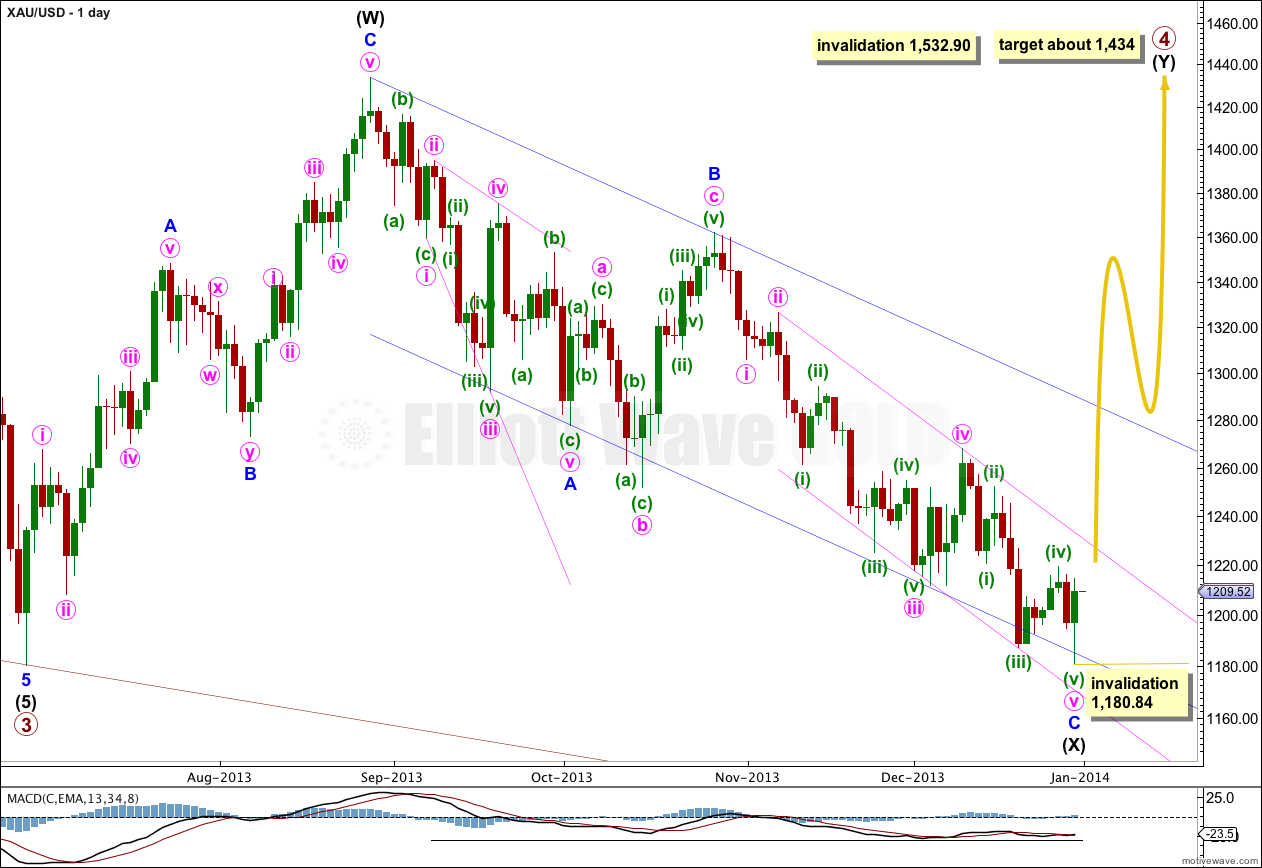
Gold is still within a large fourth wave correction at primary wave degree which is incomplete. To see a full explanation of my reasoning for expecting that primary wave 4 is not over and is continuing see this.
Primary wave 2 was a rare running flat correction, and was a deep 68% correction of primary wave 1. In order to show alternation in structure primary wave 4 may be a zigzag, double zigzag, combination, triangle or even an expanded or regular flat. We can rule out a zigzag because the first wave subdivides as a three. This still leaves several structural possibilities.
The downwards wave labeled intermediate wave (X) is now 99% the length of the upwards wave labeled intermediate wave (W). Primary wave 4 is most likely to be a combination or triangle in order to show structural alternation with the running flat of primary wave 2.
Primary wave 4 is less likely to be a flat correction because if it were it would be a regular flat. These have similar behaviour and a similar look to running flats, and so there would be little structural alternation between primary waves 2 and 4.
Draw a parallel channel about minor wave C downwards (pink channel) with the first trend line from the highs labeled minute waves ii to iv, then place a parallel copy upon the low labeled minute wave iii. When this channel is clearly breached by upwards movement then we shall have trend channel confirmation that minor wave C is complete and the next wave is underway.
When the channel about intermediate wave (X) is finally breached by upwards movement then I would consider that final confirmation that intermediate wave (Y) is underway.
Primary wave 4 is most likely to be a combination rather than a double zigzag because of the depth of intermediate wave (X). Double combinations take up time and move price sideways, and their X waves can be very deep. Double zigzags are different because their purpose is to deepen a correction when the first zigzag does not move price deep enough. Thus intermediate wave (Y) is most likely to be a flat correction, and less likely a triangle and least likely a zigzag. It is most likely to end about the same level as intermediate wave (W) at 1,434 so that the whole structure moves sideways. It may last about 43 to 89 days, depending upon what structure it takes.
Primary wave 4 may not move into primary wave 1 price territory. This wave count is invalidated with movement above 1,532.90.
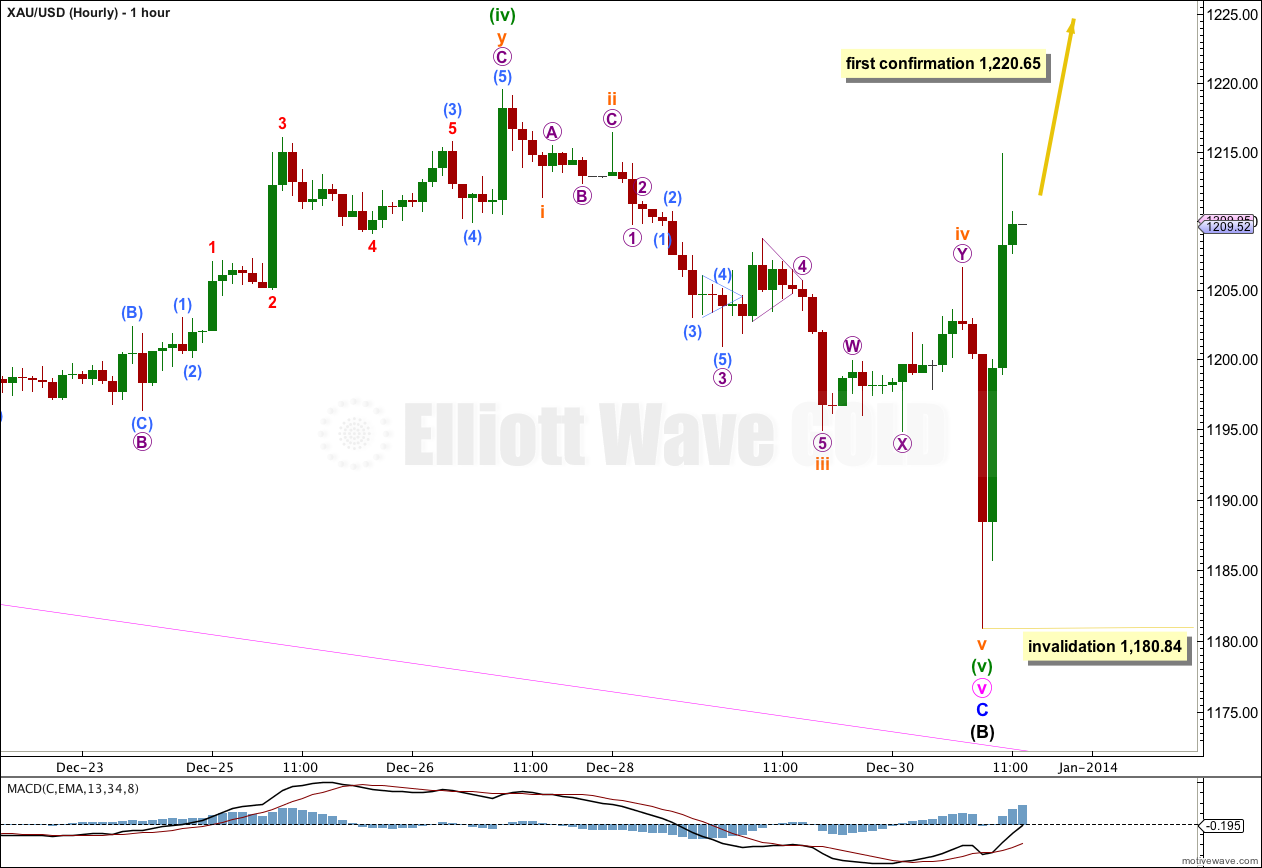
Because the candlestick for 31st December has completed as a large green candlestick on a daily chart, I expect it is most likely that minuette wave (v) is now completed. I would not expect to see a large green candlestick in the middle of a minuette wave downwards. Also, because we have seen a new low beyond the end of minuette wave (iii), a truncation has been avoided. The structure is now complete at all wave degrees.
Ratios within minor wave C are: minute wave iii has no Fibonacci ratio to minute wave i, and minute wave v is 3.08 short of 1.618 the length of minute wave i.
Ratios within minute wave v are: there is no Fibonacci ratio between minuette waves (i) and (iii), and minuette wave (v) is just 1.37 short of 0.618 the length of minuette wave (iii).
At this stage it is most likely we have just seen a trend change at intermediate wave degree, but this trend change is unconfirmed. Price movement above 1,220.65 would be strong confirmation. At that stage this recent movement could not be a continuation of minuette wave (iv) because it may not move into minuette wave (i) price territory.
Movement above the pink parallel channel on the daily chart would provide further confidence in this trend change.
Movement above the larger blue channel on the daily chart would provide full and final confidence in this trend change.
So far upwards movement on the five minute chart from the low at 1,180.84 is an incomplete five wave impulse. It should be complete within a few hours. This should be followed by a second wave correction. Second wave corrections can be, and often are, very deep. It may not move beyond the start of the first wave. This wave count is invalidated with movement below 1,180.84.
Alternate Hourly Wave Count.
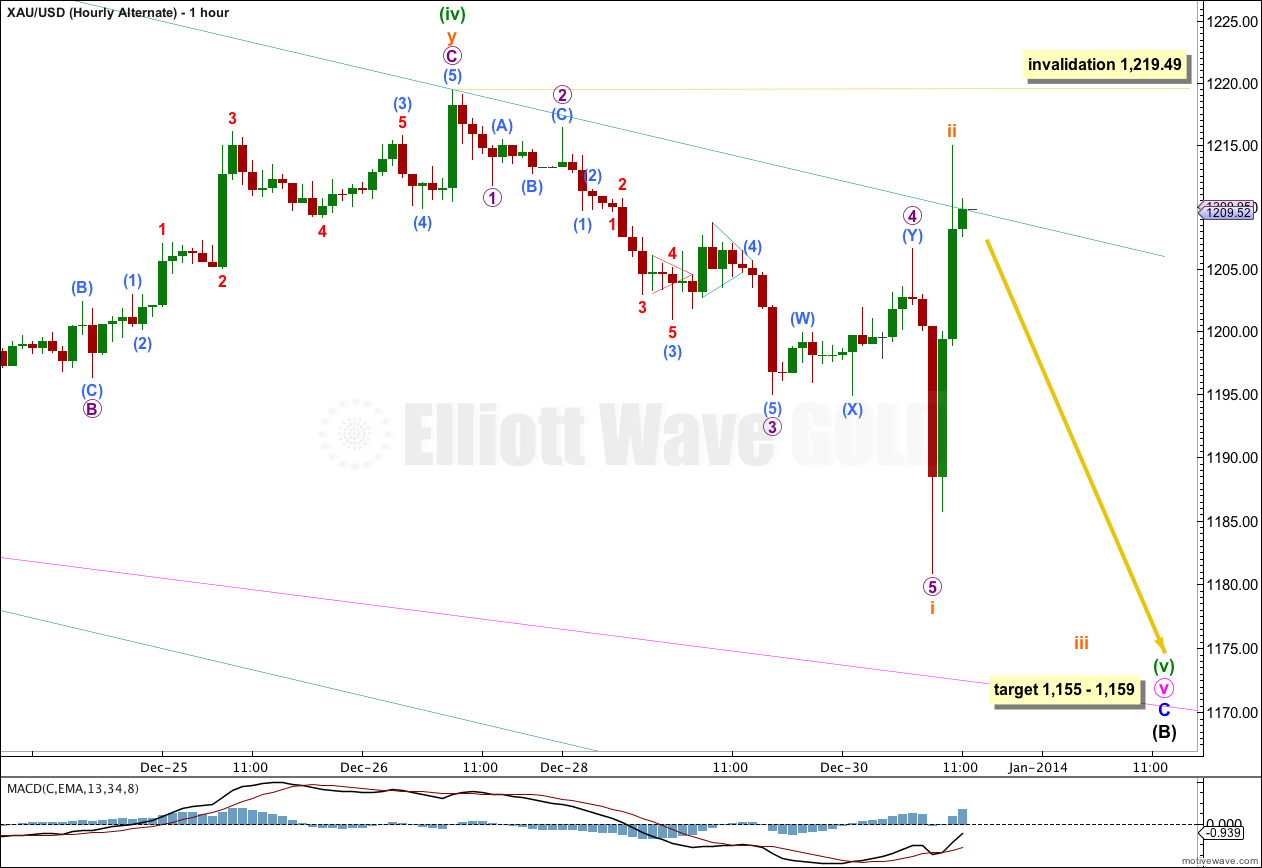
By simply moving the degree of labeling within minuette wave (v) all down one degree, only subminuette wave i and nearly ii may be complete.
Subminuette wave ii may not move beyond the start of subminuette wave i. This wave count is invalidated with movement above 1,219.49.
At 1,159 minute wave v would reach equality in length with minute wave iii. At 1,155 minuette wave (v) would reach equality in length with minuette wave (iii).
This wave count has a low probability because of the large green candlestick on the daily chart of 31st December, 2013. At the daily chart level this wave count does not have the right look. However, it must be considered as it is viable. Sometimes low probability outcomes do occur.
Alternate Daily Wave Count – Triangle.
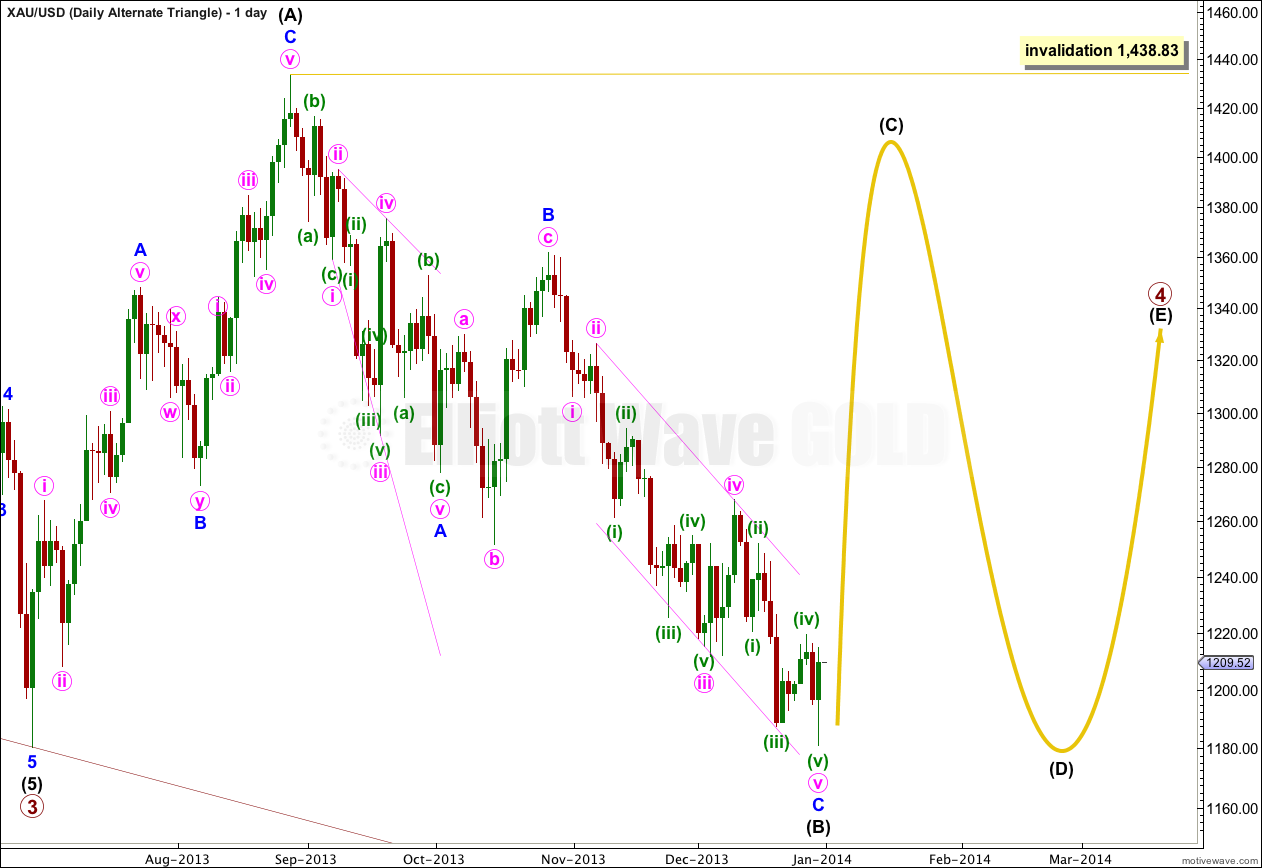
It is also possible that primary wave 4 may continue as a regular contracting (or barrier) triangle.
The expected direction of this next upwards wave is the same, but for this alternate intermediate wave (C) of the triangle may not move beyond the end of intermediate wave (A). Intermediate wave (C) must subdivide as a zigzag or double zigzag. The triangle is invalidated with movement above 1,438.83.
The final intermediate wave (E) upwards may not move above the end of intermediate wave (C) for both a contracting and barrier triangle. E waves most commonly end short of the A-C trend line.
All five subwaves of a triangle must divide into corrective structures. If this next upwards movement subdivides as a zigzag which does not make a new high above 1,438.83 then this alternate would be correct.
Triangles take up time and move price sideways. If primary wave 4 unfolds as a triangle then I would expect it to last months rather than weeks.
Lara, does confirmation above 1220.65 occur before or after second wave correction?
“Price movement above 1,220.65 would be strong confirmation”
“So far upwards movement on the five minute chart from the low at 1,180.84 is an incomplete five wave impulse. It should be complete within a few hours. This should be followed by a second wave correction. Second wave corrections can be, and often are, very deep. It may not move beyond the start of the first wave. This wave count is invalidated with movement below 1,180.84.”
It occurred before.
But it could also have occurred after. It depended on how long the first wave was.
Wow, an awesome analysis Lara, a true joy to read. You provide incredible details. What a coincidence that it looks like we have in fact hit bottom in Gold on the final day of the year down nearly 30% for its worst performance in 32 years and the first down year since 2003. An incredible contrarian purchase to fulfil the Buy Low, Sell High rule that makes one Richer!!!
I will be watching very closely January 2nd and 3rd for confirmations in Gold and with lots of money on the table to buy my preferred choice of precious metals mining ETF for added leverage. After months of waiting for a solid rally to trade it is something to celebrate and such great timing it being New Years Eve. Time for the champagne to celebrate Gold, Lara, and upcoming huge profits by the time we hit the $1,433 Gold area. I thank the powers to be for Elliott Wave Gold and also for having the wisdom and patience to remain calm and not buy and just wait for the clear Buy signal provided by Gold Guru Lara. Tonight I toast to Lara!
I think I may have toasted enough champagne for many of us last night… and watched fabulous fireworks.
I do want to see price move above 1,220.65 before I toast to a trend change though.
Thank you for your kind comments!