
Upwards movement continued to reach 1,329.95, just 5 cents below the target at 1,330. I have two hourly wave counts for you today.
This analysis is published about 03:35 p.m. EST.
The wave count remains the same.
Summary: It is likely that upwards movement is over in the mid term. I want to see a clear channel breach of the green channel on the hourly alternate chart to have confidence in a possible trend change. While price remains within that channel there is a possibility of more upwards movement.
Click on the charts below to enlarge.
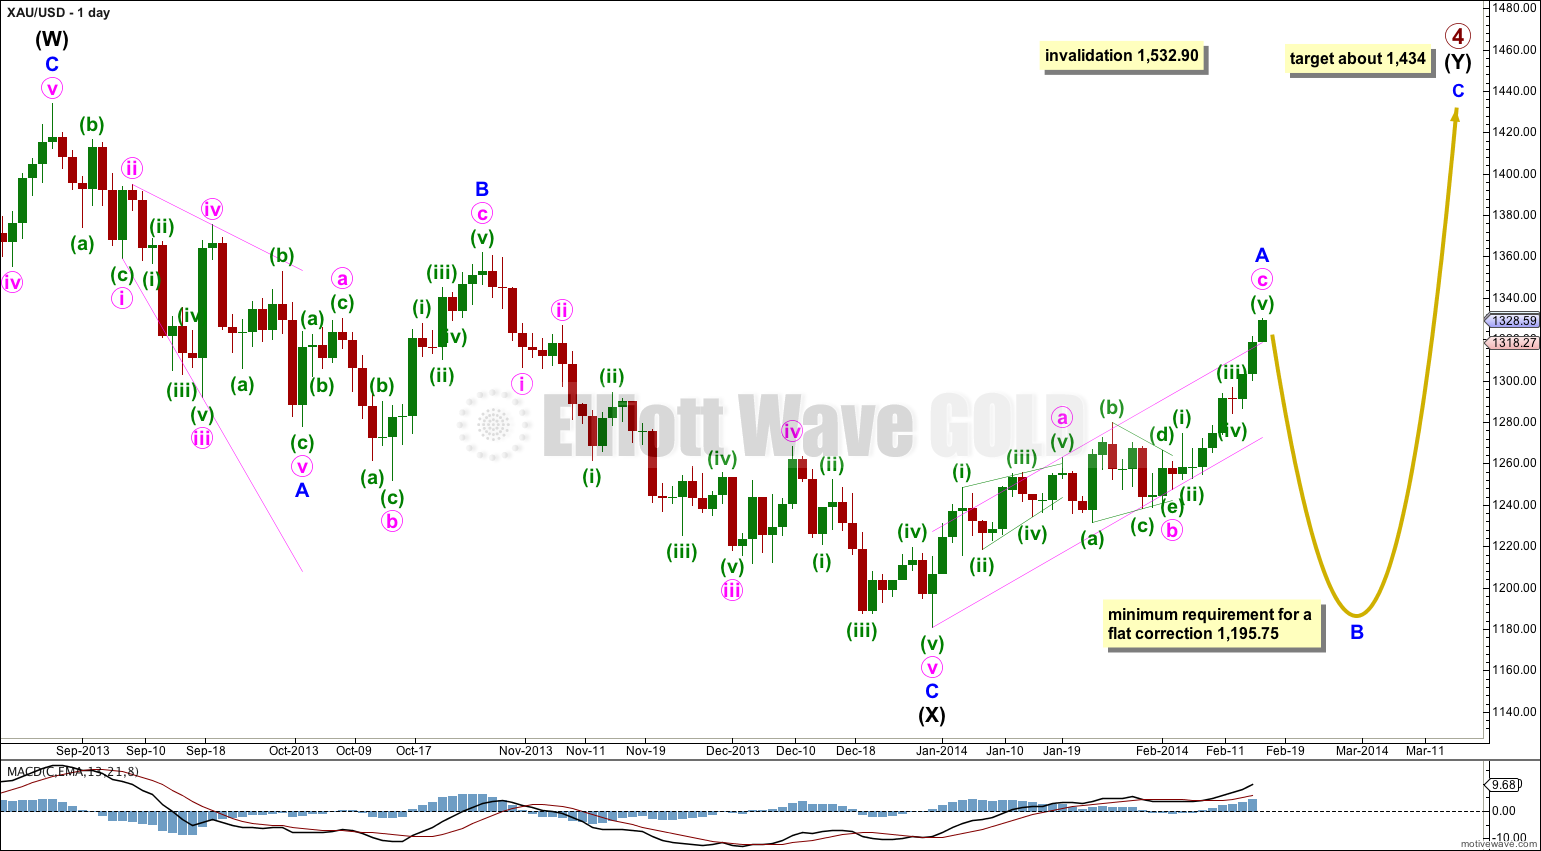
Gold is still within a large fourth wave correction at primary wave degree which is incomplete.
To determine what structure the current upwards movement is most likely to take it is necessary to determine what structure primary wave 4 is most likely to take.
Primary wave 2 was a rare running flat. Primary wave 4 is unlikely to be a flat correction because it is likely to show structural alternation with primary wave 2.
The first upwards wave within primary wave 4 labeled here intermediate wave (W) subdivides as a three wave zigzag. Primary wave 4 cannot be an unfolding zigzag because the first wave within a zigzag, wave A, must subdivide as a five.
Primary wave 4 is unlikely to be completing as a double zigzag because intermediate wave (X) is a deep 99% correction of intermediate wave (W). Double zigzags commonly have shallow X waves because their purpose it to deepen a correction when the first zigzag does not move price deep enough.
Primary wave 4 is most likely to be completing as a double combination: zigzag – X – second structure. The second structure labeled intermediate wave (Y) may be either a flat or a triangle. For both these structures minor wave A must be a three, and is most likely to be a zigzag.
Minor wave A is either a complete zigzag or it is very close to completion.
Minor wave B downwards must retrace a minimum of 90% the length of minor wave A at 1,195.75 if intermediate wave (Y) is a flat correction. If intermediate wave (Y) is a triangle then there is no minimum requirement for minor wave B within it.
Minor wave B must subdivide as a corrective structure, and there are more than thirteen possible corrective structures it may take. Within it minute wave a may be either a three or a five, and when it is complete and its structure is clear then we shall have a clearer idea of what structure minor wave B may be.
Primary wave 4 may not move into primary wave 1 price territory. This wave count is invalidated with movement above 1,532.90.
Draw a channel about the zigzag of minor wave A: draw the first trend line from the start of minute wave a to the end of minute wave b, then place a parallel copy upon the end of minute wave a. Sometimes C waves overshoot these channels and that looks like what may happen here. A clear channel breach of this channel with a full daily candlestick below the lower edge and not touching the lower trend line would provide trend channel confirmation of a trend change at minor degree.
Main Hourly Wave Count.
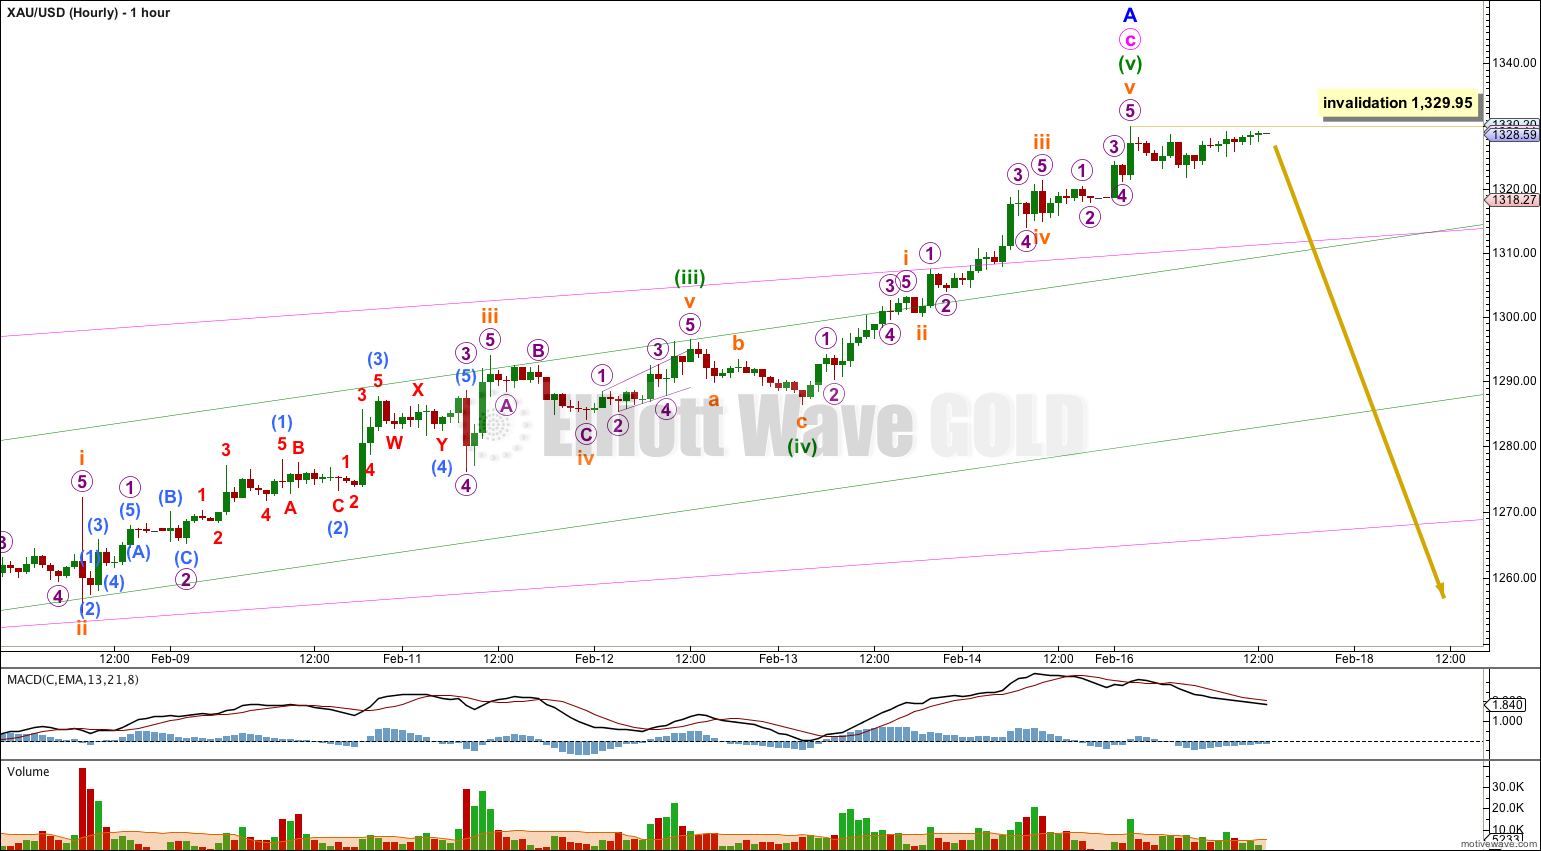
I had expected upwards movement for Monday towards the target, and so far this is exactly what happened. The target is almost met.
Within minute wave c the five wave impulse structure looks best if it is complete.
Ratios within minute wave c are: minuette wave (iii) is 0.42 short of 1.618 the length of minuette wave (i), and minuette wave (v) is just 0.10 longer than equality with minuette wave (i). These are excellent ratios.
Within minute wave c the strongest upwards momentum is within the fifth wave, and the fifth wave overshoots both the channels containing minute wave c and minor wave A. Sometimes commodities exhibit this strong fifth wave behaviour; an overshoot of the channel is accompanied by stronger momentum. Volume within the fifth wave was not stronger, which supports the idea of a fifth wave overshoot.
However, because of the stronger momentum in this last upwards push I have considered the alternate below. If price moves above 1,329.95 then I would use the alternate below.
Alternate Hourly Wave Count.
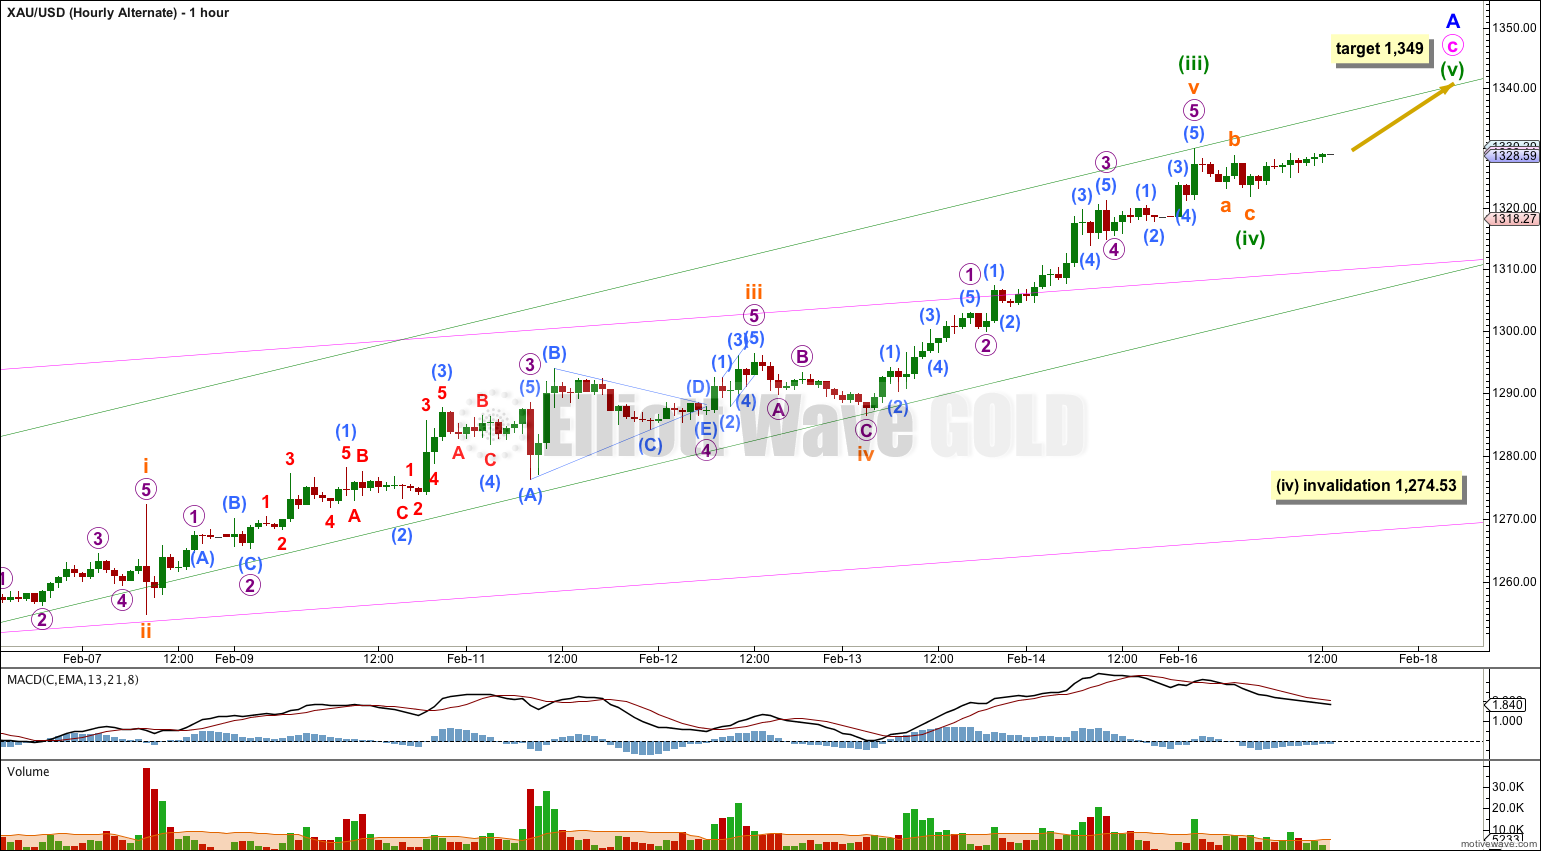
I have looked to see if the strongest momentum within minute wave c may correspond to the end of the third wave within it. In trying to see if this is possible I have left the labeling of minuette waves (i) and (ii) the same, and also subminuette waves i and ii within minuette wave (iii) the same as the main hourly wave count above. Thereafter, this alternate differs from the main wave count.
If minuette wave (iii) has just ended with a typical increase in momentum then it is $6 short of 2.618 the length of minuette wave (i). This is an acceptable ratio, the variation is 7.9% the length of minuette wave (iii) and I consider anything less than 10% to be acceptable. However, it is not as close a ratio as the main wave count.
If minuette wave (iv) is over as a single zigzag at 1,321.90 then at 1,349 minuette wave (v) would reach equality in length with minuette wave (iii). Minute wave c would have no Fibonacci ratio to minute wave a at the target.
If minuette wave (iv) continues (and it certainly may do so) then I would expect it to find support at the lower edge of the green parallel channel which is drawn about minute wave c using Elliott’s technique.
If this green channel is very clearly breached then I would have confidence in the main hourly wave count and I would discard this alternate. This alternate would only be fully invalidated with price movement below 1,274.53 because minuette wave (iv) may not move into minuette wave (i) price territory.
Alternate Daily Wave Count – Triangle.
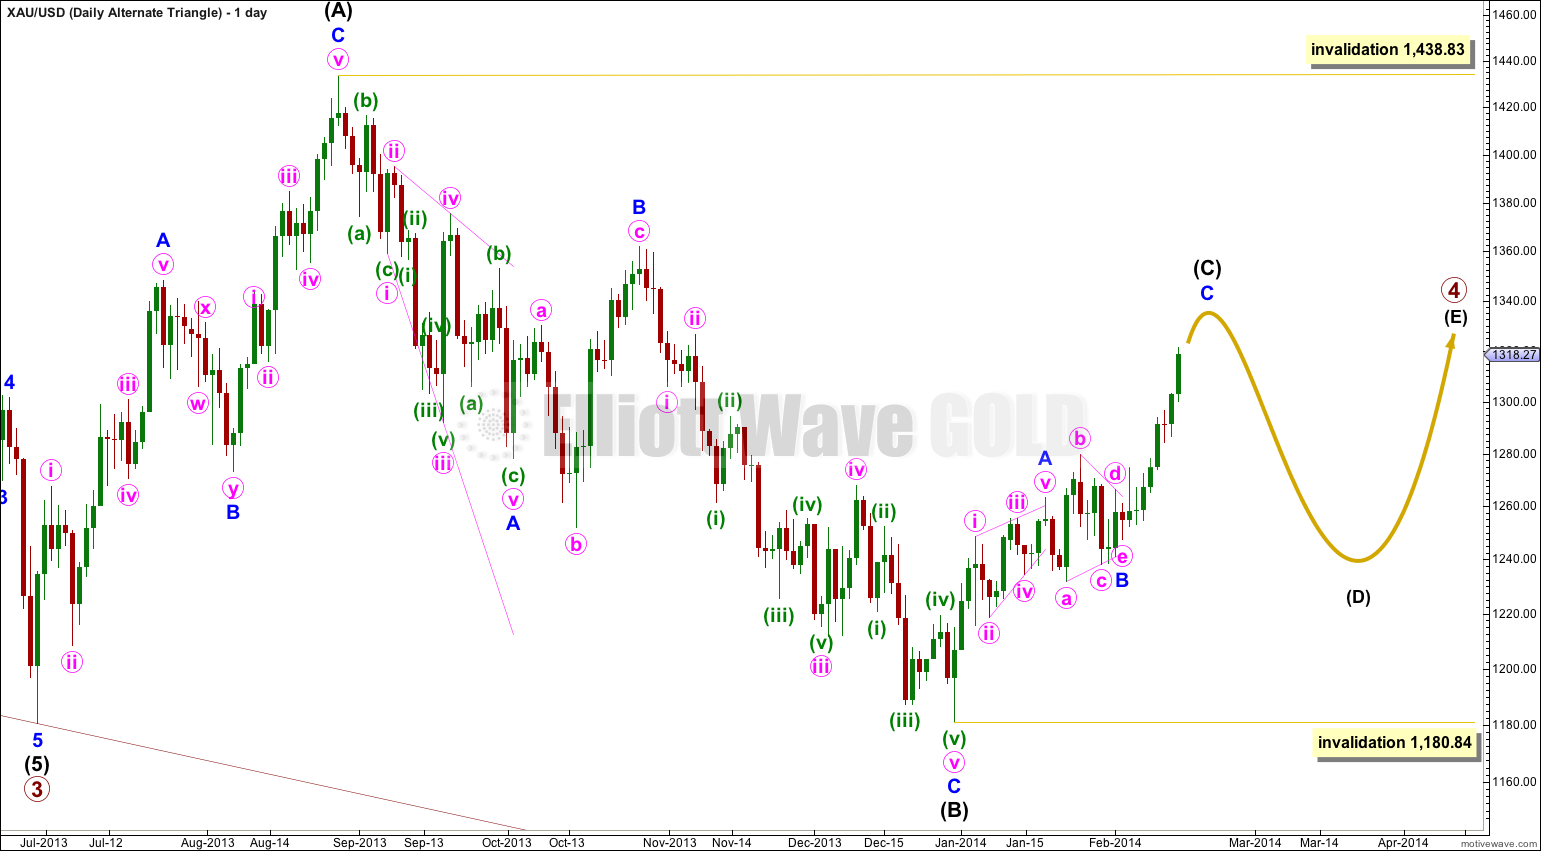
It is also possible that primary wave 4 may continue as a regular contracting (or barrier) triangle.
The expected direction of this next upwards wave is the same, but for this alternate intermediate wave (C) of the triangle may not move beyond the end of intermediate wave (A). The triangle is invalidated with movement above 1,438.83.
Intermediate wave (C) must unfold as either a single or double zigzag. Within it no second wave correction, nor wave B of the zigzag, may move beyond the start of the first wave or A wave. This wave count is invalidated with movement below 1,180.84.
The final intermediate wave (E) upwards may not move above the end of intermediate wave (C) for both a contracting and barrier triangle. E waves most commonly end short of the A-C trend line.
All five subwaves of a triangle must divide into corrective structures. If this next upwards movement subdivides as a zigzag which does not make a new high above 1,438.83 then this alternate would be correct.
Triangles take up time and move price sideways. If primary wave 4 unfolds as a triangle then I would expect it to last months rather than weeks.