
Price has moved a little lower. Thereafter, it has turned up a little remaining well below the invalidation point. The green candlestick on the daily chart for Thursday’s session does not alter the wave count at all. It remains the same.
This analysis is published about 02:30 p.m. EST.
Summary: I still expect that there has been a trend change at 1,332.28. At this stage a second wave correction is completing. When it is done price should resume the downwards trend. This should happen within the next 24 hours so that Friday’s candlestick is red.
Click on the charts below to enlarge.
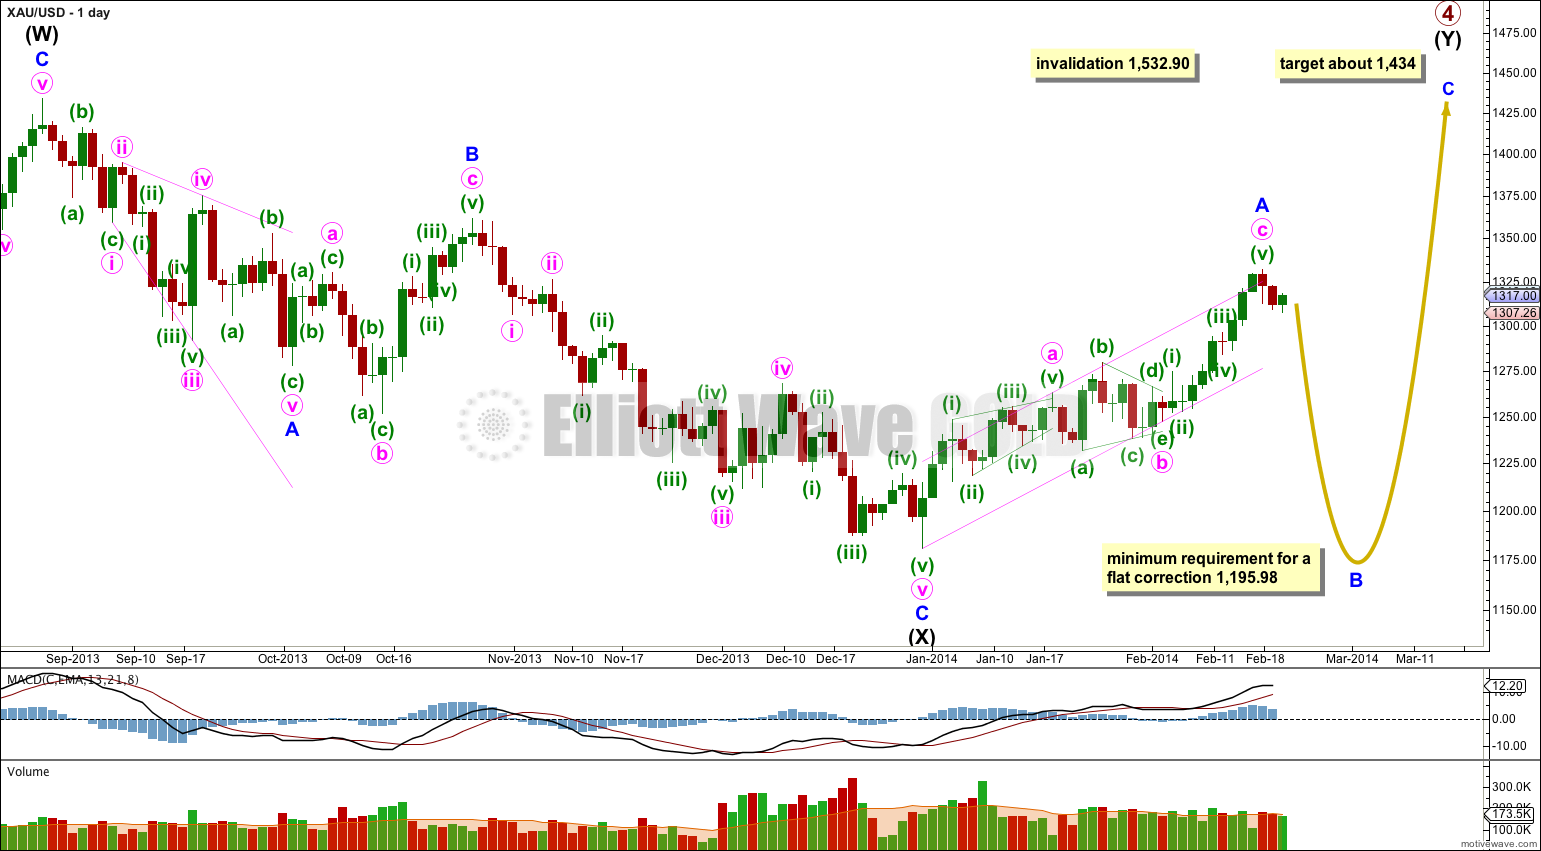
Gold is still within a large fourth wave correction at primary wave degree which is incomplete.
Primary wave 2 was a rare running flat. Primary wave 4 is unlikely to be a flat correction because it is likely to show structural alternation with primary wave 2.
The first upwards wave within primary wave 4 labeled here intermediate wave (W) subdivides as a three wave zigzag. Primary wave 4 cannot be an unfolding zigzag because the first wave within a zigzag, wave A, must subdivide as a five.
Primary wave 4 is unlikely to be completing as a double zigzag because intermediate wave (X) is a deep 99% correction of intermediate wave (W). Double zigzags commonly have shallow X waves because their purpose it to deepen a correction when the first zigzag does not move price deep enough.
Primary wave 4 is most likely to be completing as a double combination: zigzag – X – second structure. The second structure labeled intermediate wave (Y) may be either a flat or a triangle. For both these structures minor wave A must be a three, and is most likely to be a zigzag.
Minor wave A is a complete zigzag.
Minor wave B downwards must retrace a minimum of 90% the length of minor wave A at 1,195.98 if intermediate wave (Y) is a flat correction. If intermediate wave (Y) is a triangle then there is no minimum requirement for minor wave B within it.
Minor wave B must subdivide as a corrective structure, and there are more than thirteen possible corrective structures it may take. Within it minute wave a may be either a three or a five, and when it is complete and its structure is clear then we shall have a clearer idea of what structure minor wave B may be. In another couple of days or so I will publish alternate hourly wave counts to consider all the different possible structures for minute wave a. For now I am waiting to see the first 5-3-5 down complete.
Primary wave 4 may not move into primary wave 1 price territory. This wave count is invalidated with movement above 1,532.90.
Draw a channel about the zigzag of minor wave A: draw the first trend line from the start of minute wave a to the end of minute wave b, then place a parallel copy upon the end of minute wave a. A clear channel breach of this channel with a full daily candlestick below the lower edge and not touching the lower trend line would provide trend channel confirmation of a trend change at minor degree.
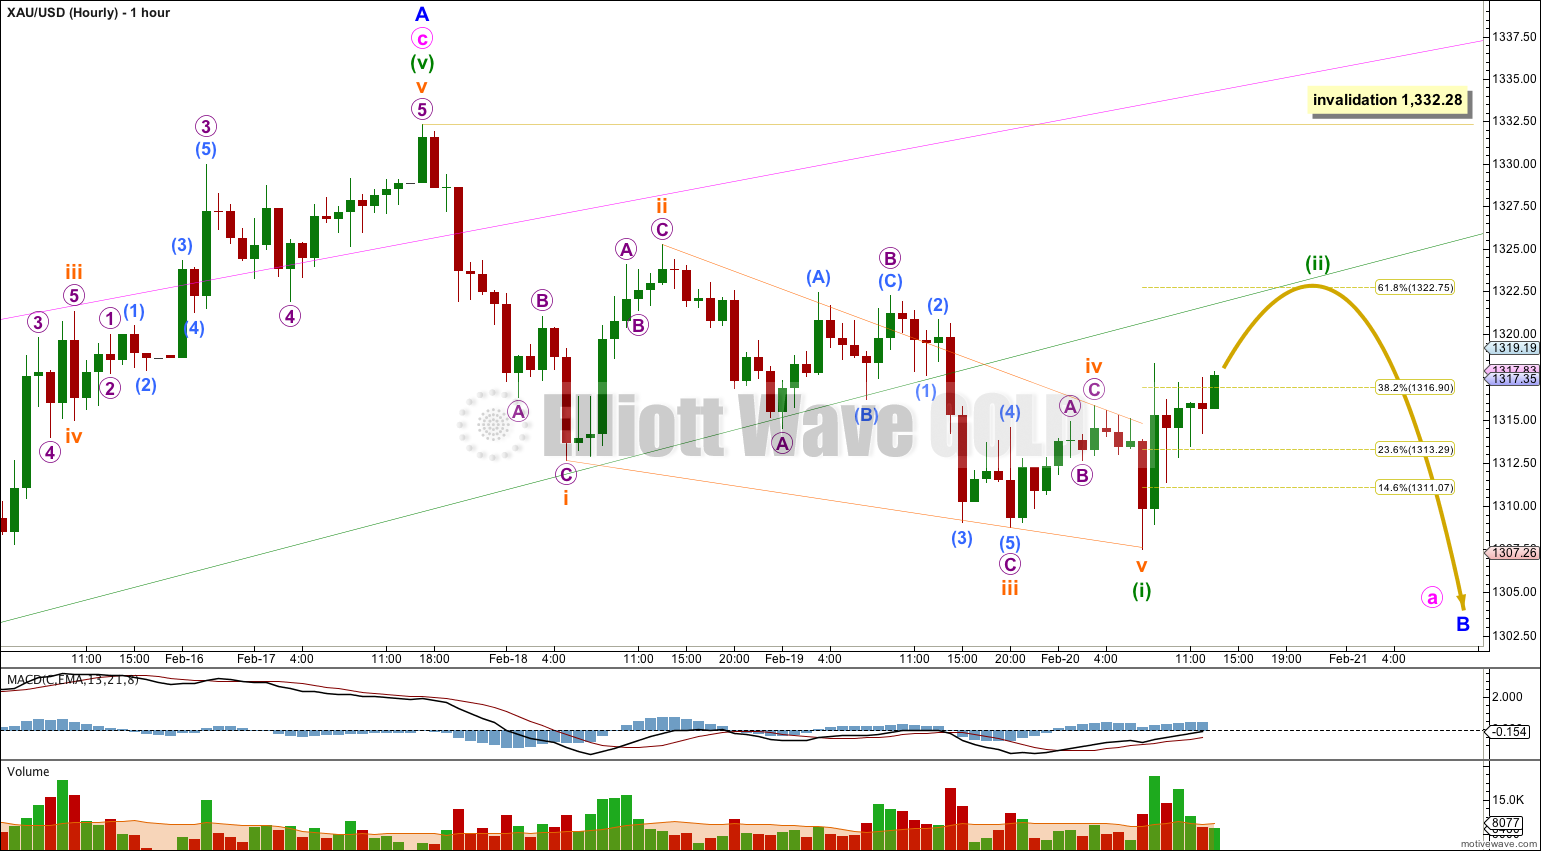
Draw a channel about minute wave c (squish the hourly chart up to do this). Draw the first trend line from the highs of minuette waves (i) to (iii), then place a parallel copy upon the low of minuette wave (ii) (you can see these points on the daily chart). Expand the chart again and watch for price to find support and resistance about these green trend lines, and also the pink trend lines copied over from the daily chart.
So far there is now a complete five wave structure downwards. Minuette wave (i) (or minuette wave (a) if a zigzag is unfolding) subdivides as a leading contracting diagonal.
Within leading diagonals the second and fourth waves must subdivide as zigzags. The first, third and fifth waves are most commonly zigzags. They may also be impulses. In this instance they are all zigzags. Diagonals are the only structures where you will see a third wave labeled as anything other than an impulse.
On the way down price found support at the upper green trend line. I expect this trend line may provide resistance to upwards movement and this may be where minuette wave (ii) ends. I would expect minuette wave (ii) to most likely end about the 0.618 Fibonacci ratio of minuette wave (i) at 1,322.75.
When minuette wave (ii) is complete then another five wave structure downwards should follow it. This may be minuette wave (iii) or minute wave (c) down. When the next five wave structure downwards is complete at that stage I will begin to publish alternate wave counts for the various structural possibilities of minute wave a.
Minuette wave (ii) may not move beyond the start of minuette wave (i). This wave count is invalidated with movement above 1,332.28.
Alternate Daily Wave Count – Triangle.
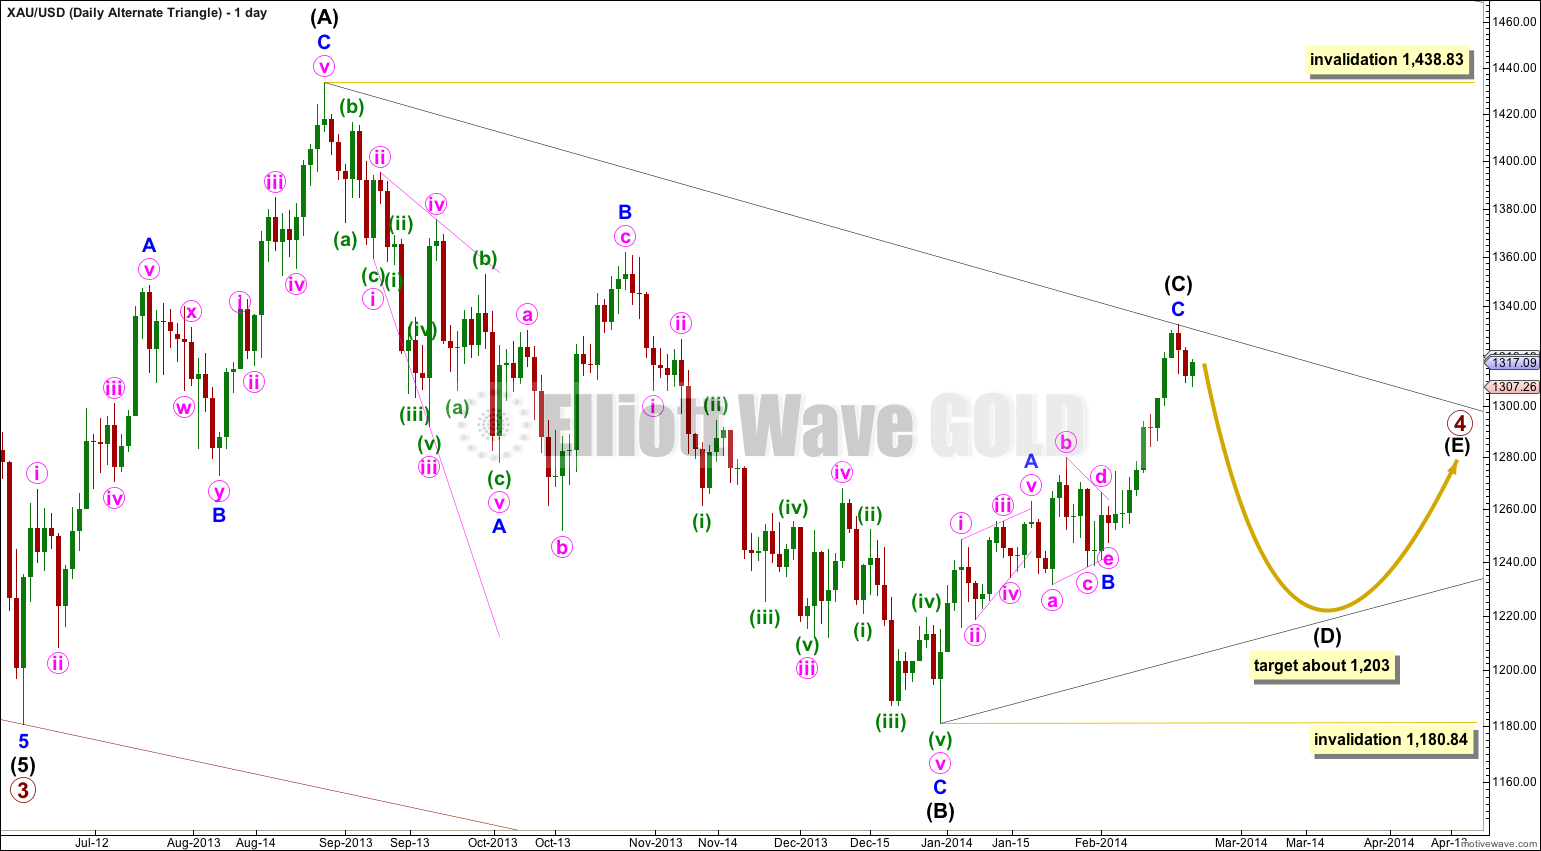
It is also possible that primary wave 4 may continue as a regular contracting (or barrier) triangle.
However, at this stage this triangle scenario looks less likely. It is my experience that the subwaves of contracting triangles are often about 80% to 85% the length of the prior subwave. In this case intermediate wave (C) is only 60% of intermediate wave (B). It looks too short, giving this possible triangle a slightly unusual look overall.
I will keep this possibility charted for you, but at this stage I judge it to have a decreased probability.
Triangles take up time and move price sideways. If primary wave 4 unfolds as a triangle then I would expect it to last months rather than weeks.
Hi Lara
Is gold still in correction as long as upper trend line unbreached at 1332?
Thx
Yes.
I’ve lost my FXCM data feed for Saturday. Gold will be published tomorrow.
Hi, Lara,
Since 9th Jan, the NZDUSD runs long time to retrace back,it was supposed that NZD was running at minor 3 minute ii, is NZD still running in minor 2, or it already completed as what you have told on 9th Jan. Is NZD running in minor 3 -minute wave ii; Or the pattern is changed, minor 2 has extended a Z wave and just have completed, it is just starting the minor 3 minute i now. Is this the Gold weaker will helps the NZD turning to the down side. I bet quite a bit on NZD, is it safe and what invalidation point you would suggested. Many thanks for you, really really by my heart, I learnt Elliott wave 20 years ago in a Chinese version book, I felt Elliott wave has something meaningful things inside but cannot master the techinque as you so sometimes it works sometimes not, but now I take your Gold subscribes, it perfectly right and I feel I could master the marginal investment in spot Gold which was I had no that kind of feeling for over 20 years. Once again, many thanks to you! Blessed you!
Silvero
I’ve lost my data connection with FXCM. They often do this on Saturday. I should have it tomorrow and I’ll publish my NZDUSD charts when I publish Gold.
We trade NZDUSD a bit. I don’t think it’s safe. It’s pretty volatile actually, and the wave count is very difficult.
I see, Thanks for your reply, Lara!
I supposed NZD its recent wave main trend is running downward during the coming months, the currencies cycle seems coherent with the economical cycle of the various countries in the world