
The main wave count expected upwards movement which is what we have seen.
The wave count remains the same.
Summary: I expect that we have seen a trend change back to the upside. Movement above 1.353.07 would confirm this. The mid term target is at 1,390 for upwards movement to end.
This analysis is published about 04:15 p.m. EST. Click on charts to enlarge.
Main Wave Count.
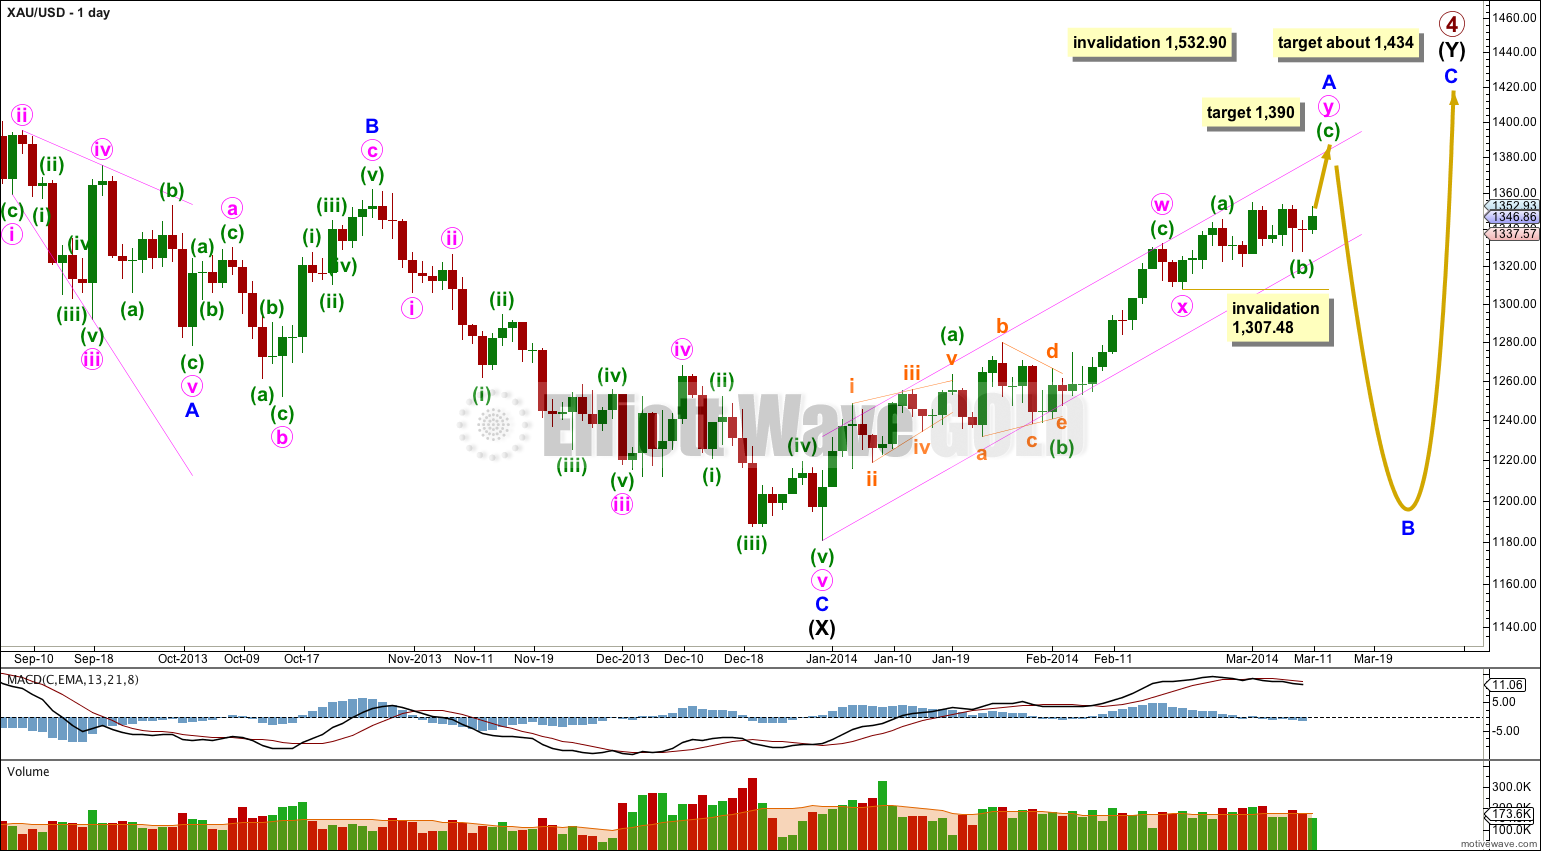
Gold is still within a large fourth wave correction at primary wave degree which is incomplete.
Primary wave 2 was a rare running flat. Primary wave 4 is unlikely to be a flat correction because it is likely to show structural alternation with primary wave 2.
The first upwards wave within primary wave 4 labeled intermediate wave (W) subdivides as a three wave zigzag. Primary wave 4 cannot be an unfolding zigzag because the first wave within a zigzag, wave A, must subdivide as a five.
Primary wave 4 is unlikely to be completing as a double zigzag because intermediate wave (X) is a deep 99% correction of intermediate wave (W). Double zigzags commonly have shallow X waves because their purpose it to deepen a correction when the first zigzag does not move price deep enough.
Primary wave 4 is most likely to be completing as a double combination: zigzag – X – second structure. The second structure labeled intermediate wave (Y) may be either a flat or a triangle. For both these structures minor wave A must be a three.
Minor wave A is an incomplete double zigzag. The second zigzag in the double is incomplete. At this stage there is a morning doji star candlestick pattern forming at the bottom of minuette wave (b) within minute wave y. If this pattern holds while the current daily candlestick closes we shall have more confirmation of a trend change at 1,328.18. A morning star pattern is one of the more reliable candlestick patterns.
Primary wave 4 may not move into primary wave 1 price territory. This wave count is invalidated with movement above 1,532.90.
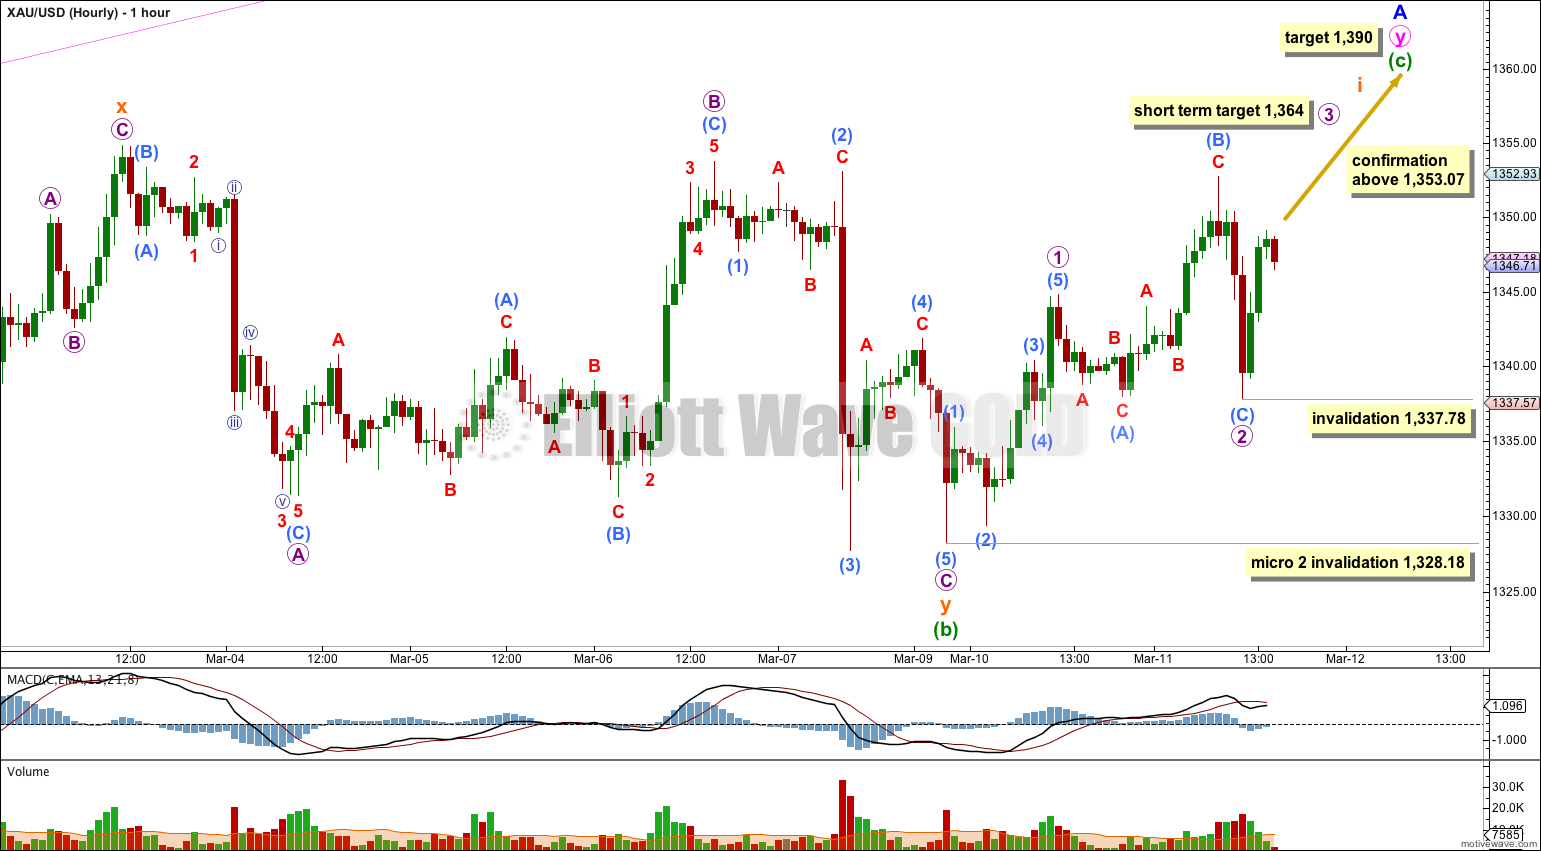
Minuette wave (b) subdivides as a complete double combination: zigzag – X – regular flat.
Movement above 1,353.07 would confirm this trend change. While price remains below this point the alternate wave count will remain valid.
Within the new upwards trend micro waves 1 and 2 are complete. At 1,364 micro wave 3 would reach 1.618 the length of micro wave 1. This short term target may be met within the next 24 hours.
At 1,390 minuette wave (c) would reach 1.618 the length of minuette wave (a). This is the ratio I am using to calculate the target because minuette wave (a) was very short, and it would see the ratios of A and C waves within the two zigzags of the double show alternation. This target may be met in about one to two weeks.
Within micro wave 3 no second wave correction may move beyond its start. Micro wave 3 is invalidated with movement below 1,337.78.
If price moves below 1,337.78 it may be that micro wave 2 is continuing further sideways. Micro wave 2 may not move beyond the start of micro wave 1. This wave count is fully invalidated with movement below 1,328.18.
Alternate Wave Count.
If minor wave A is complete then minor wave B has begun. This wave count now diverges with the expectation for Silver significantly enough to reduce its probability, while the main wave count is in line with my expectations for Silver.
This wave count requires a clear breach of the pink channel about minor wave A for confirmation.
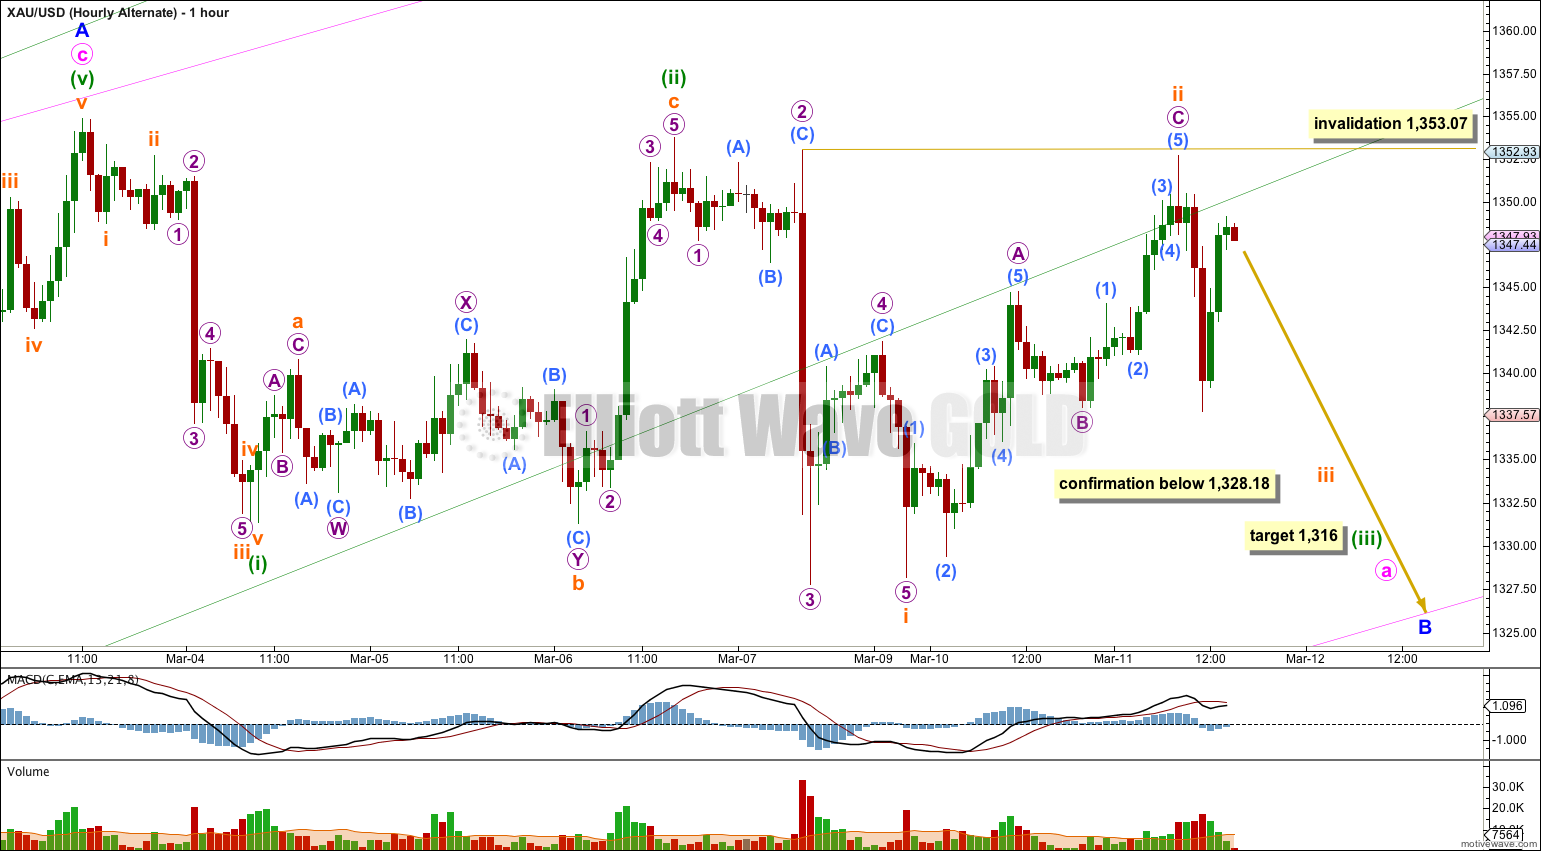
This wave count sees minuette wave (iii) over at 1,343.35 and minor wave A may be complete.
Within minor wave B the first 5-3-5 downwards is incomplete. At 1,316 minuette wave (iii) would reach 1.618 the length of minuette wave (i).
This wave count requires confirmation below 1,328.18. At that point the main wave count would be fully invalidated.
Subminuette wave ii may not move beyond the start of subminuette wave i. This wave count is invalidated with movement above 1,353.07.
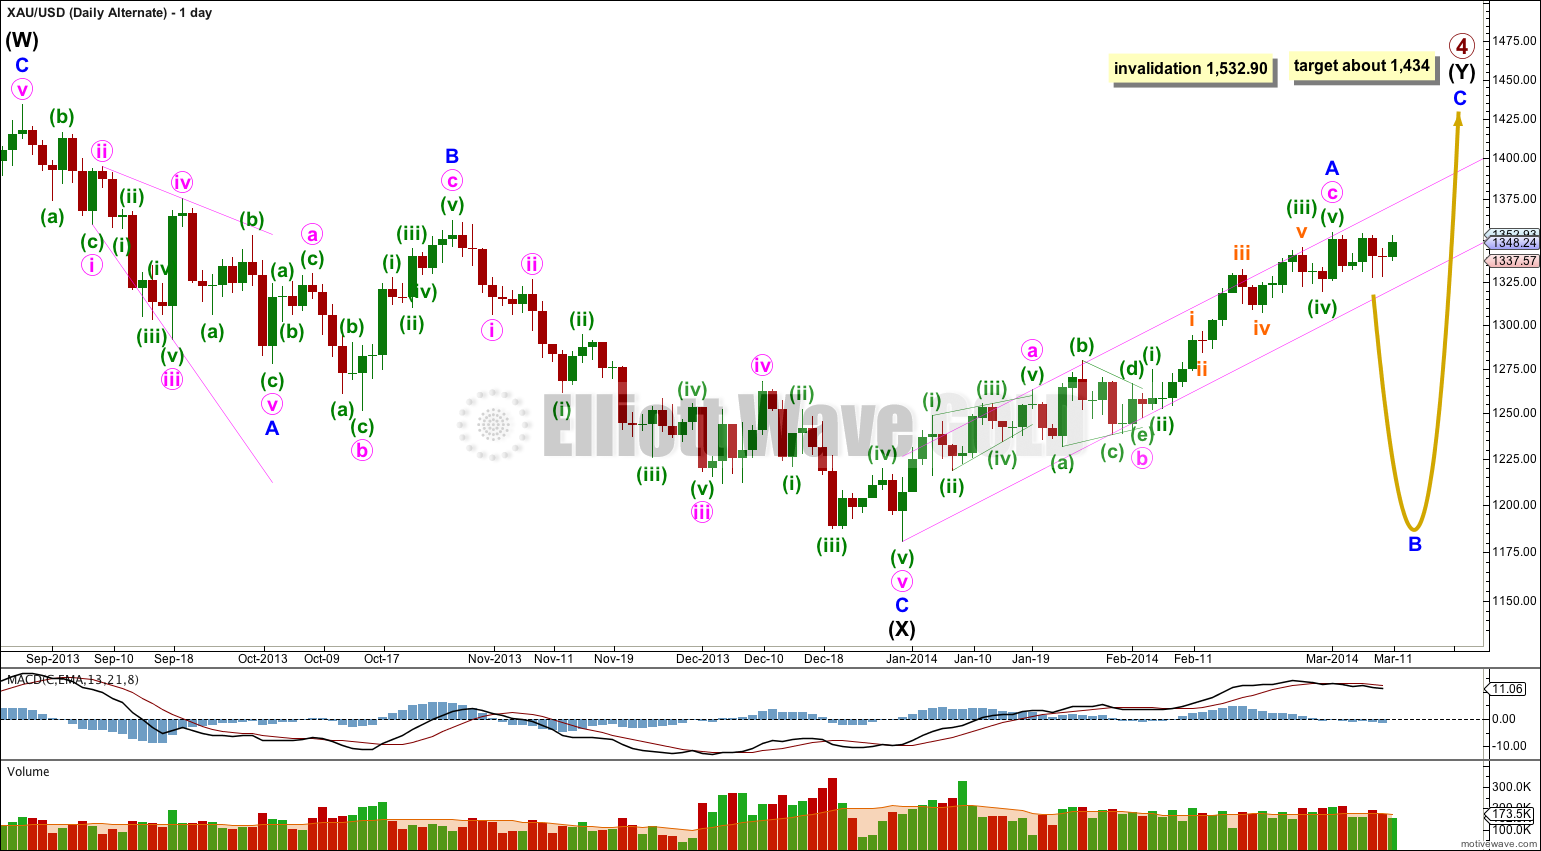
Alternate Daily Wave Count – Triangle.
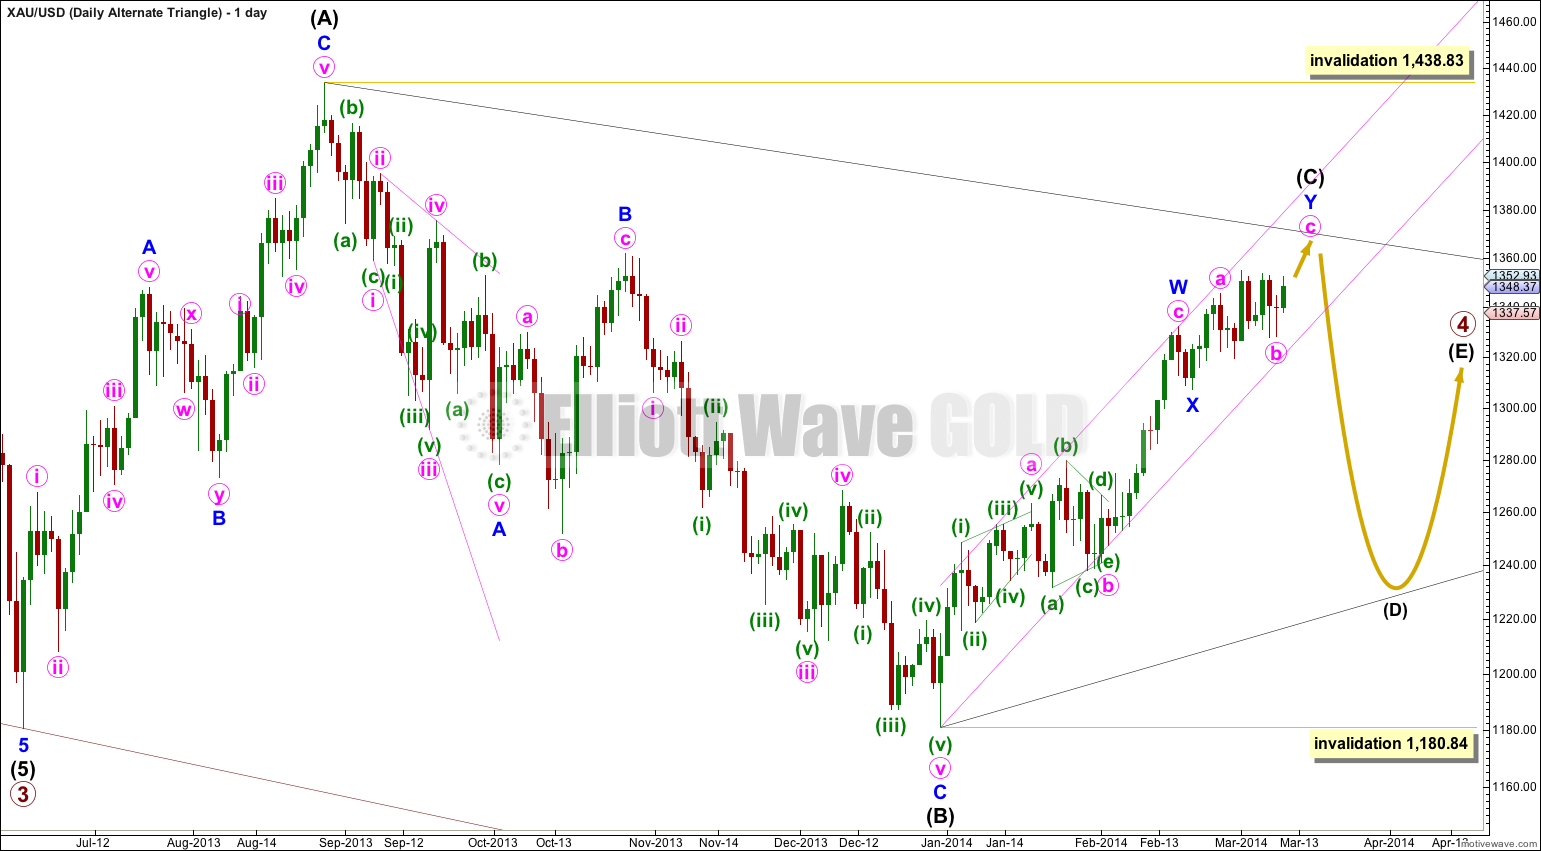
It is also possible that primary wave 4 may continue as a regular contracting (or barrier) triangle.
This wave count has a good probability. It does not diverge from the main wave count and it will not diverge for several weeks yet.
Triangles take up time and move price sideways. If primary wave 4 unfolds as a triangle then I would expect it to last months rather than weeks.
Hi Lara, do the subdivisions fit correctly for the c wave of the expanded flat? My data has wave 4 overlapping wave 1.
You are correct, if the third wave ended at 1,344.44.
I have the third wave extended ending at 1,339.23. I looked at it on the one minute chart.