
Downwards movement was expected for the main wave count. I have a new alternate wave count for you.
Summary: I expect a little upwards movement to 1,366 to complete a correction. This should be followed by more downwards movement. We need to see a clear breach of the pink channel on the daily chart before we may have confidence in this trend change.
This analysis is published about 05:15 p.m. EST. Click on charts to enlarge.
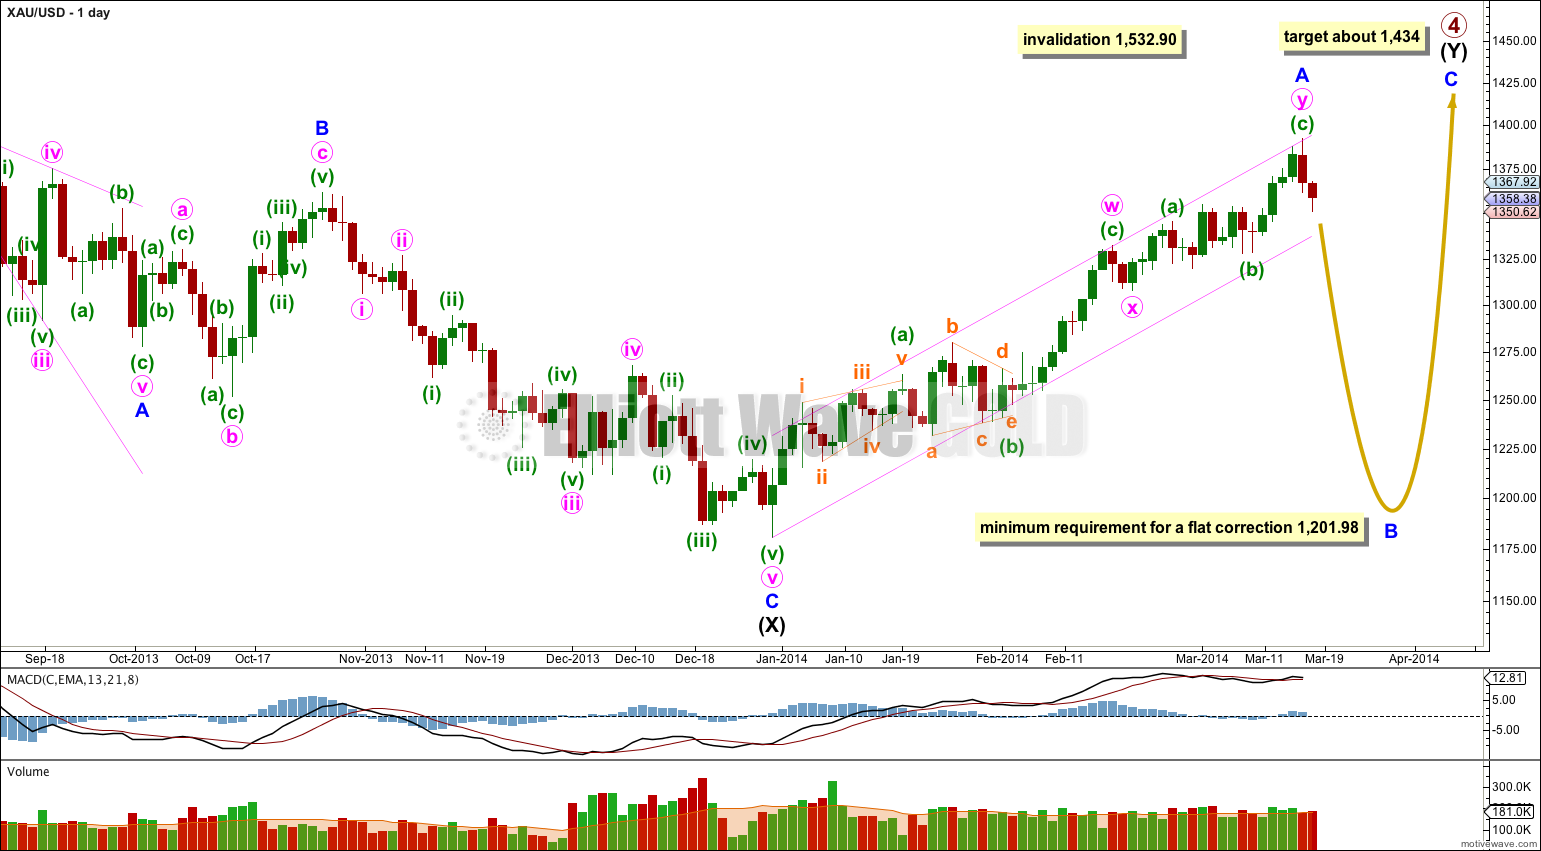
Gold is still within a large fourth wave correction at primary wave degree which is incomplete.
Primary wave 2 was a rare running flat. Primary wave 4 is unlikely to be a flat correction because it is likely to show structural alternation with primary wave 2.
The first upwards wave within primary wave 4 labeled intermediate wave (W) subdivides as a three wave zigzag. Primary wave 4 cannot be an unfolding zigzag because the first wave within a zigzag, wave A, must subdivide as a five.
Primary wave 4 is unlikely to be completing as a double zigzag because intermediate wave (X) is a deep 99% correction of intermediate wave (W). Double zigzags commonly have shallow X waves because their purpose it to deepen a correction when the first zigzag does not move price deep enough.
Primary wave 4 is most likely to be completing as a double combination: zigzag – X – second structure. The second structure labeled intermediate wave (Y) may be either a flat or a triangle. For both these structures minor wave A must be a three.
Minor wave A may again be a complete structure now that it unfolds nicely as a double zigzag. It may have ended at the upper edge of its channel. We need to see this channel breached with a full daily candlestick below the lower pink trend line and not touching it before we may have confidence in a trend change at minor degree.
Primary wave 4 may not move into primary wave 1 price territory. This wave count is invalidated with movement above 1,532.90.
Main Hourly Wave Count.
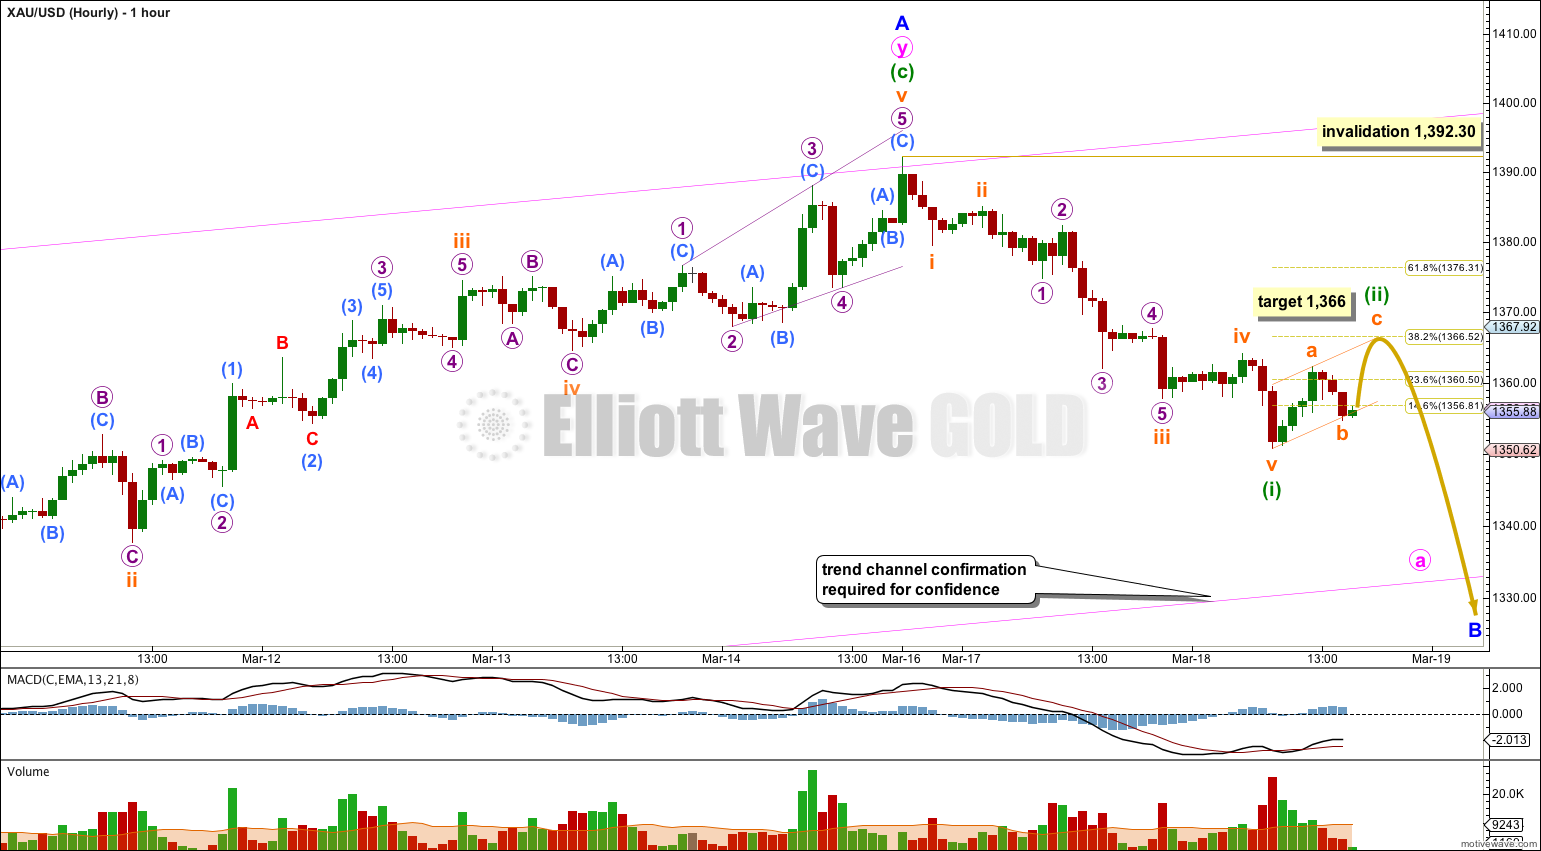
Downwards movement so far subdivides nicely as a completed five wave impulse.
Ratios within minuette wave (i) are: there is no Fibonacci ratio between subminuette waves iii and i, and subminuette wave v is just 0.52 longer than equality with subminuette wave i.
Ratios within subminuette wave iii are: there is no Fibonacci ratio between micro waves 3 and 1, and micro wave 5 is 0.38 short of equality with micro wave 1.
If this downwards wave is a first wave then I would expect the following second wave to be incomplete. It looks like minuette wave (ii) may be unfolding as a simple zigzag. At 1,366 subminuette wave c would reach equality with subminuette wave a and minuette wave (ii) would end about the 0.382 Fibonacci ratio of minuette wave (i).
I have drawn a small channel about minuette wave (ii). I would expect subminuette wave c to find resistance and end at the upper edge of this channel. Subsequent downwards movement breaching the channel would provide confirmation that minuette wave (ii) should be over and minuette wave (iii) downwards should have begun.
Minuette wave (ii) may not move beyond the start of minuette wave (i). This wave count is invalidated with movement above 1,392.30.
To have full confidence in this wave count I still require a clear breach of the pink channel on the DAILY chart.
Alternate Wave Count.
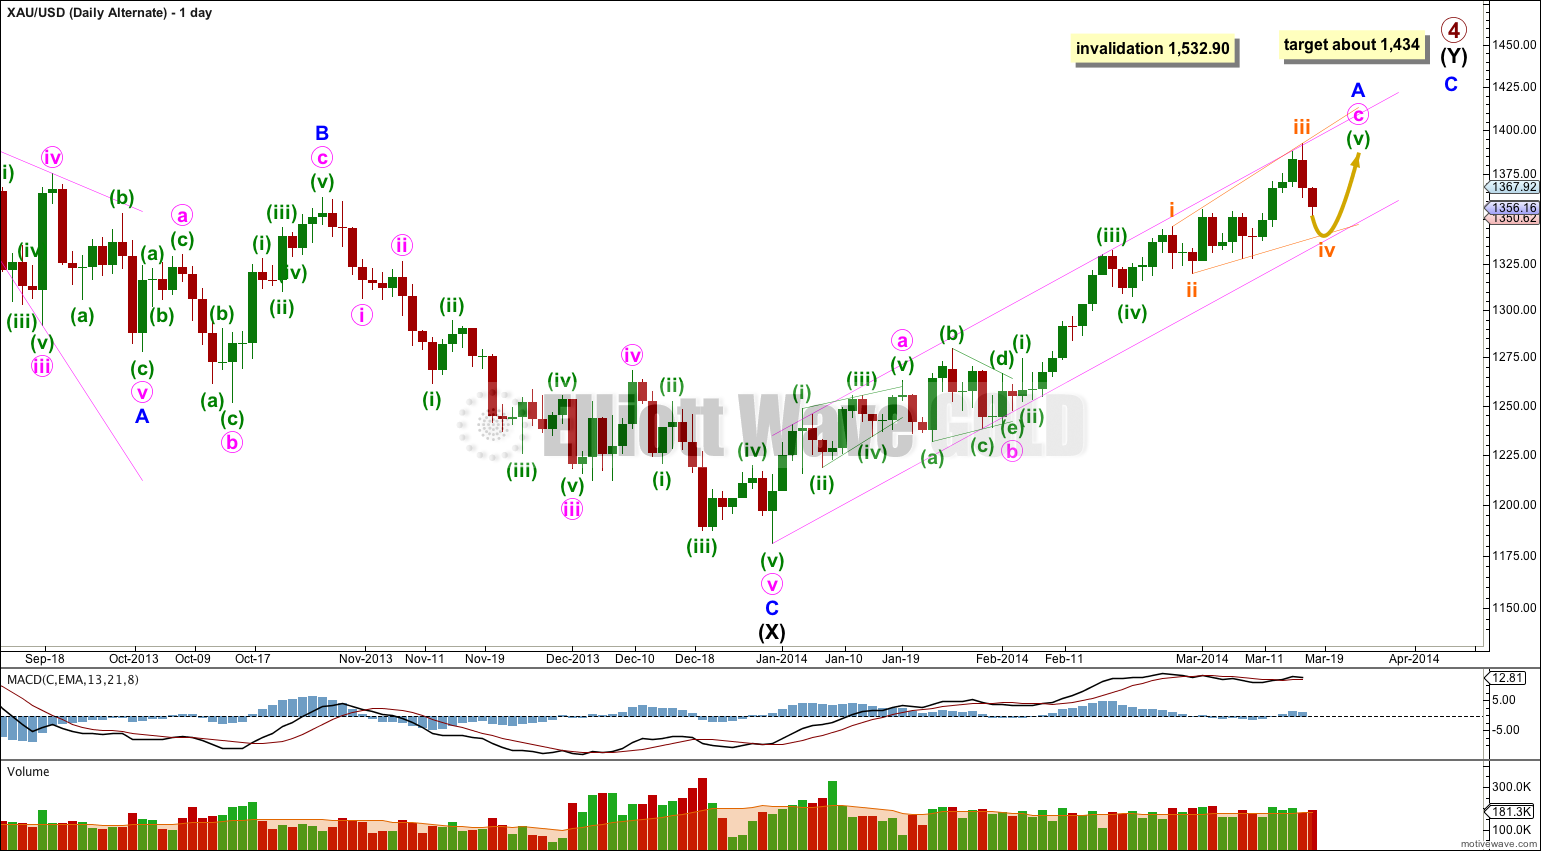
This alternate idea looks at the possibility that minor wave A is an incomplete single zigzag. This alternate wave count has a low probability for several reasons.
This wave count is the same as the main wave count for the first part of minor wave A with a leading diagonal followed by a triangle, but thereafter if differs.
If minute wave c began at 1,247.40 then within it minuette wave (ii) barely shows on the daily chart as a small green doji, but minuette wave (iv) shows on the daily chart as two clear red candlesticks. In my experience of impulses within Gold the second and fourth wave subdivisions should both be clear on the daily chart.
Minuette wave (v) may be an ending expanding diagonal which is incomplete. Within this diagonal subminuette waves ii and iv show clearly on the daily chart, yet they are one degree lower than minuette wave (ii) which does not show up on the daily chart. This would be highly unusual for Gold and reduces the probability of this wave count.
The diagonal would be incomplete.
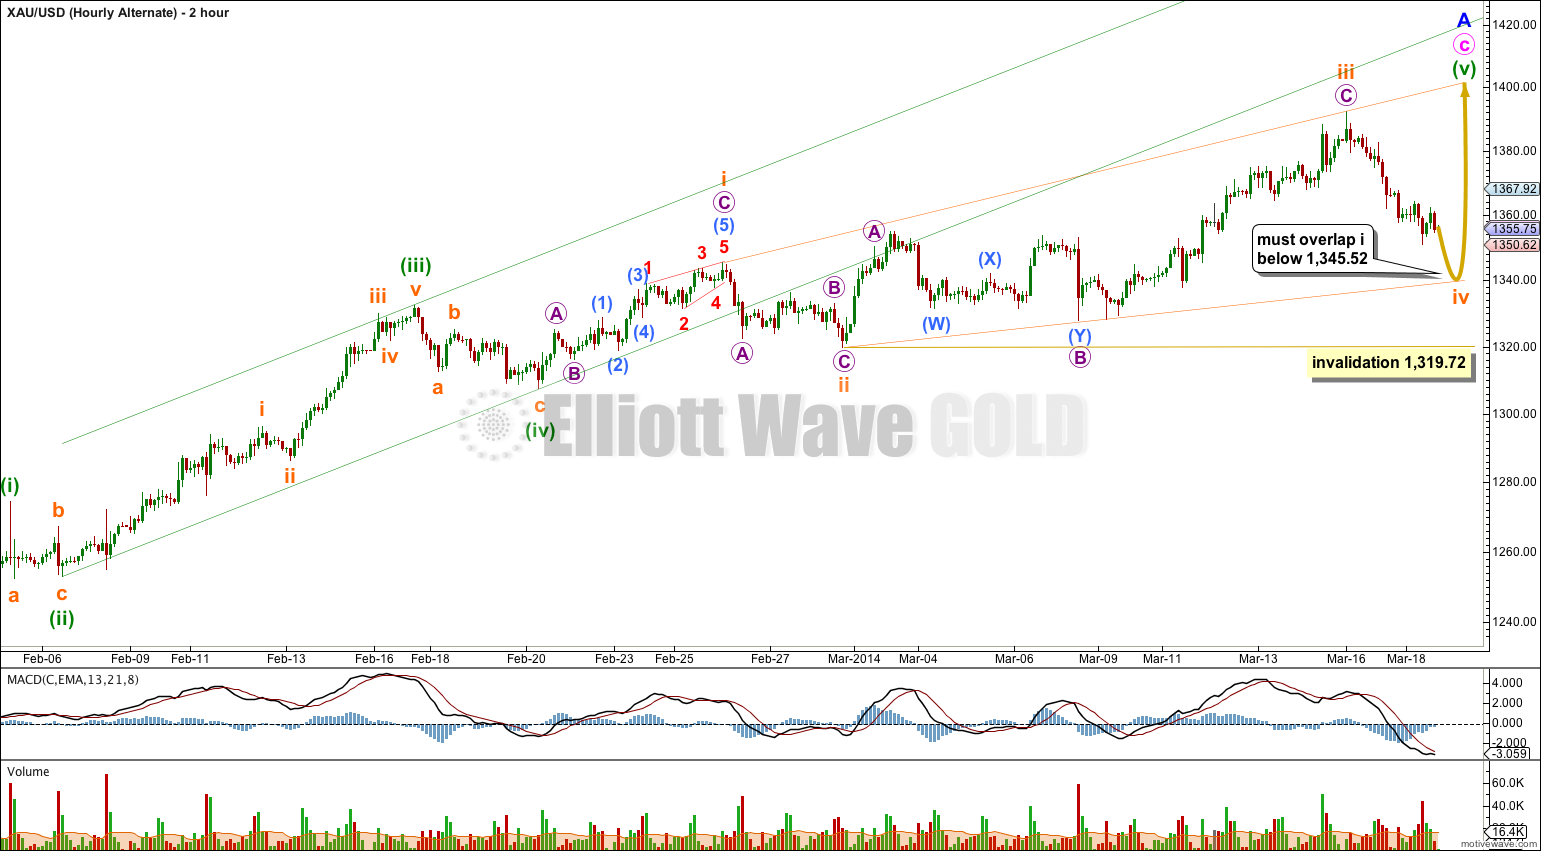
The two hourly chart shows the subdivisions of minute wave c.
If we draw a channel about this possible upwards impulse using either of Elliott’s two techniques (the green channel is drawn using the second technique) recent movement falls well below either channel. This is highly unusual for Gold and further reduces the probability of this wave count.
Subminuette wave iv of the diagonal would be incomplete. It must overlap subminuette wave i price territory, so it requires more downwards movement below 1,345.52.
Subminuette wave iv may not move beyond the end of subminuette wave ii. This wave count is invalidated with movement below 1,319.72.
Alternate Daily Wave Count – Triangle.
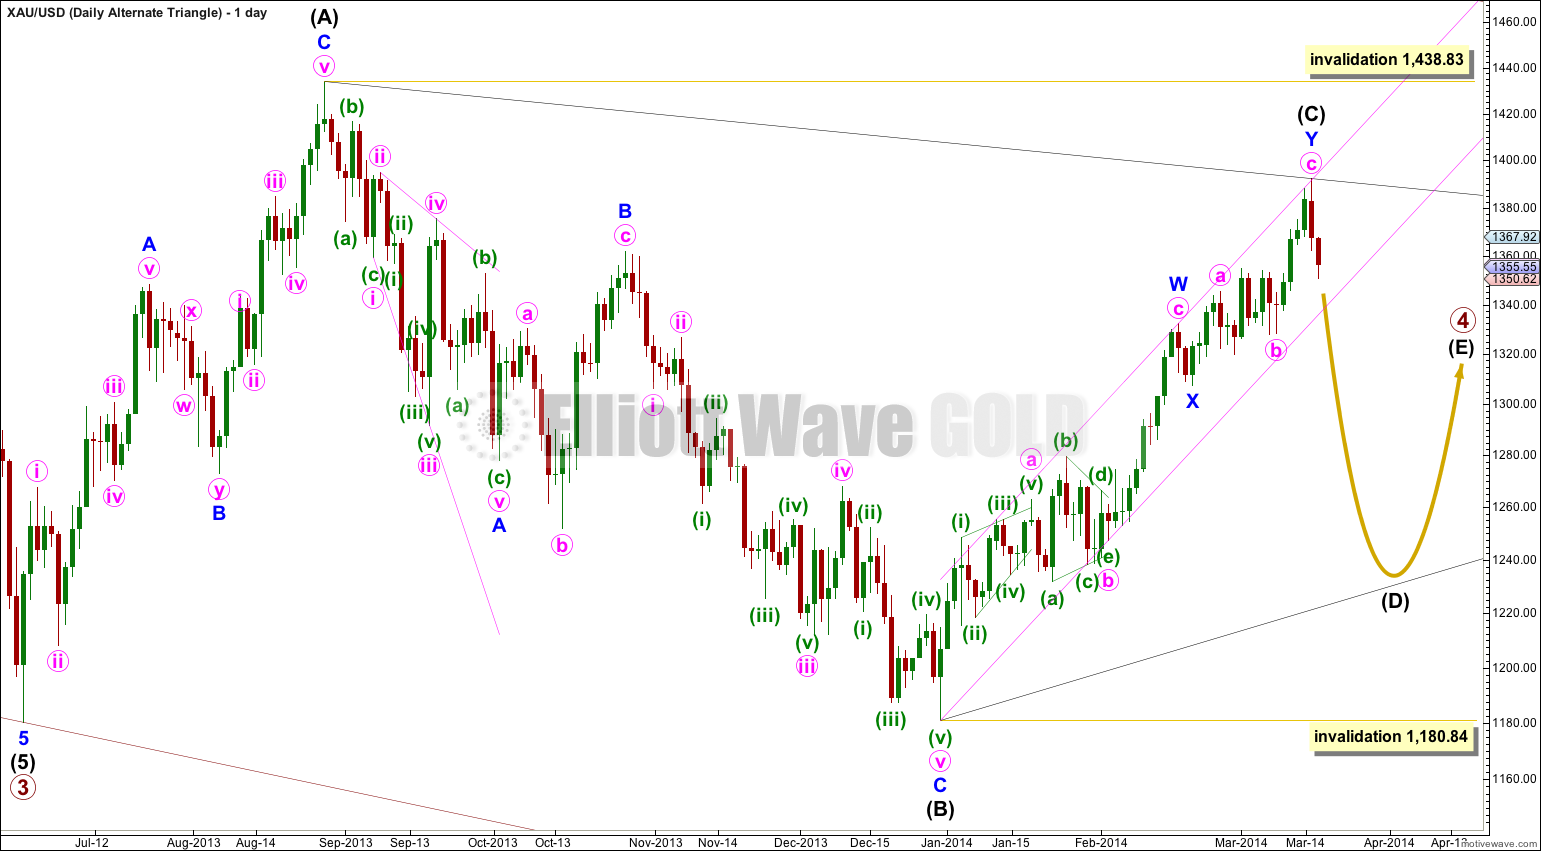
It is also possible that primary wave 4 may continue as a regular contracting (or barrier) triangle.
This wave count has a good probability. It does not diverge from the main wave count and it will not diverge for several weeks yet.
Triangles take up time and move price sideways. If primary wave 4 unfolds as a triangle then I would expect it to last months rather than weeks.