
Downwards movement again has continued as expected.
We now have a clear breach of the pink channel on the daily chart providing final confirmation of a trend change at minor degree.
Summary: I have full confidence in a trend change. I expect overall downwards movement to continue for maybe up to ten weeks. The short term target is now calculated at two wave degrees at 1,295 to 1,293. This may be met within 24 to 36 hours.
This analysis is published about 04:50 p.m. EST. Click on charts to enlarge.
Main Wave Count.
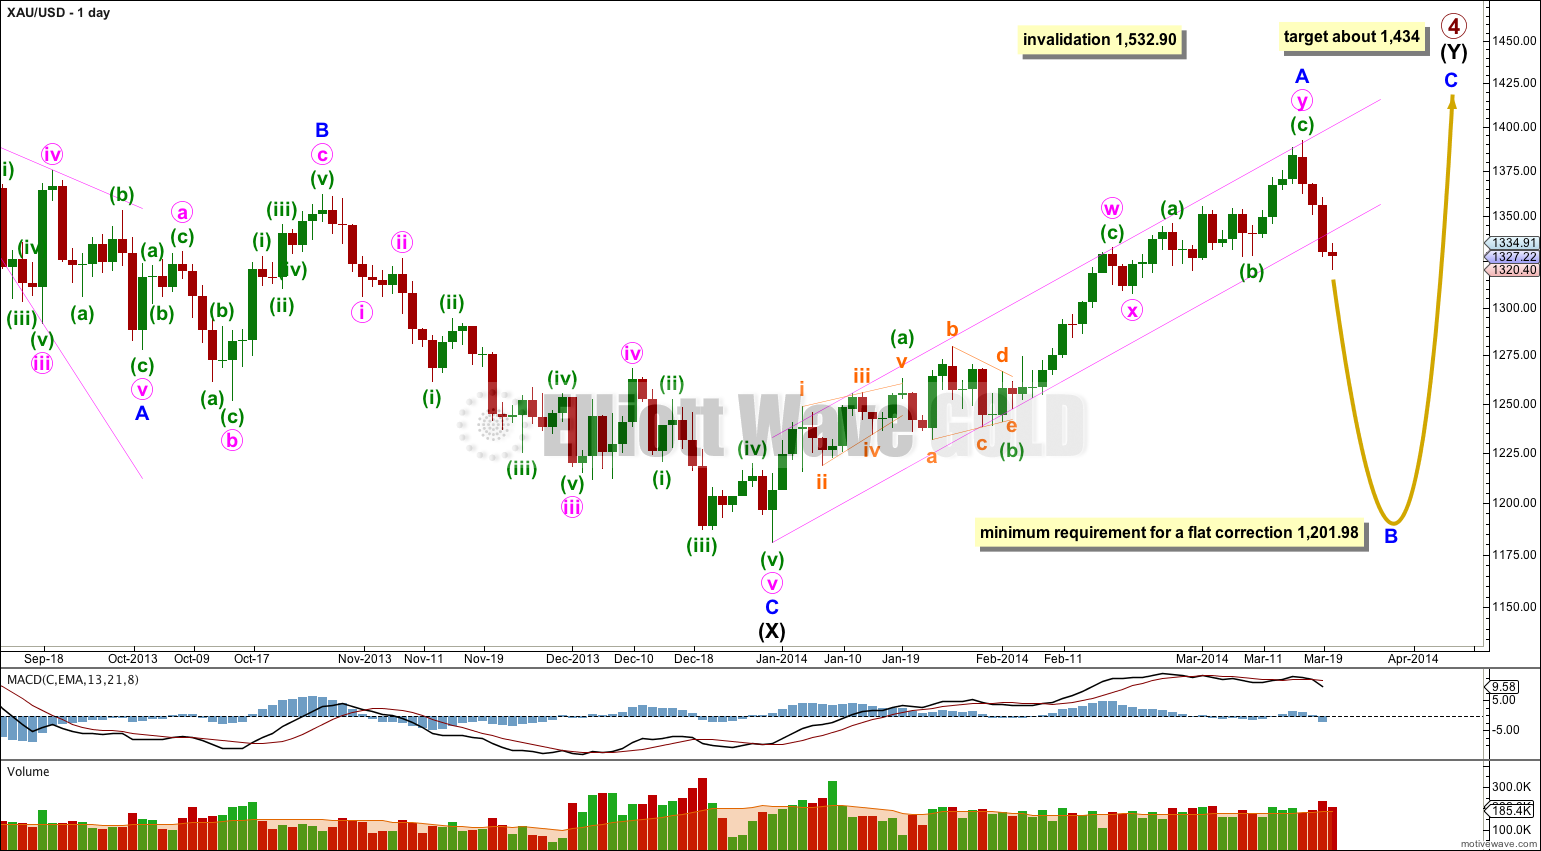
Gold is still within a large fourth wave correction at primary wave degree which is incomplete.
Primary wave 2 was a rare running flat. Primary wave 4 is unlikely to be a flat correction because it is likely to show structural alternation with primary wave 2.
The first upwards wave within primary wave 4 labeled intermediate wave (W) subdivides as a three wave zigzag. Primary wave 4 cannot be an unfolding zigzag because the first wave within a zigzag, wave A, must subdivide as a five.
Primary wave 4 is unlikely to be completing as a double zigzag because intermediate wave (X) is a deep 99% correction of intermediate wave (W). Double zigzags commonly have shallow X waves because their purpose it to deepen a correction when the first zigzag does not move price deep enough.
Primary wave 4 is most likely to be completing as a double combination: zigzag – X – second structure. The second structure labeled intermediate wave (Y) may be either a flat or a triangle. For both these structures minor wave A must be a three.
Primary wave 4 may not move into primary wave 1 price territory. This wave count is invalidated with movement above 1,532.90.
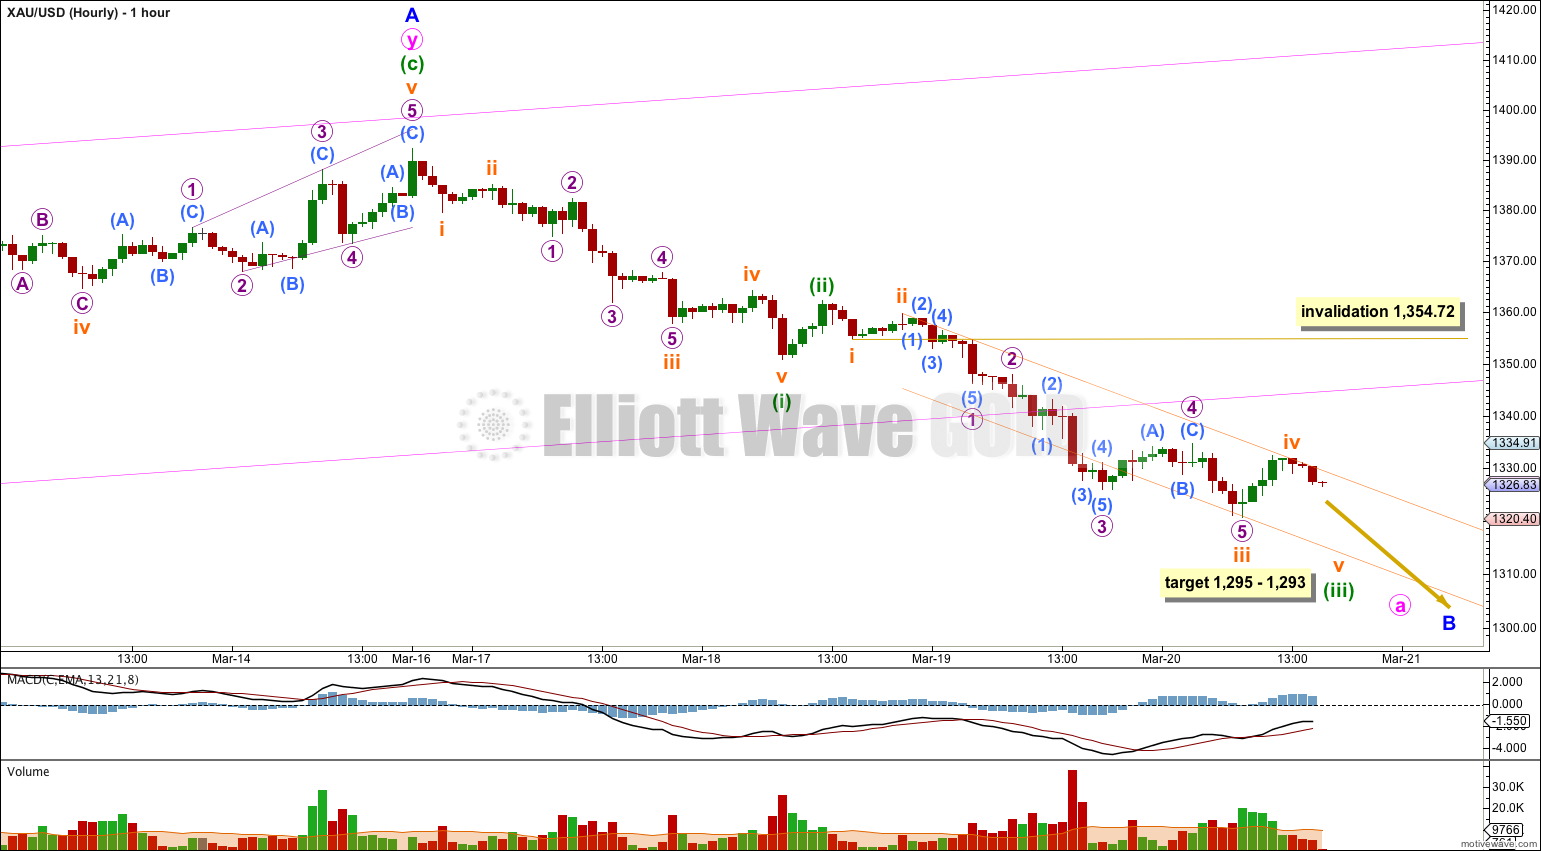
There are more than thirteen possible corrective structures that minor wave B may take. It is most likely to be a zigzag. Within a zigzag minute wave a must subdivide as a five wave motive structure, either a leading diagonal or an impulse. This downwards movement so far is clearly not a diagonal and it may be an impulse.
This main hourly wave count follows the most likely structure of a zigzag for minor wave B.
Within minute wave a minuette wave (iii) is incomplete. At 1,295 minute wave (iii) would reach 1.618 the length of minute wave (i).
Within minute wave (iii) there is no Fibonacci ratio between subminuette waves iii and i. This makes it more likely we shall see a Fibonacci ratio between subminuette wave v and either of iii or i. At 1,293 subminuette wave v would reach equality in length with subminuette wave iii. This target expects that both subminuette waves iii and v will extend.
Ratios within subminuette wave iii are: micro wave 3 is 0.15 longer than 1.618 the length of micro wave 1 and micro wave 5 is just 0.14 longer than equality with micro wave 1. These ratios are perfect and give me confidence this movement is labeled correctly.
Draw a channel about minuette wave (iii) using Elliott’s technique. Draw the first trend line from the ends of subminuette waves ii to iv, then place a parallel copy upon the end of subminuette wave iii. I would expect subminuette wave v to end either about the lower edge of this channel, or it may breach the lower edge. When this channel is breached by subsequent upwards movement then we shall have trend channel confirmation that minuette wave (iii) is over and minuette wave (iv) is underway.
At this stage it is possible that subminuette wave iv is incomplete. If it moves higher and further sideways then it may not move into subminuette wave i price territory. This wave count is invalidated with movement above 1,354.72.
When minuette wave (iii) is complete then this main wave count would expect a small correction for minuette wave (iv). It would most likely move back up to the price territory of subminuette wave iv about 1,320.8 to 1,331.74. It may not move back into minuette wave (i) price territory above 1,350.83.
Alternate Hourly Wave Count.
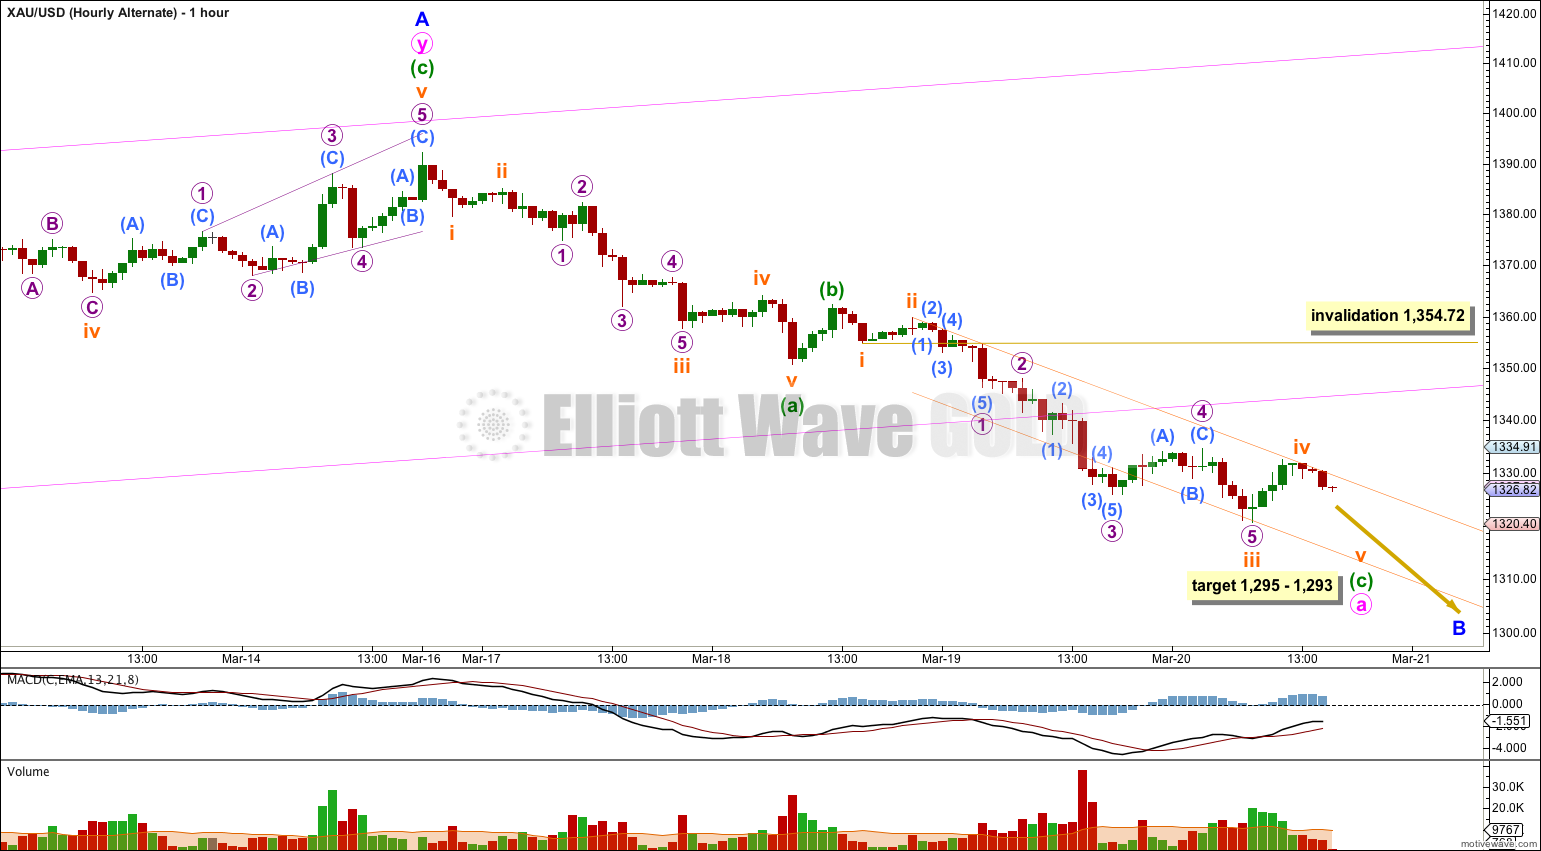
If minor wave B is a flat (or a combination with a flat as the first structure) then minute wave a within it must subdivide as a three. Minute wave a for this alternate is seen as an incomplete zigzag.
At this stage this alternate wave count does not diverge from the main wave count. It will only diverge when the current five down labeled here as minuette wave (c) is complete. At that stage this alternate would expect a three wave structure upwards for minute wave b which may reach 90% the length of minute wave a, and may make a new high. At that stage there would be no upper invalidation point for this alternate wave count.
The price point at 1,350.83 would then differentiate these two hourly wave counts. The main wave count would use that point as an invalidation point, and this alternate would expect movement above that point as very likely.
Alternate Daily Wave Count – Triangle.
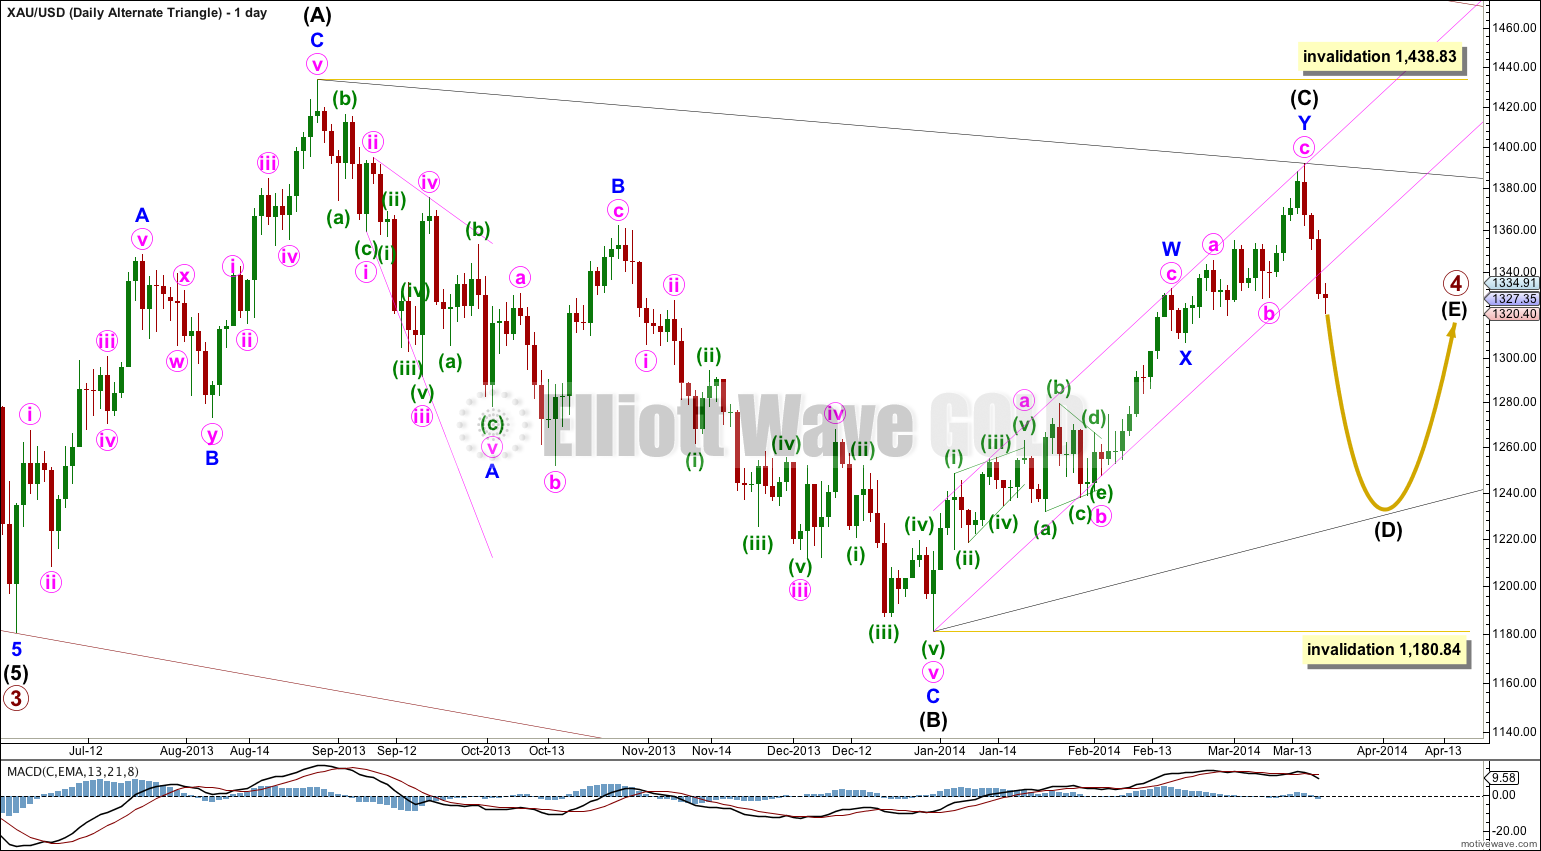
It is also possible that primary wave 4 may continue as a regular contracting (or barrier) triangle. With MACD moving reasonably close to the zero line on the daily chart this triangle looks typical. This wave count has an even probability with the main wave count.
This wave count has a good probability. It does not diverge from the main wave count and it will not diverge for several weeks yet.
Triangles take up time and move price sideways. If primary wave 4 unfolds as a triangle then I would expect it to last months rather than weeks.
There’s a little in the FAQ.
I use Motive Wave every day. I find it saves me so much time. I have not used any competing EW software though, so I cannot compare it to anything else EW. But of all the charting software I have used it has the best tools I have seen.
I don’t use it’s auto label feature for EW because I almost always disagree with what it comes up with. It also has a couple of things I think are wrong, such as it allows one to subdivide a C wave within a three (not a triangle, but a zigzag or flat) into a three wave structure when C waves must be fives, but apart from that it’s great.
I used to label my charts in photoshop. Motive Wave saves me an enormous amount of time, and makes labeling alternate wave counts super easy.
Hello Lara, just wondering your opinion of “MotiveWave Elliott Wave Software “. There wasn’t any comment section under the offer. Is it incredible and easy and proven and outperforms the competition? Since your opinion is highly regarded, any feedback would be appreciated.
Hi, Lara,
I have another alternate wave count of the gold, and would you mind to make some comments on it as I want to further my skills on this technique on the ways buying your expertise newsletter. Many thanks.
Please label your charts more carefully; some of the labels are “floating”, they are not precisely at the end of the bar you consider the wave end. This makes it more difficult to see what you mean. You may think me pedantic, but EW is exact, the rules are black and white, so labeling must be precise.
Within minute (pink) wave c upwards; at the start of that movement your micro (purple) wave 2 ends very slightly below the start of micro wave 1. That part of the wave count is invalid.
Within minuette wave (i) downwards within subminuette wave v your micro wave 2 has a severe truncation; try seeing that second wave over at the high within it, and that changes the rest of the wave count down.
Thanks Lara, I will be careful to do that next time, thanks for your response.