
Movement above 1,333.02 invalidated the hourly wave count. Upwards movement was not expected for Monday’s session. The wave count is changed.
Summary: Minor wave A is continuing higher. The target at 1,377 – 1,380 may be met within two days.
This analysis is published about 06:30 p.m. EST. Click on charts to enlarge.
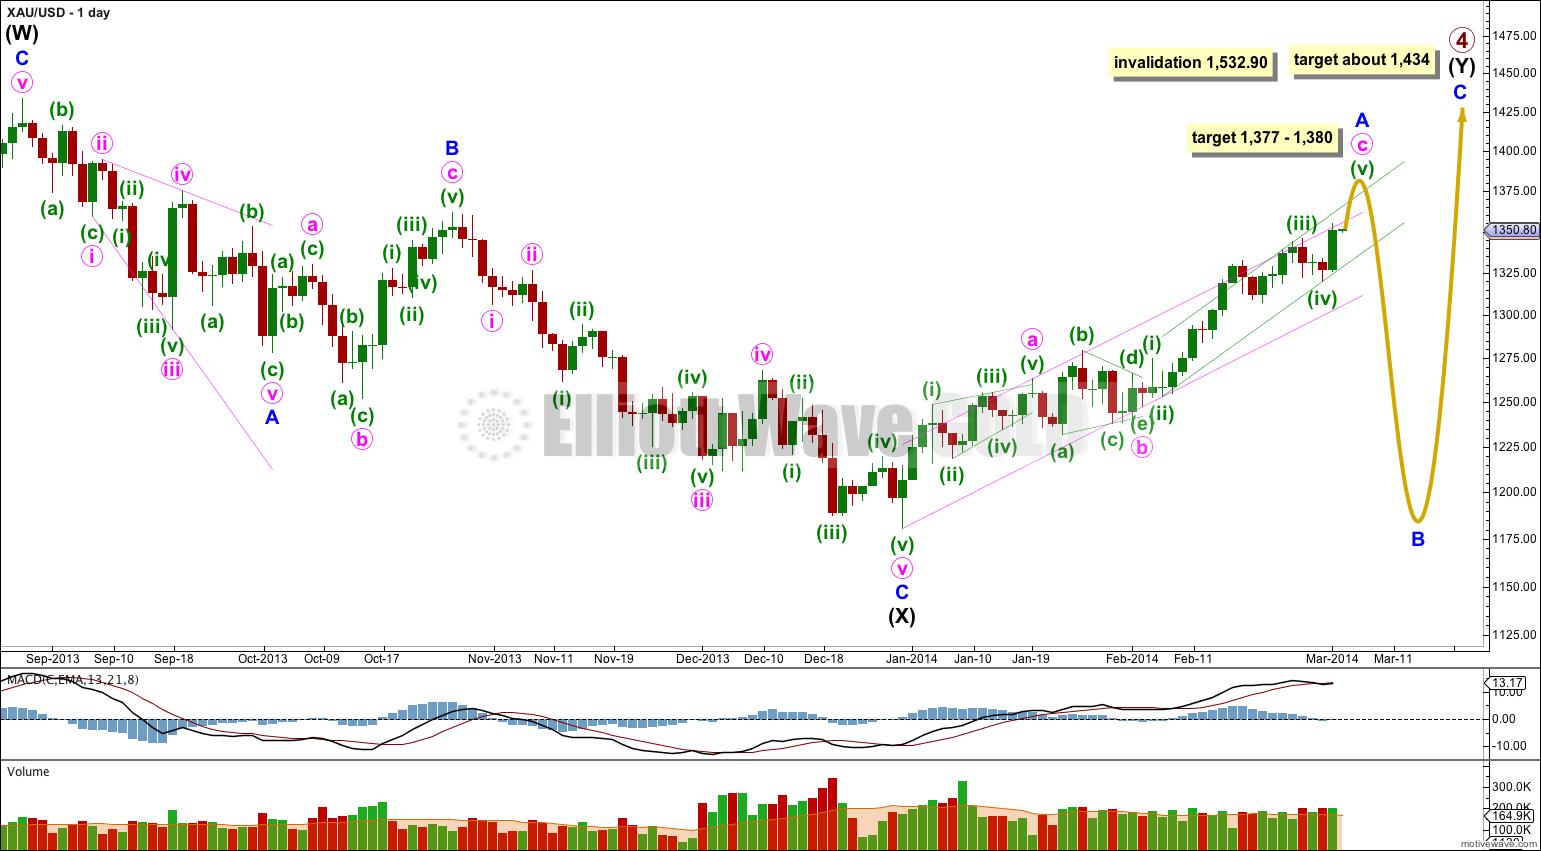
Gold is still within a large fourth wave correction at primary wave degree which is incomplete.
Primary wave 2 was a rare running flat. Primary wave 4 is unlikely to be a flat correction because it is likely to show structural alternation with primary wave 2.
The first upwards wave within primary wave 4 labeled here intermediate wave (W) subdivides as a three wave zigzag. Primary wave 4 cannot be an unfolding zigzag because the first wave within a zigzag, wave A, must subdivide as a five.
Primary wave 4 is unlikely to be completing as a double zigzag because intermediate wave (X) is a deep 99% correction of intermediate wave (W). Double zigzags commonly have shallow X waves because their purpose it to deepen a correction when the first zigzag does not move price deep enough.
Primary wave 4 is most likely to be completing as a double combination: zigzag – X – second structure. The second structure labeled intermediate wave (Y) may be either a flat or a triangle. For both these structures minor wave A must be a three, and is most likely to be a zigzag.
Minor wave A is an incomplete zigzag. At 1,380 minute wave c would reach 1.618 the length of minute wave a. At 1,377 minuette wave (v) would reach 0.618 the length of minuette wave (iii).
The reason for the invalidation, and the source of my problem with this structure at this time, is the subdivisions within minute wave c. For gold the subdivisions of the second and fourth waves within its impulses at minute degree normally show up very clearly on the daily chart. For this minute wave c the second wave corrections within it are not showing as clearly as the fourth waves on the daily chart. It does not have a very typical look.
Primary wave 4 may not move into primary wave 1 price territory. This wave count is invalidated with movement above 1,532.90.
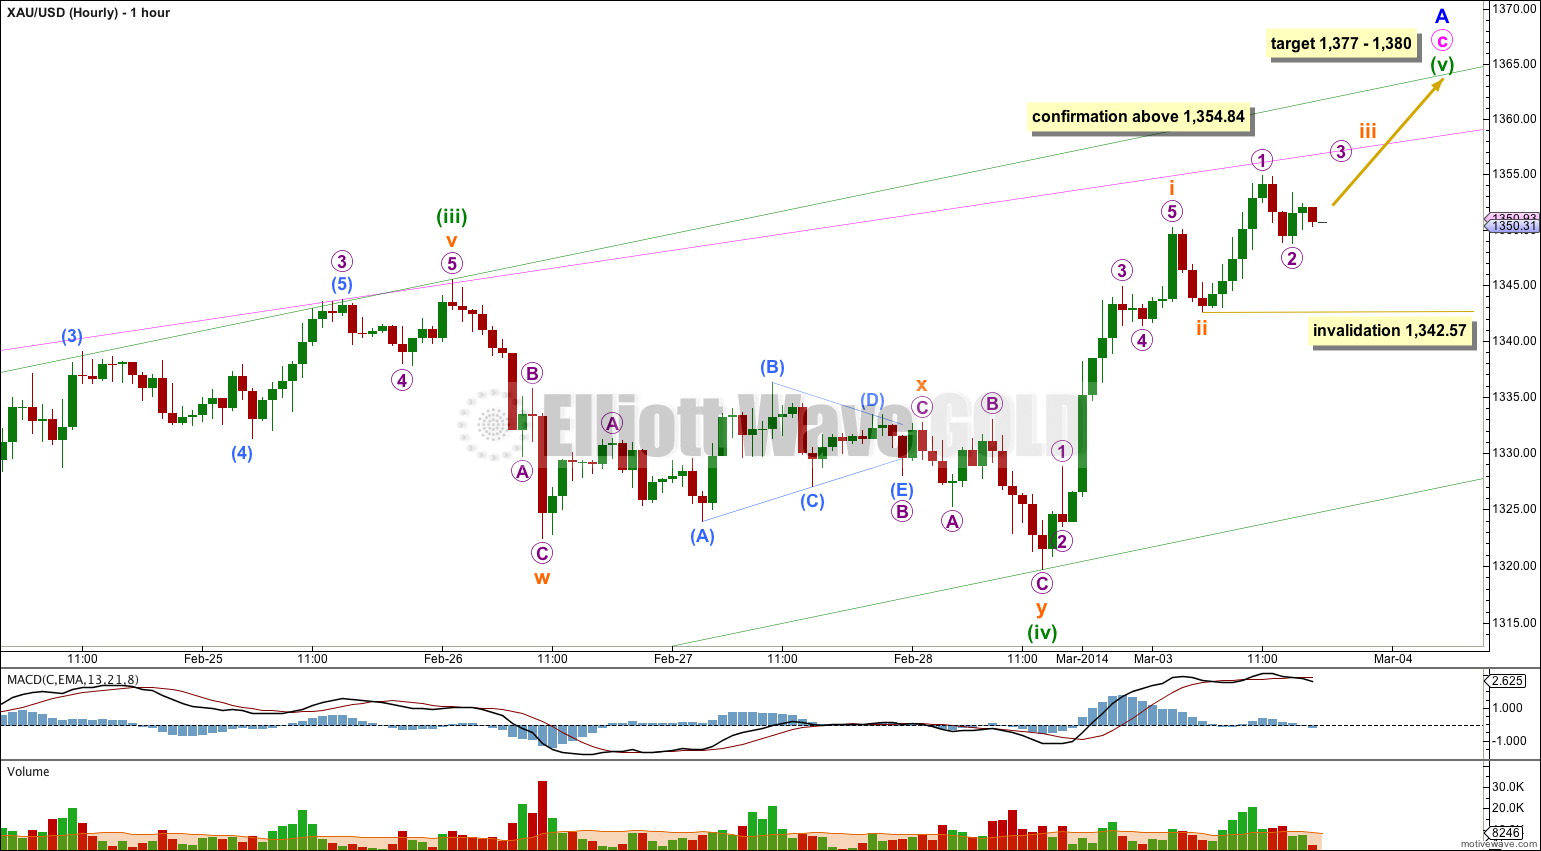
Main Hourly Wave Count.
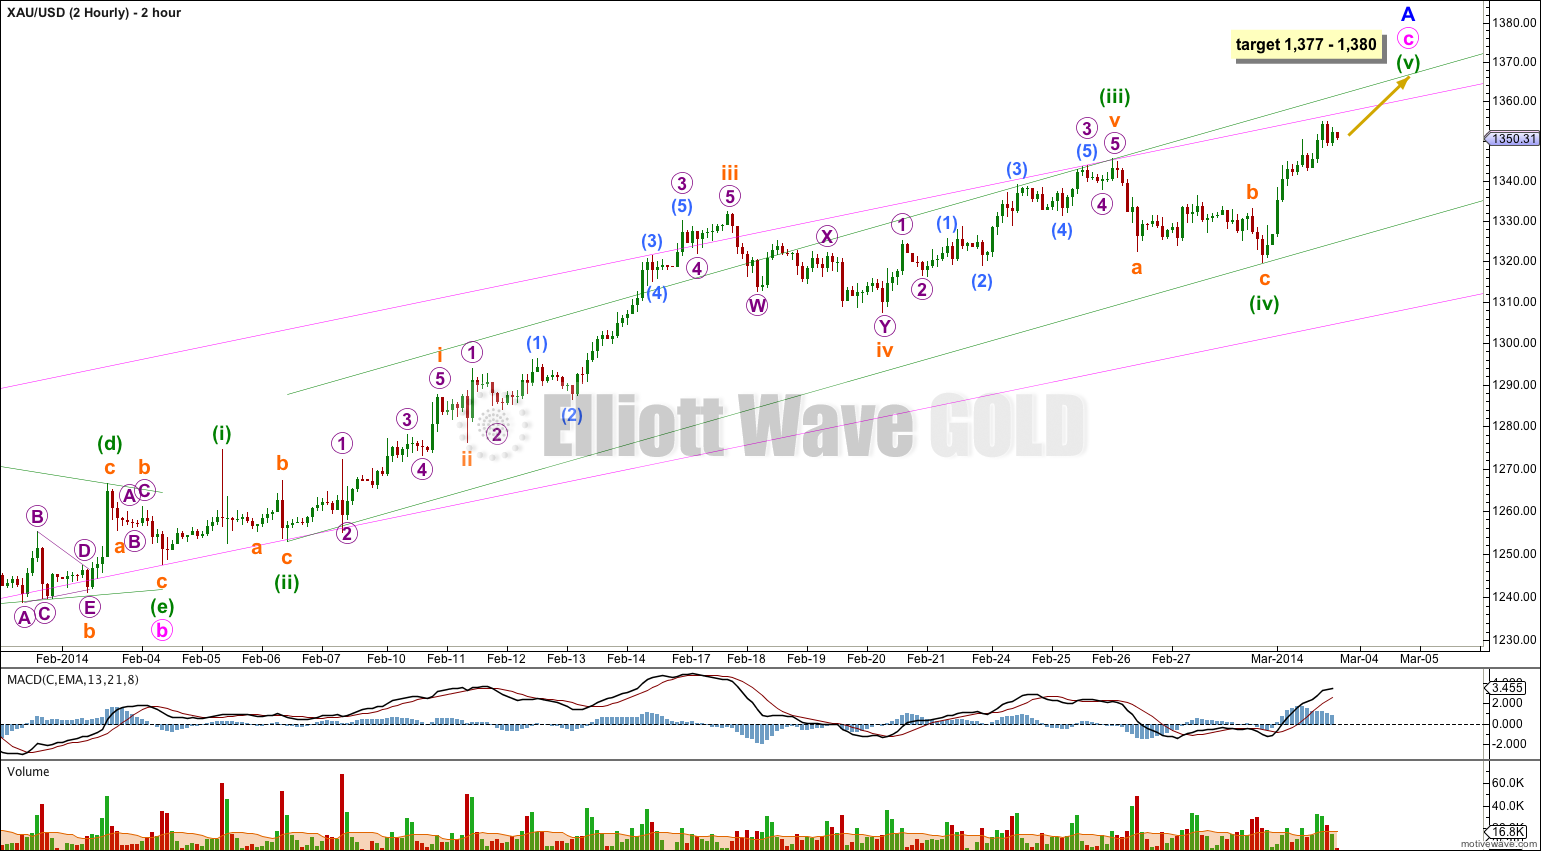
This 2 hourly chart shows the whole structure of minute wave c.
I have again checked the subdivisions within the triangle of minute wave b to see if that could have been a series of overlapping first and second waves. Subwaves minuette (b) and (d) quite simply do not subdivide as fives and so that idea does not fit. The triangle is correct.
Within minute wave c there is no Fibonacci ratio between minuette waves (iii) and (i).
Ratios within minuette wave (iii) are: subminuette wave iii is just 0.09 short of 1.618 the length of subminuette wave i, and subminuette wave v is 3.29 longer than equality with subminuette wave i. These ratios are close to perfect indicating that this third wave may be now labeled correctly.
Because there is no ratio between minuette waves (iii) and (i) it is more likely we shall see a Fibonacci ratio for the final fifth wave.
Draw a parallel channel about minuette wave c using Elliott’s second technique (green trend channel). I would expect minuette wave (v) to end about the upper edge of this channel.
If minuette wave (v) has begun at 1,319.72 then this structure is an incomplete impulse and requires more upwards movement.
Within it subminuette wave ii may be over already as a brief shallow zigzag. Or it may yet move lower as per the alternate hourly wave count below. Movement above 1,354.84 would invalidate the alternate and provide a little confidence in the target.
Within subminuette wave iii micro wave 2 may not move beyond the start of micro wave 1. This wave count is invalidated with movement below 1,342.57. If price moves below 1,342.57 the alternate below would be confirmed.
If upwards movement ends in two more days then minute wave c would have lasted a Fibonacci 21 days in total.
Alternate Hourly Wave Count.
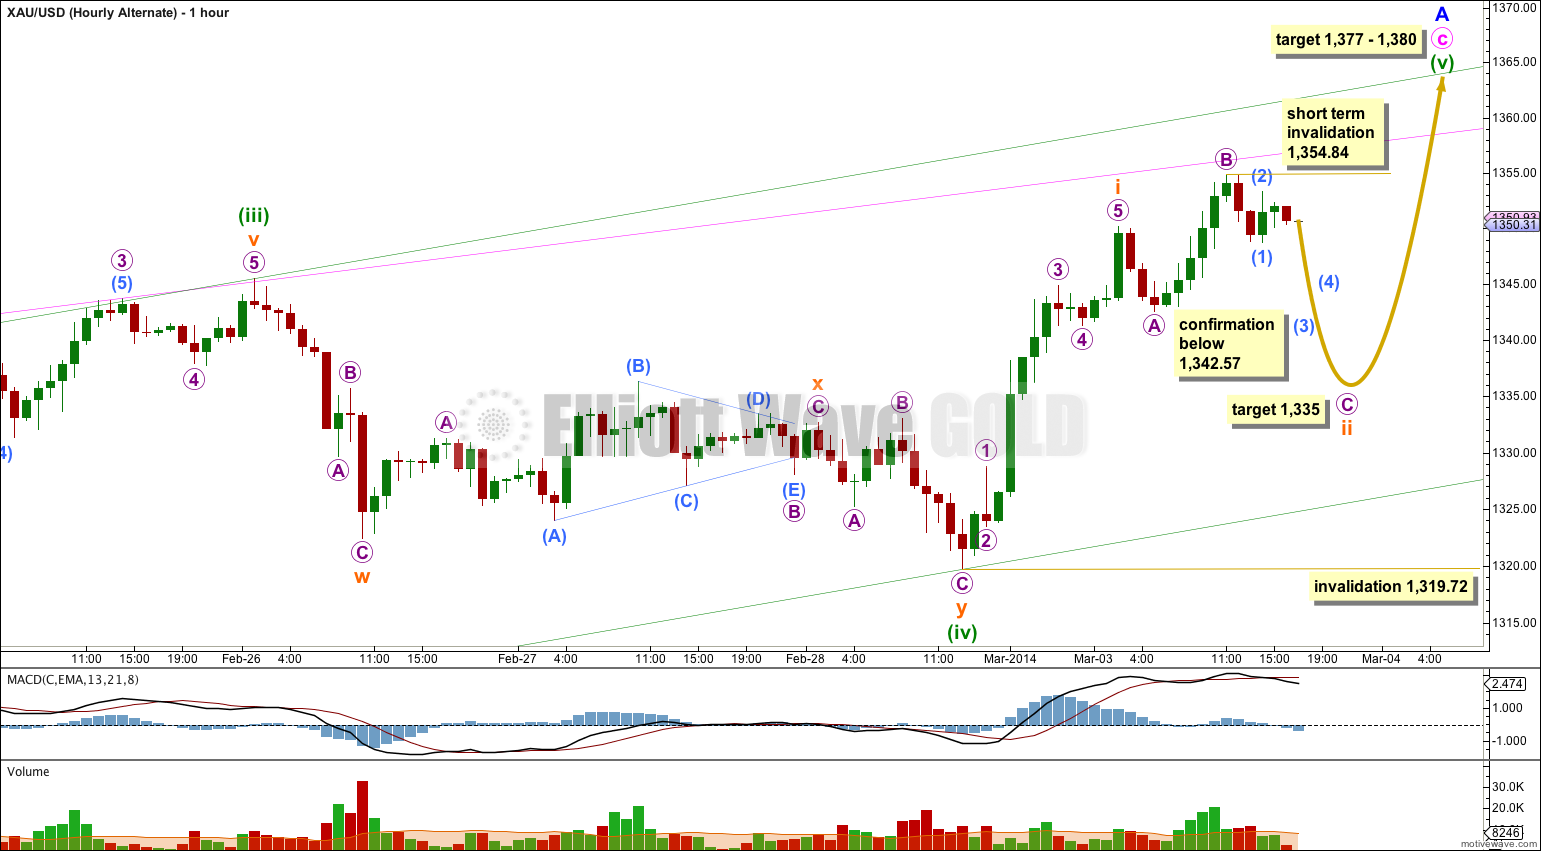
Subminuette wave ii may be unfolding as an expanded flat correction. I have checked the subdivisions within the upwards wave labeled here micro wave B on the five minute chart. This movement is ambiguous as it is possible to see it as either a three or a five. This alternate sees it as a three.
At 1,335 micro wave C would reach 2.618 the length of micro wave A.
Movement below 1,342.57 would invalidate the main hourly wave count and confirm this alternate.
Subminuette wave ii may not move beyond the start of subminuette wave i. This wave count is invalidated with movement below 1,319.72.
In the short term while micro wave C is incomplete submicro wave (2) may not move beyond the start of submicro wave (1). This wave count is invalidated in the short term with movement above 1,354.84.
Alternate Daily Wave Count – Triangle.
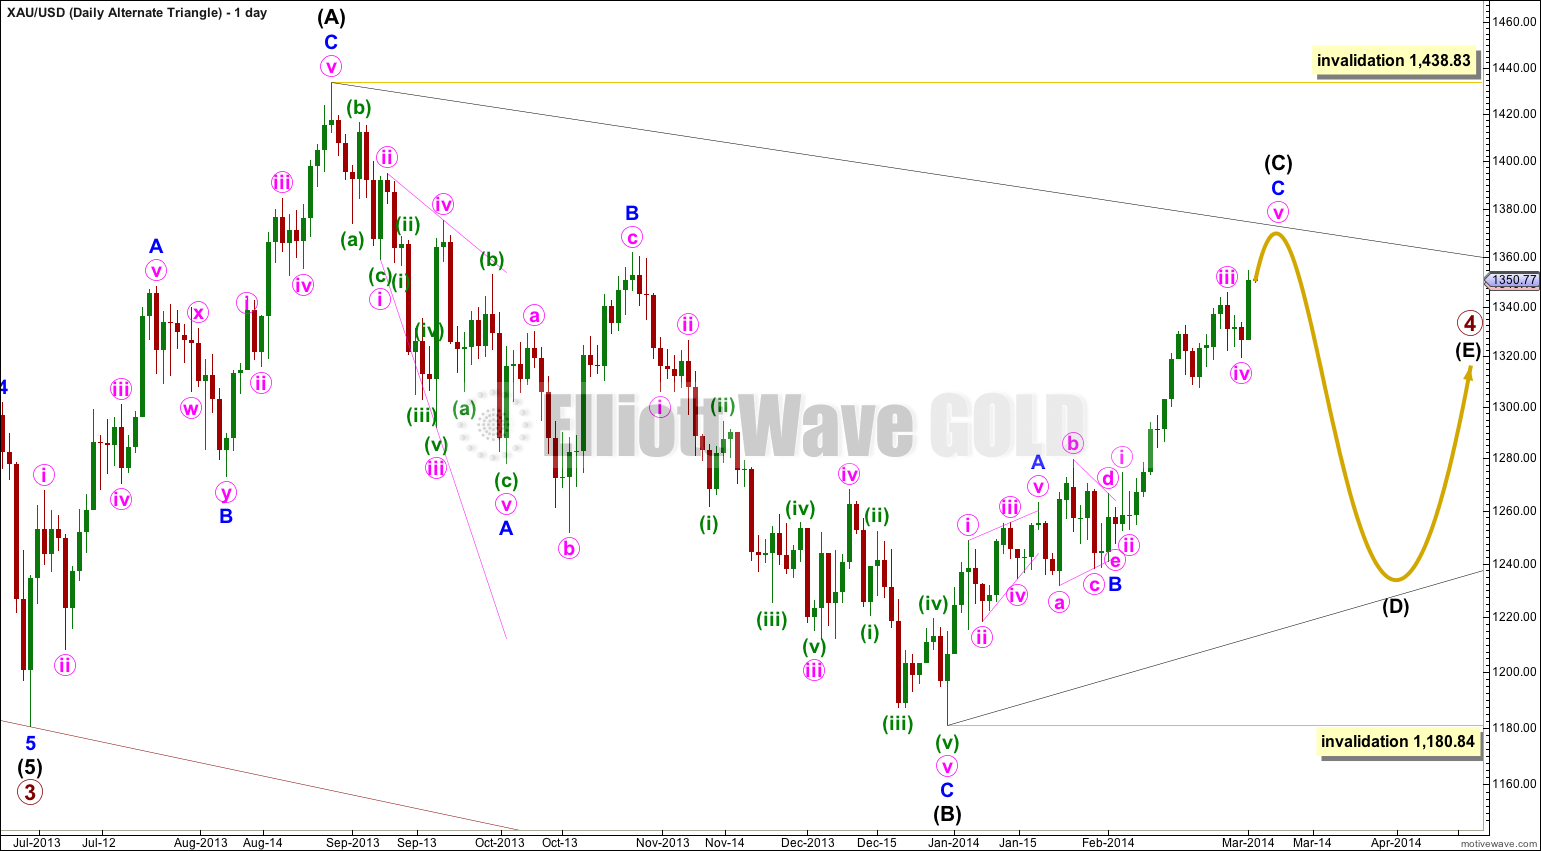
It is also possible that primary wave 4 may continue as a regular contracting (or barrier) triangle.
This wave count has a good probability. It does not diverge from the main wave count and it will not diverge for several weeks yet.
Triangles take up time and move price sideways. If primary wave 4 unfolds as a triangle then I would expect it to last months rather than weeks.