
Upwards movement remains below the invalidation point for the first wave count. Both wave counts remain valid and both remain mostly the same.
I do have a new third wave count for you today.
Every technical analysis method has its periods of uncertainty. Elliott wave is no different. I do not often publish many differing wave counts for you, but today I must.
To make today’s analysis clearer I will list pros and cons for each wave count.
And, as always, members should use their own technical analysis alongside this Elliott wave analysis to corroborate one wave count over the others.
Summary: The situation is still unclear. While price remains within the green channel on the daily chart we should assume that the trend remains the same, upwards.
This analysis is published about 04:45 p.m. EST. Click on charts to enlarge.
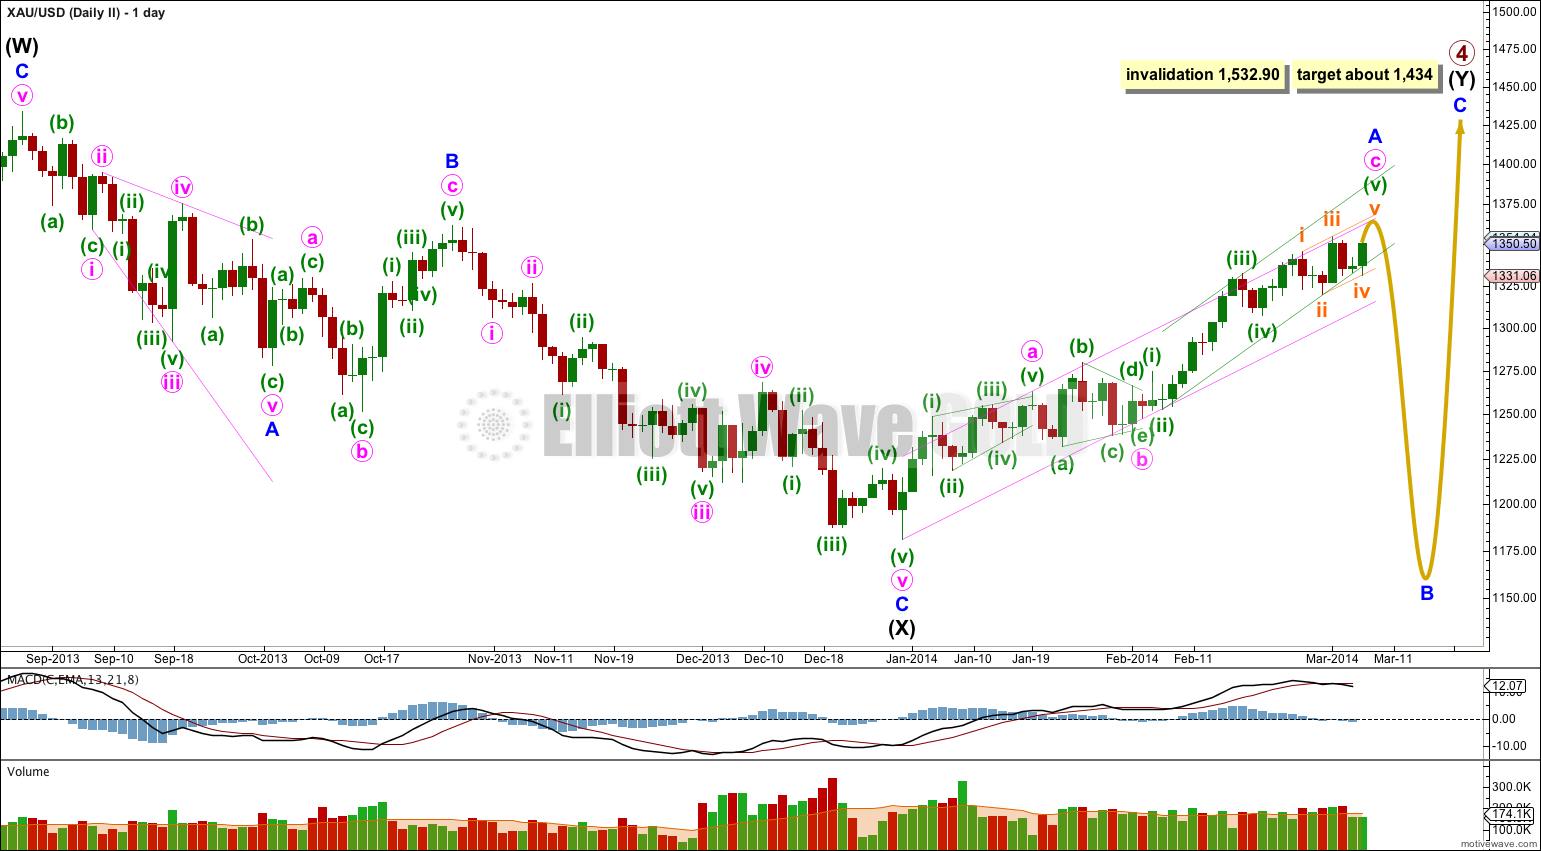
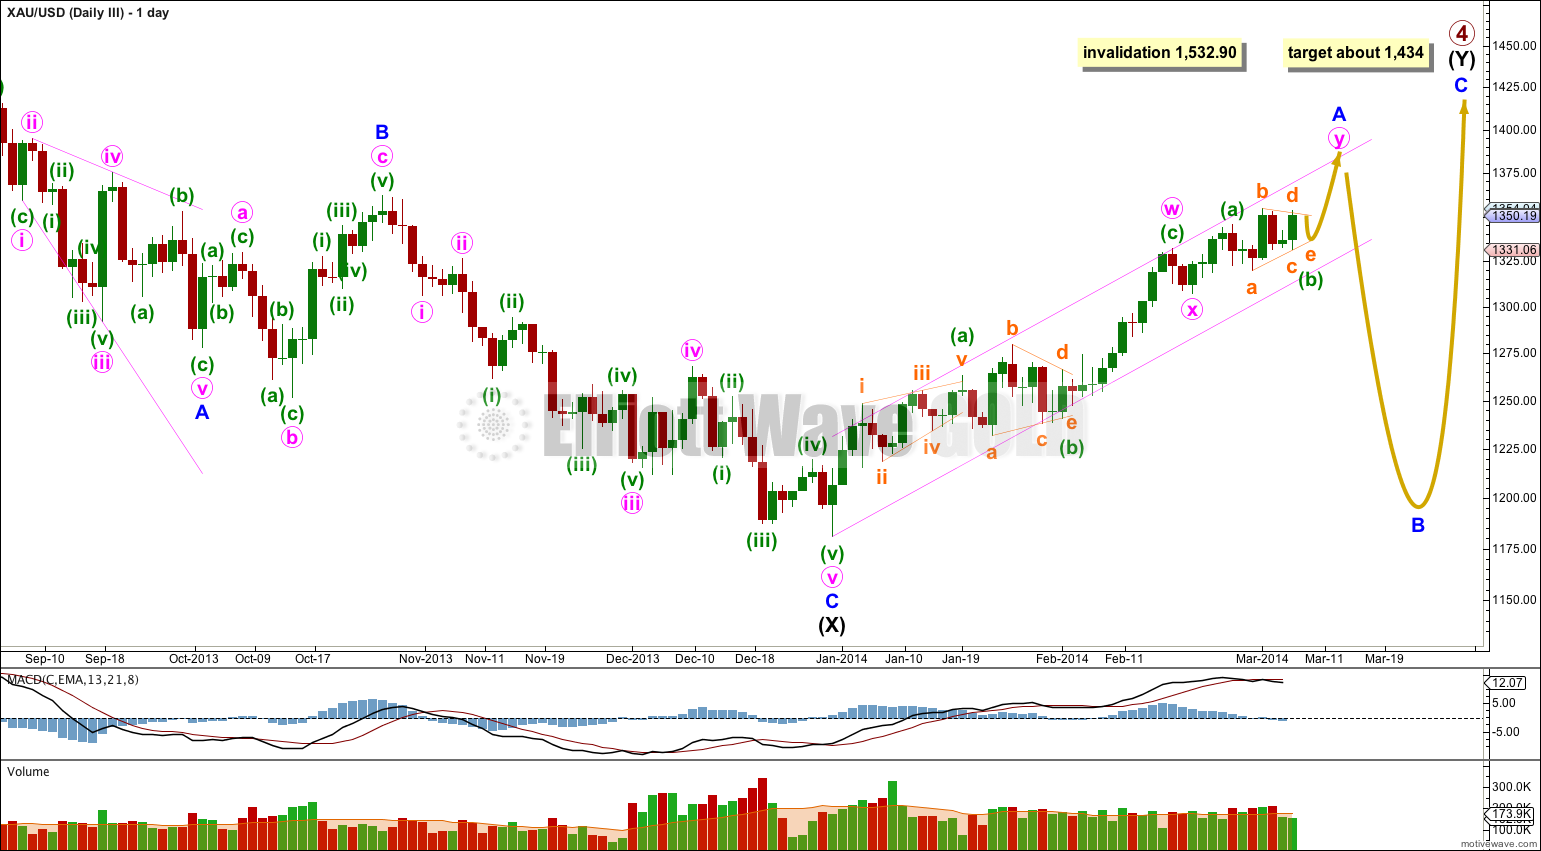
First Wave Count.
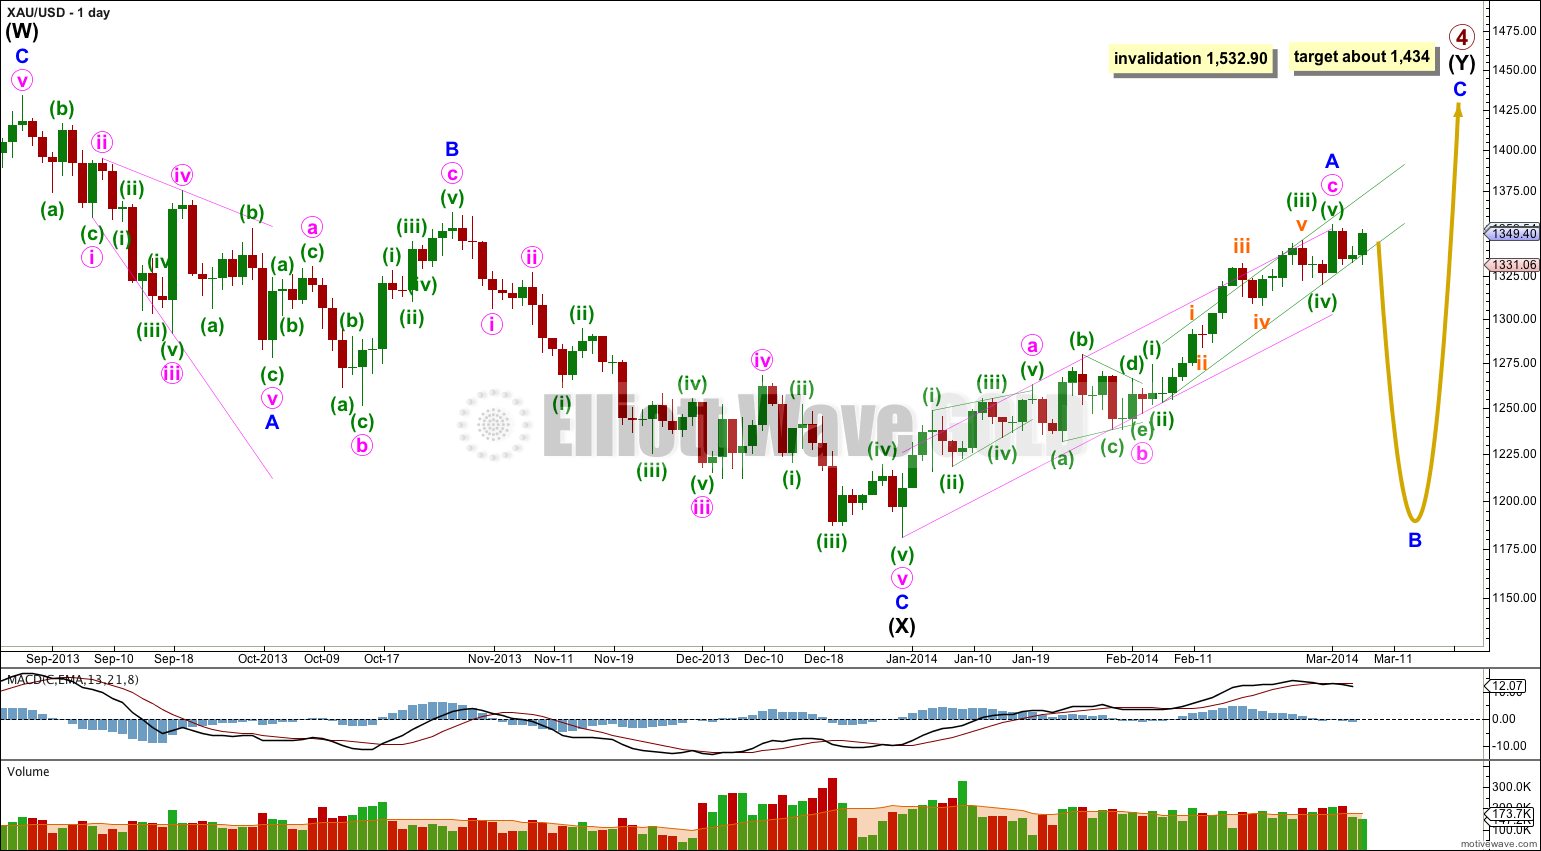
Gold is still within a large fourth wave correction at primary wave degree which is incomplete.
Primary wave 2 was a rare running flat. Primary wave 4 is unlikely to be a flat correction because it is likely to show structural alternation with primary wave 2.
The first upwards wave within primary wave 4 labeled here intermediate wave (W) subdivides as a three wave zigzag. Primary wave 4 cannot be an unfolding zigzag because the first wave within a zigzag, wave A, must subdivide as a five.
Primary wave 4 is unlikely to be completing as a double zigzag because intermediate wave (X) is a deep 99% correction of intermediate wave (W). Double zigzags commonly have shallow X waves because their purpose it to deepen a correction when the first zigzag does not move price deep enough.
Primary wave 4 is most likely to be completing as a double combination: zigzag – X – second structure. The second structure labeled intermediate wave (Y) may be either a flat or a triangle. For both these structures minor wave A must be a three, and is most likely to be a zigzag.
Minor wave A is either complete or close to completion. I want to see the green channel on the daily chart clearly breached before having any confidence in a trend change. While price remains within the green channel we may see new highs. With Thursday’s strong green candlestick I again have no preference for either wave count. All are equally valid. This is why I am naming them “first”, “second” and “third”, rather then main and alternates. The distinction is small but important.
Primary wave 4 may not move into primary wave 1 price territory. This wave count is invalidated with movement above 1,532.90.
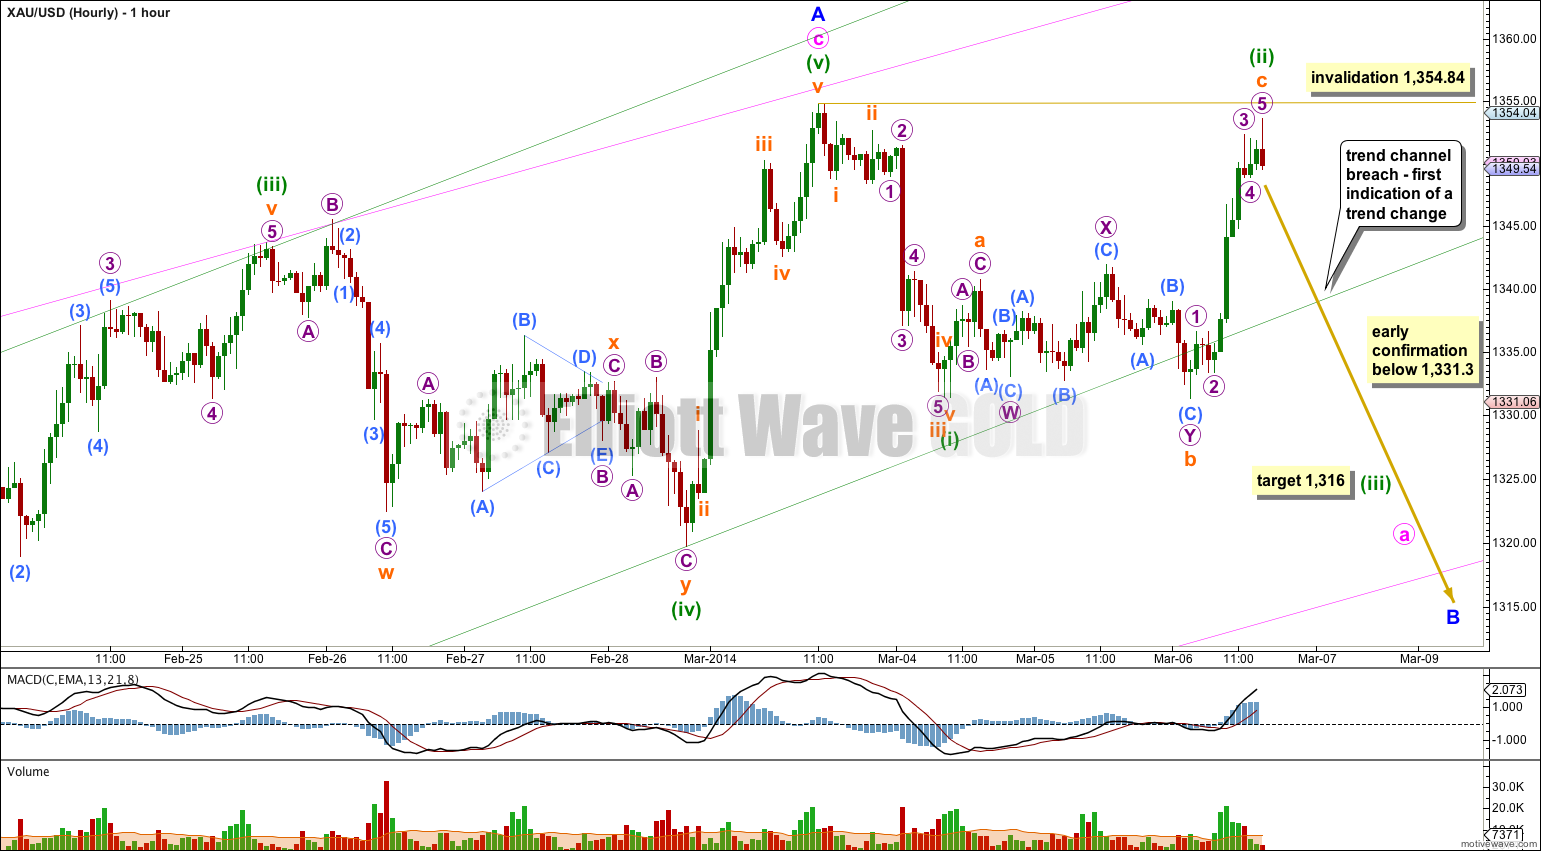
This main wave count sees minuette wave (iii) over at 1,343.35 and minor wave A may be complete. Upwards movement for Thursday may be a continuation of a second wave correction. There is almost no room left for upwards movement so for this first wave count upwards movement must be over here and a third wave down must begin to show increased downwards momentum.
I have moved the degree of labeling within minute wave a all up one degree today. Upwards movement for minuette wave (ii) shows clearly on the daily chart. If this wave count is correct then this upwards correction is unlikely to be at subminuette degree because those waves do not often show on the daily chart. At this stage it makes no difference to expected direction or targets.
Pros:
1. Ratios within minute wave c are: minuette wave (iii) has no Fibonacci ratio to minuette wave (i), and minuette wave (v) is just 0.60 longer than 0.382 the length of minuette wave (iii). Ratios within minuette wave (iii) are: subminuette wave iii is just 0.09 short of 1.618 the length of subminuette wave i, and subminuette wave v is just 1.12 longer than equality with subminuette wave i. These Fibonacci ratios are startlingly good, which is actually reasonably typical for Gold.
2. Minuette wave (iv) is seen as a double combination which has the best fit for this movement.
Cons:
1. On the daily chart minuette wave (iii) does not have the “right look”.
2. Within minor wave A there is no Fibonacci ratio between minute waves a and c.
3. Upwards movement labeled minuette wave (v) to end minor wave A looks best as a three, but this wave count sees it as a five.
At 1,316 minuette wave (iii) would reach 1.618 the length of minuette wave (i).
Movement below 1,331.3 would invalidate the second and third wave counts and provide a little confirmation that this first wave count may be correct. I would only have confidence in this first wave count and the target if we see a clear breach of the green channel on the DAILY chart.
Subminuette wave ii may not move beyond the start of subminuette wave i. This wave count is invalidated with movement above 1,354.84.
Second Wave Count.
I am considering this possibility mostly because of the overall look of minute wave c on the daily chart. I want to see minuette wave (iii) over at 1,332.28 because there it has the best look on the daily chart. The following overlapping movement may be an ending diagonal for minuette wave (v).
With this wave count the green channel does not have a good fit when it is drawn using either of Elliott’s techniques, so I have drawn it as a best fit here. The lower green trend line is the same for both daily wave counts.
This second wave count allows for one final upwards thrust to complete the structure for minor wave A.
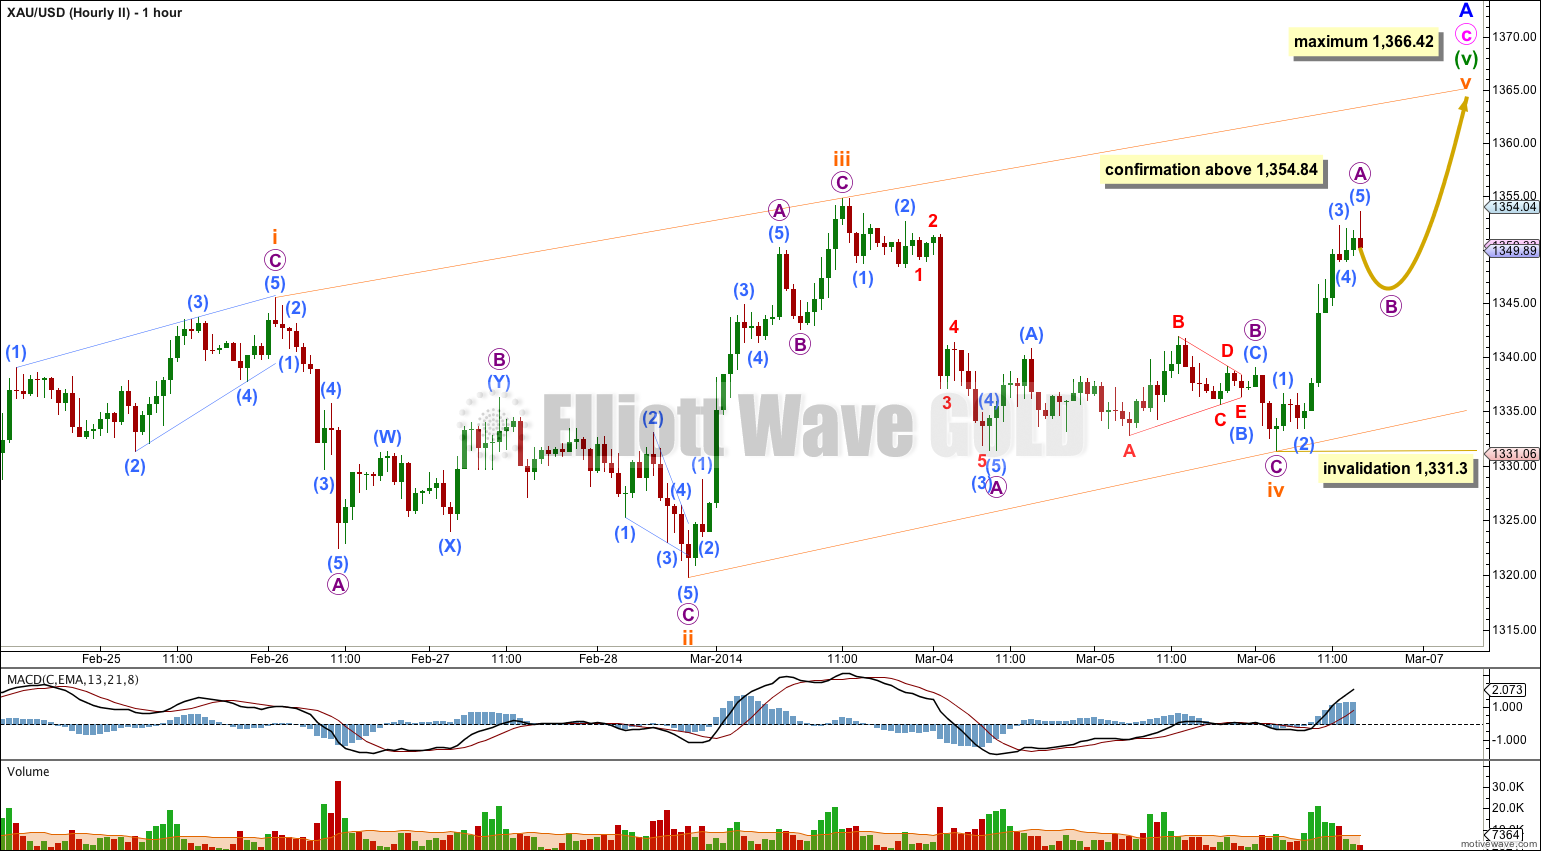
This wave count sees minuette wave (iii) over earlier.
Minuette wave (v) ending contracting diagonal is close to completion. The final fifth wave must subdivide as a zigzag, and only micro waves B and C are required to complete. The diagonal is contracting. Subminuette wave v may not be longer than equality with subminuette wave iii because a third wave may never be the shortest. The limit is at 1,366.42.
Pros:
1. Minuette wave (iii) now has a better look on the daily chart.
2. Upwards movement labeled subminuette wave iii within the diagonal is seen as a zigzag. This has the best fit.
Cons:
1. Minuette wave (iii) has no Fibonacci ratio to minuette wave (i).
2. Ratios within minuette wave (iii) are: subminuette wave iii has no Fibonacci ratio to subminuette wave i, and subminuette wave v is 3.95 longer than equality with subminuette wave i. The ratios here are not as good as the first wave count which reduces the probability of this second wave count.
3. Downwards movement labeled subminuette wave ii must be seen as a single zigzag. This does not have as good a fit as a double zigzag or double combination (as for the other two wave counts).
Within the zigzag of subminuette wave v micro wave B may not move beyond the start of micro wave A. This wave count is invalidated with movement below 1,331.3.
Third Wave Count.
Thanks to Bob for posting a GDX chart with this idea. Although the wave count on the GDX chart has a couple of problems (which I’ll point out if I have the time today to update GDX for you all) the idea is sound.
Minor wave A may be unfolding as a double zigzag. This is entirely possible if intermediate wave (Y) is either a flat correction or particularly a triangle.
Within the double zigzag the first zigzag for minute wave w is complete. The double is joined by a small three in the opposite direction labeled minute wave x. X waves within double zigzags are normally shallow because the purpose of double zigzags is to deepen a correction when the first zigzag does not move price deep enough. Although this small minute wave x is very small it looks reasonable for an X wave within a double zigzag.
The second zigzag of minute wave y is incomplete. Within it minuette wave (b) is an almost complete barrier triangle. This would expect minute wave (c) following it to be a short sharp upwards thrust, which may be equal in length to the widest part of the triangle which was 35.12.
This third wave count expects new highs and allows for more upwards movement than the second wave count.
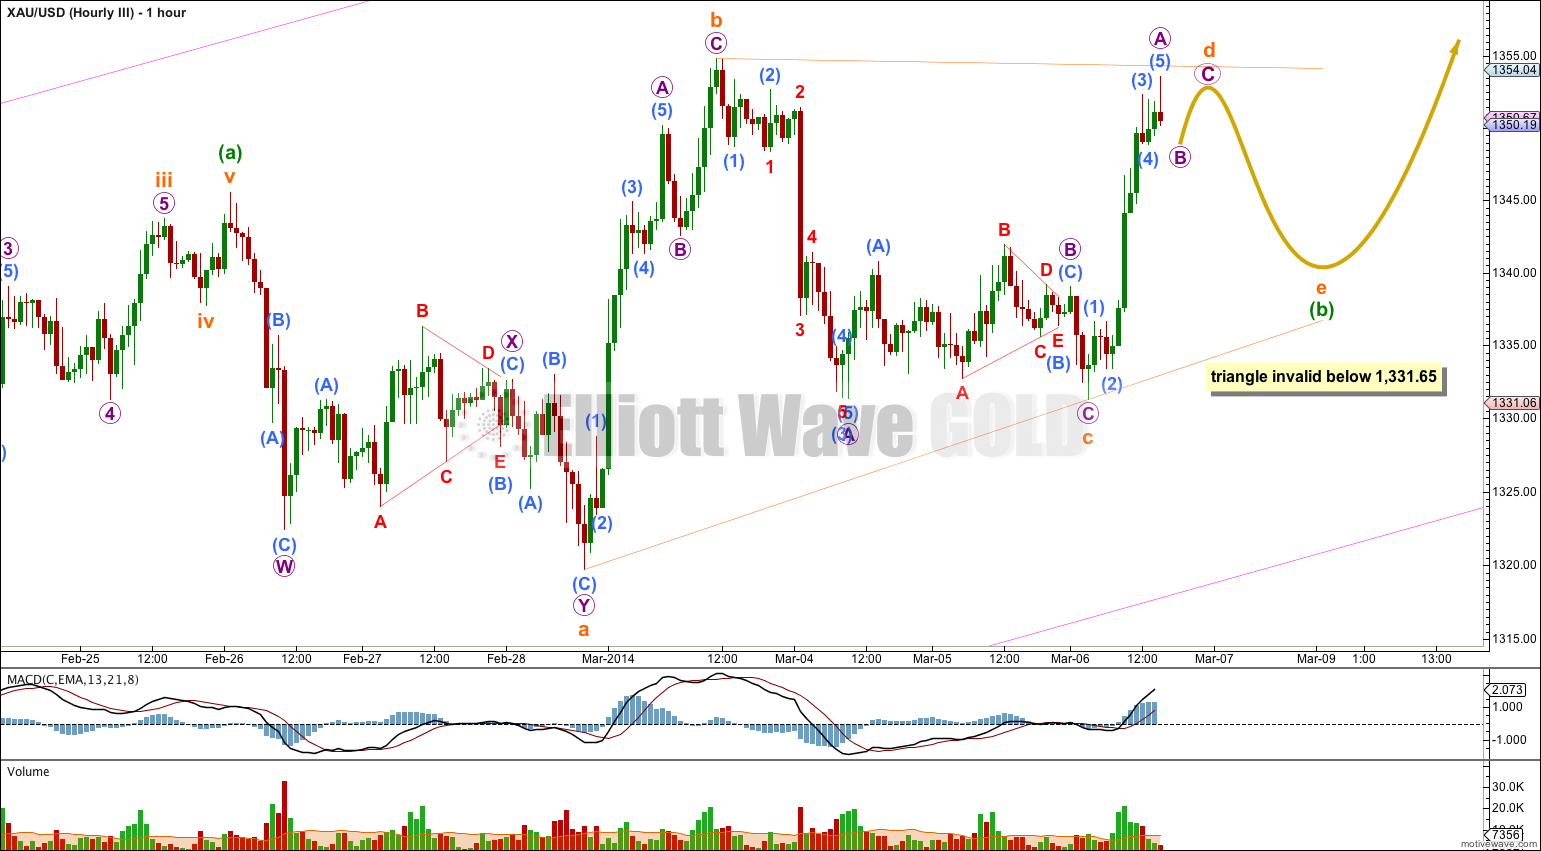
The triangle is most likely a barrier triangle because the B-D trend line is essentially flat. Within the barrier triangle subminuette wave d may end about the same level as subminuette wave b. In practice this means it may end slightly above 1,354.84 as long as the B-D trend line appears flat. Unfortunately this rule has a grey area as this is the only Elliott wave rule which is not black and white.
Within the triangle subminuette wave e downwards must subdivide as a zigzag. It may not move below the end of subminuette wave c. This wave count is invalidated with movement below 1,331.65.
Pros:
1. It has a very good look on the daily chart.
2. On the hourly chart so far all subdivisions fit perfectly: the problem of the downwards wave labeled here subminuette wave a is resolved, and also the problem of the upwards wave labeled subminuette wave b is resolved.
3. This wave count nicely explains the overlapping movement of the last few days.
Cons:
1. The triangle of the last few days for minuette wave (b) is not supported by MACD. Normally while triangles unfold MACD hovers about the zero line. Here it does not. Look at the two small triangles on this hourly chart and compare MACD at those points. See how it hovers about the zero line strongly? That is what it should look like for the larger triangle.
Alternate Daily Wave Count – Triangle.
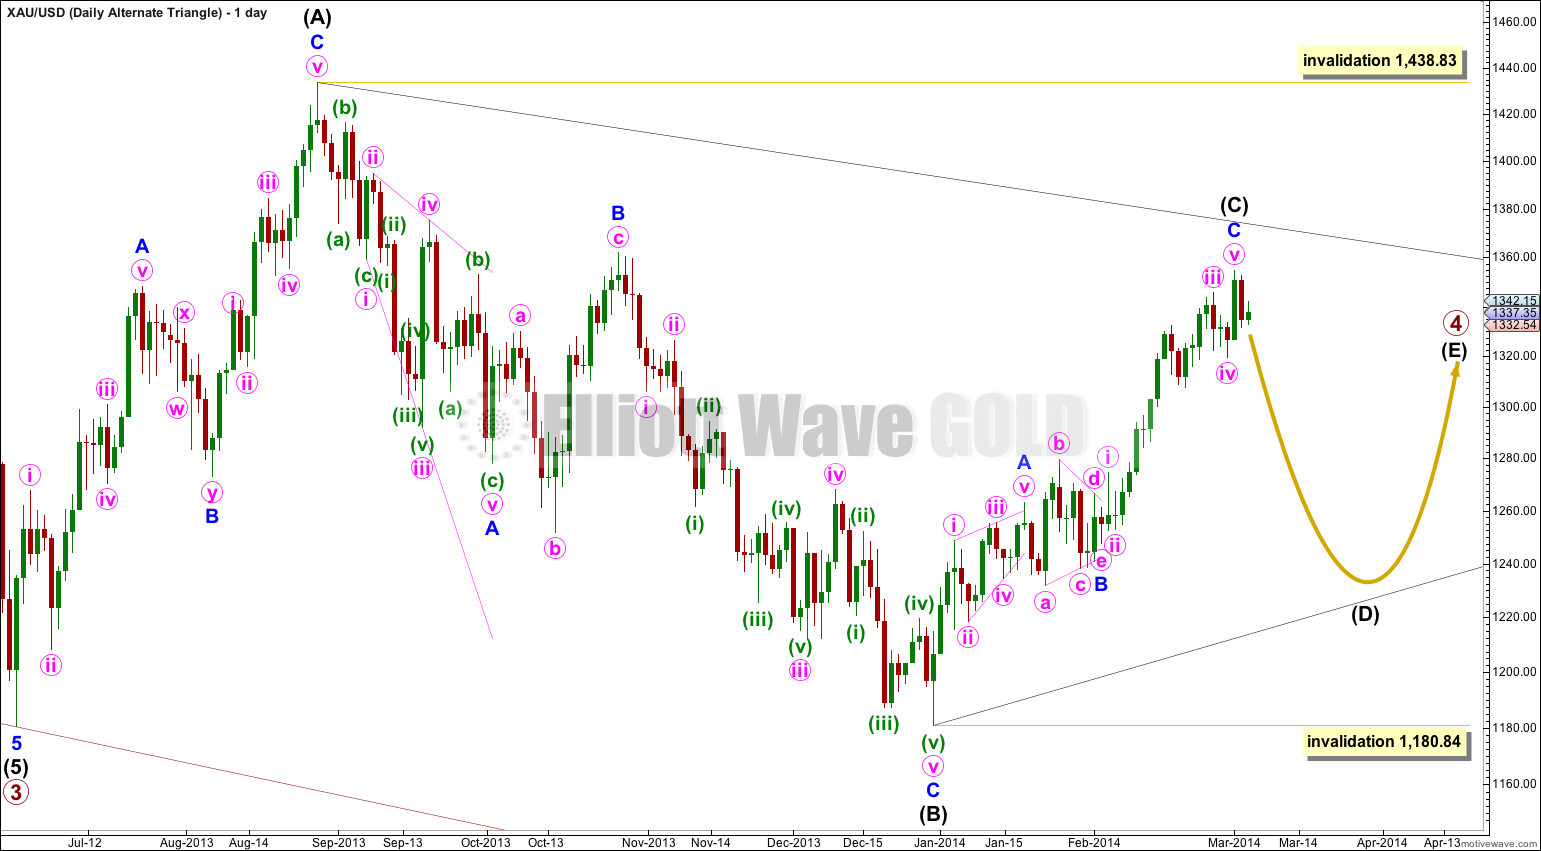
It is also possible that primary wave 4 may continue as a regular contracting (or barrier) triangle.
This wave count has a good probability. It does not diverge from the main wave count and it will not diverge for several weeks yet.
Triangles take up time and move price sideways. If primary wave 4 unfolds as a triangle then I would expect it to last months rather than weeks.
Wow! It looks like the second and third wave counts have been invalidated. However everytime gold sells off, buyers have been stepping in. The persistent selling never takes place. Could this be another leading diagonal for wave 1 down and the rebound is wave 2?
No, I don’t think so. The diagonal does not work anymore. The fourth wave would be longer than the second, but the third would be shorter than the first.
The third wave count works best with some adjustment.
Analysis is almost published.