
Further sideways movement indicates a nine wave triangle is unfolding. It looks incomplete. The confirmation and invalidation points can now be moved closer together, reducing risk and increasing reward.
Summary: A break below 1,283.43 would indicate Gold is breaking out of this sideways trend to the downside. Movement above 1,309.14 would indicate my wave count is wrong, and at that stage I would expect more upwards movement but not above 1,392.30. I expect it is most likely that early next week price will break out downwards, and when it does movement may be swift and strong.
This analysis is published about 02:10 a.m. EST. Click on charts to enlarge.
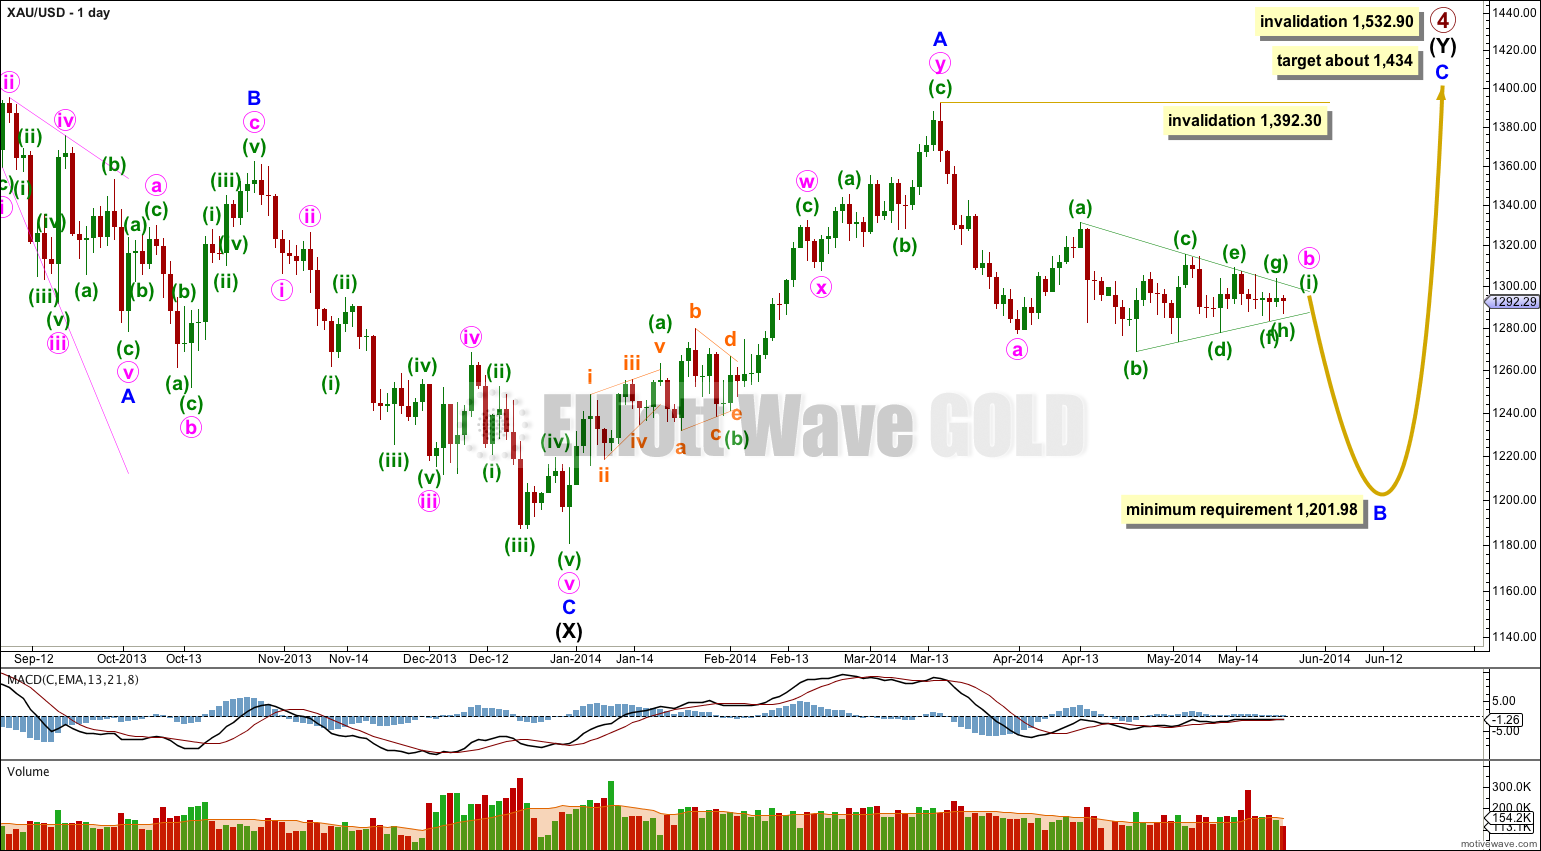
Gold is still within a large fourth wave correction at primary wave degree which is incomplete.
Primary wave 2 was a rare running flat. Primary wave 4 is unlikely to be a flat correction because it is likely to show structural alternation with primary wave 2.
Primary wave 4 is most likely to be completing as a double combination: zigzag – X – second structure. The second structure labeled intermediate wave (Y) is most likely to be a flat correction. Within the flat correction minor wave B must reach a minimum 90% the length of minor wave A at 1,201.98.
If downwards movement does not reach 1,201.98 or below then intermediate wave (Y) may not be a flat correction and may be a contracting triangle. I will keep this alternate possibility in mind as this next wave down unfolds. If it looks like a triangle may be forming I will again chart that possibility for you.
It remains possible that primary wave 4 in its entirety is a huge contracting triangle. If 1,201.98 is not met I would also consider this possibility.
Overall the structure for primary wave 4 should take up time and move price sideways, and the second structure should end about the same level as the first at 1,434. Primary wave 4 may not move into primary wave 1 price territory. This wave count is invalidated with movement above 1,532.90.
Within intermediate wave (Y) minor wave B downwards is an incomplete corrective structure, and at this stage the structure is most likely to be a single zigzag with a triangle for minute wave b which is very close to completion. When it is over I can calculate a target for the next wave down for you. I cannot do that today.
Minute wave b may not move beyond the start of minute wave a above 1,392.30.
Finally, today I have considered the possibility that when sideways movement is done price could break out to the upside. This is possible, but such a wave count has the wrong look and so I don’t want to publish it for you. It only works if minute wave b is a combination: zigzag – X (as a triangle) – wave Y yet to complete. I will only chart this possibility for you if it shows itself to be true, but in my experience with Gold it has structures which look very typical. This idea does not look typical.
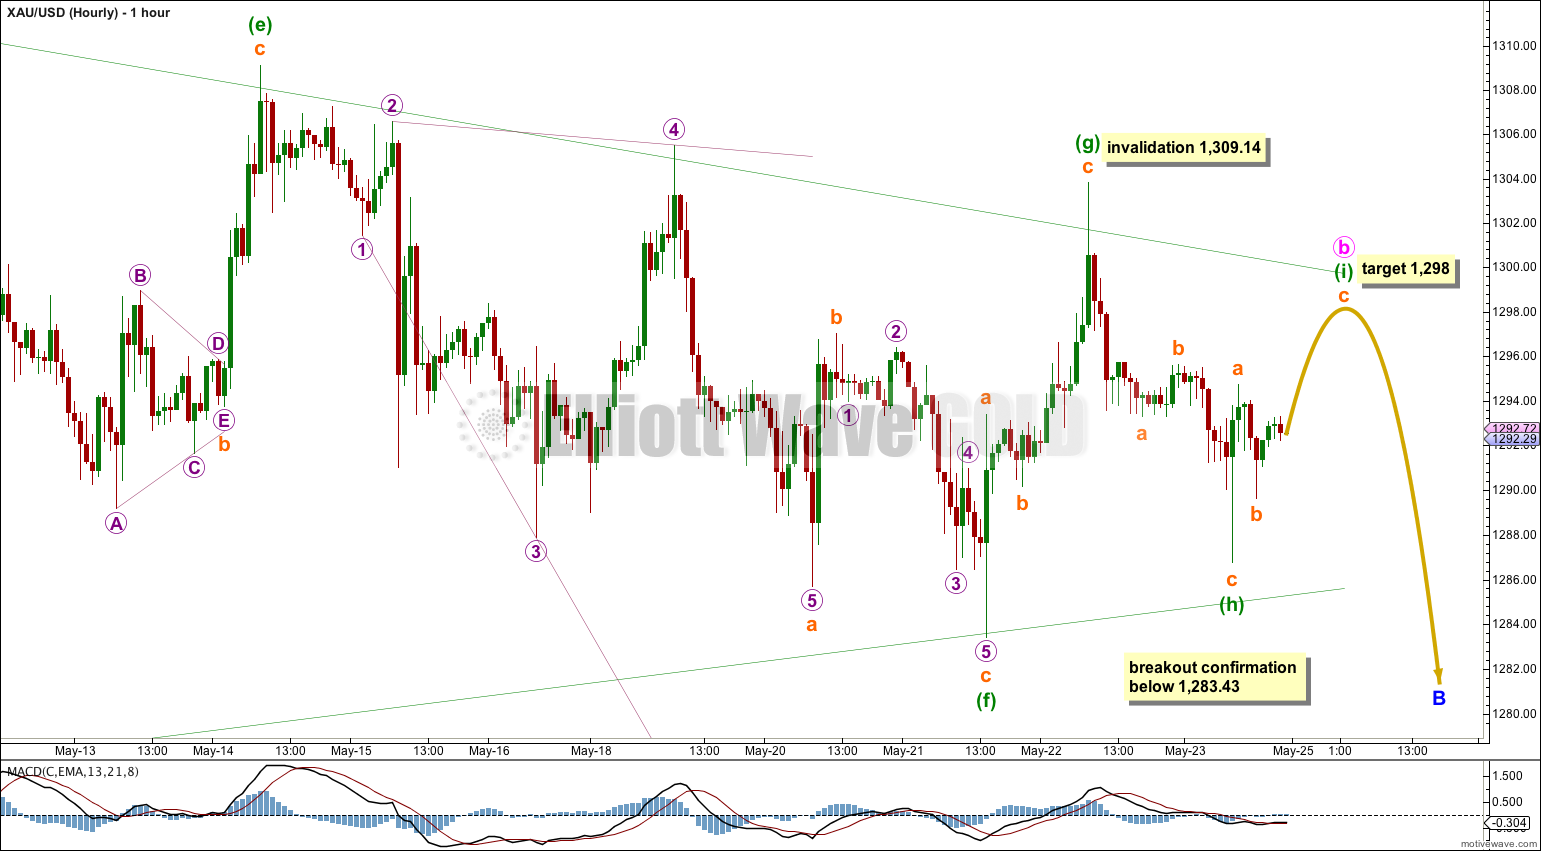
Further sideways movement with flat momentum indicates the triangle is incomplete. It fits now nicely as a nine wave triangle, which is rare, but that’s how it looks.
Within the triangle minuette wave (g) is most likely complete because it has slightly overshot the (a) – (c) trend line. The invalidation point is set conservatively though; if minuette wave (g) moves higher it may not move beyond the end of minuette wave (e) at 1,309.14.
Minuette wave (h) is a complete zigzag. Minuette wave (i) may only subdivide as a zigzag. At 1,298 subminuette wave c within it would reach equality in length with subminuette wave a. This would see the final wave of the triangle fall short of the (a) – (c) trend line, which is most common. Alternately it may overshoot the (a) – (c) trend line.
Minuette wave (h) may not move beyond the end of minuette wave (f) at 1,283.43. Movement below 1,283.43 would indicate the triangle is over and price is breaking out to the downside.
Overall triangles take up time and move price sideways. That is their purpose and they test our patience. When they are finally complete price normally moves swiftly in the direction of the breakout, which is the same direction as price entered the triangle (in Elliott wave they are continuation patterns only).
We may see the breakout early next week, and it may come quite quickly now as this structure is so close to completion.
Monday is Memorial Day in the United States, the NYSE is closed.
the invalidation point is the end of (e), not (g).
I realise now that the position of the marker could confuse the issue.
I’ve determined the invalidation point by considering the possibility that (g) may not be over and could continue further.
Holiday turns “I” into a triangle? – Not sure how we are going to reach “e” in GDX – gold is trading into a needle point. …Interesting stuff.
I see what you mean “g” invalidation is 1309.14. Ignore last post.
Good luck Lara .
Strange, I’m only seeing 1303.5 as the maximum limit for green G on barcharts.com. I would assume this is important for “I’s” invalidation point. Something to remain cautious about?
Thanks Lara! I hope we aren’t burned by an upside breakout. USD supports the breakdown, but something happening in Ukraine could ignite an upside breakout. I get very nervous when it looks so obvious.
Enjoy your weekend!
I too hope that doesn’t happen.
But you know that sometimes I’m wrong. I could be wrong this time.
If price breaks above 1,309.14 then my wave count is wrong and price should continue to rise from there.
Hope you take & enjoy a holiday weekend for once. Everyone needs an occasional break to “recharge” and you deserve it. Meanwhile there will be nothing new in gold until after this tightening coil breaks. See you on tuesday.