
With markets closed in the US for Memorial Day Gold has had a very quiet day, completing a small B wave triangle. The wave count remains the same.
Summary: I expect to see a break to the downside by the middle of this week. Movement below 1,283.43 would indicate a breakout to the downside. Movement above 1,309.14 would invalidate the main wave count and confirm the alternate published today, which would indicate a breakout to the upside.
This analysis is published about 08:40 p.m. EST. Click on charts to enlarge.
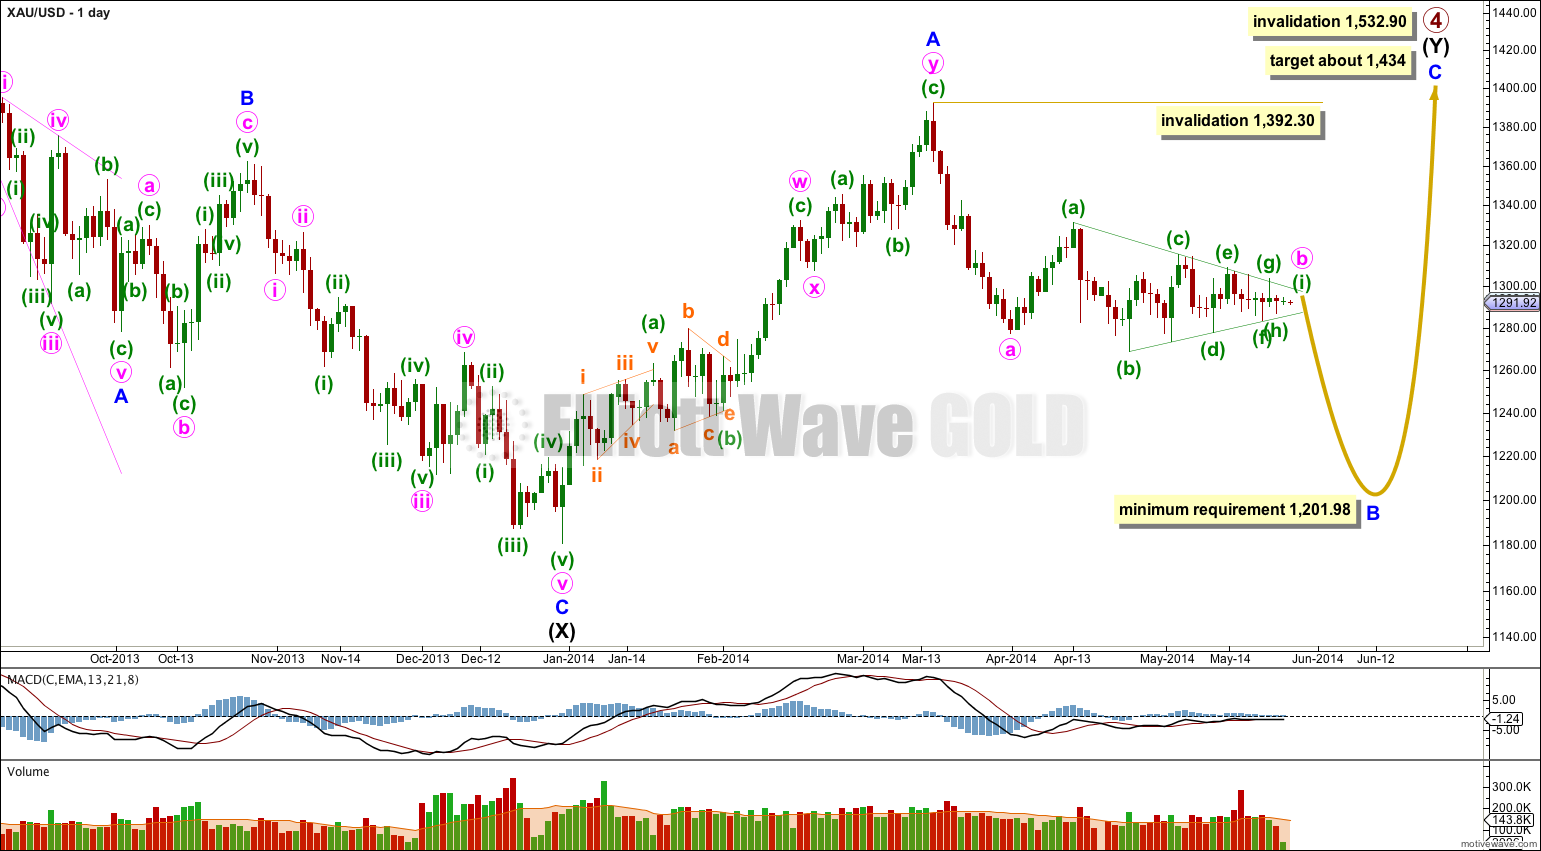
Gold is still within a large fourth wave correction at primary wave degree which is incomplete.
Primary wave 2 was a rare running flat. Primary wave 4 is unlikely to be a flat correction because it is likely to show structural alternation with primary wave 2.
Primary wave 4 is most likely to be completing as a double combination: zigzag – X – second structure. The second structure labeled intermediate wave (Y) is most likely to be a flat correction. Within the flat correction minor wave B must reach a minimum 90% the length of minor wave A at 1,201.98.
If downwards movement does not reach 1,201.98 or below then intermediate wave (Y) may not be a flat correction and may be a contracting triangle. I will keep this alternate possibility in mind as this next wave down unfolds. If it looks like a triangle may be forming I will again chart that possibility for you.
It remains possible that primary wave 4 in its entirety is a huge contracting triangle. If 1,201.98 is not met I would also consider this possibility.
Overall the structure for primary wave 4 should take up time and move price sideways, and the second structure should end about the same level as the first at 1,434. Primary wave 4 may not move into primary wave 1 price territory. This wave count is invalidated with movement above 1,532.90.
Within intermediate wave (Y) minor wave B downwards is an incomplete corrective structure, and at this stage the structure is most likely to be a single zigzag with a triangle for minute wave b which is very close to completion. When it is over I can calculate a target for the next wave down for you. I cannot do that today.
Minute wave b may not move beyond the start of minute wave a above 1,392.30.
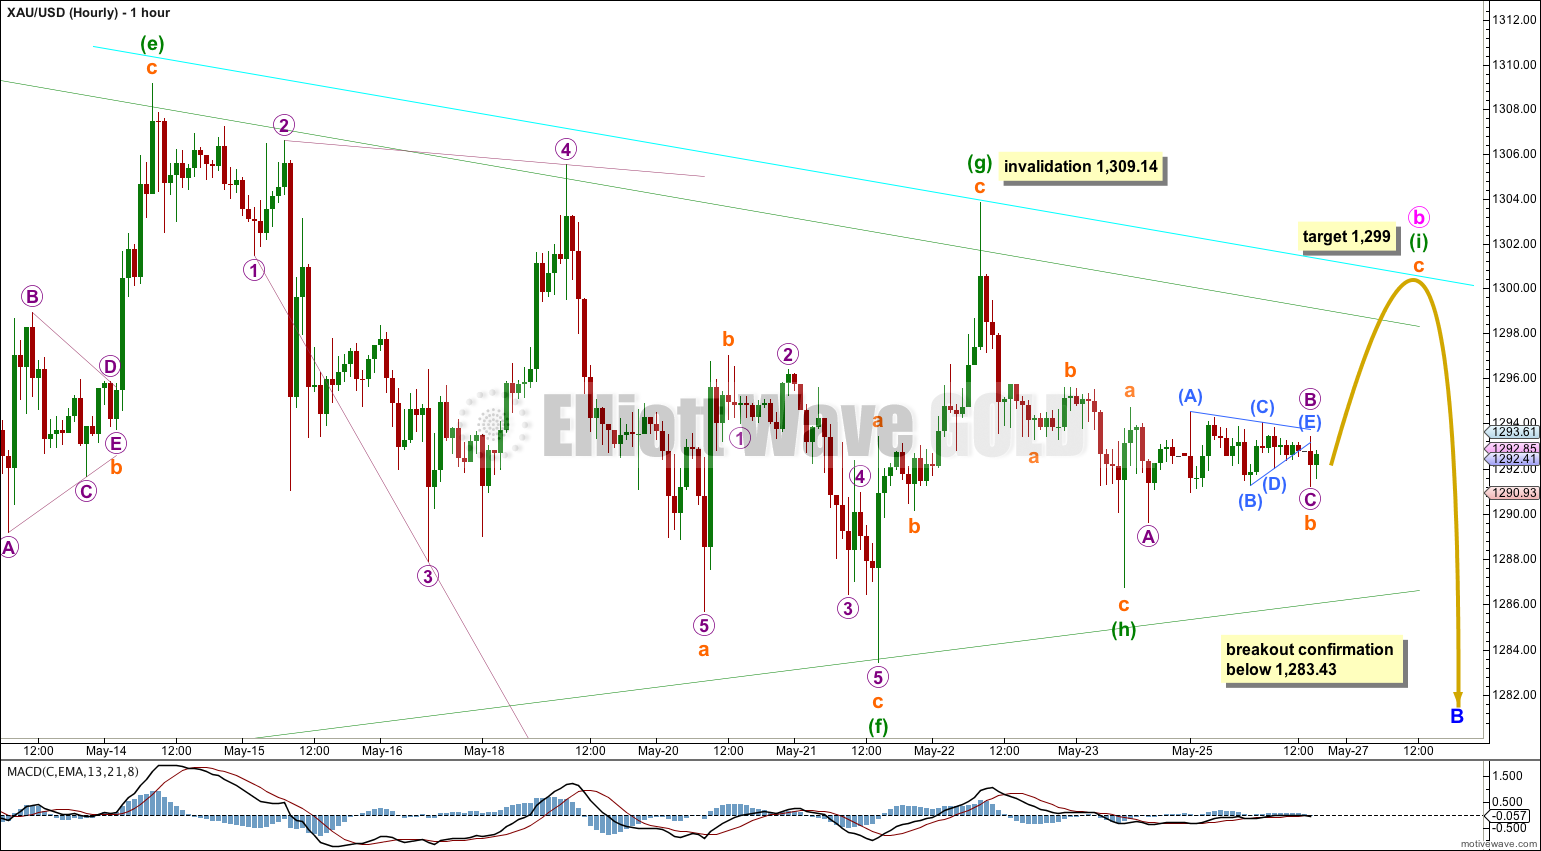
Sideways movement fits as continuation of subminuette wave b, with a small triangle for micro wave B within it.
At 1,299 subminuette wave c would reach equality in length with subminuette wave a. Subminuette wave c may last a few hours, and possibly up to one day. This target is based upon subminuette wave c beginning at 1,291.19, but if price moves below this point before moving upwards then this target would need to be recalculated. Micro wave C within subminuette wave b could move lower, and this is reasonably likely as if it is over here it is truncated.
When minuette wave (i) is a completed zigzag then the entire triangle structure would be complete. Often movements out of triangles are very swift and sharp. The downwards breakout may happen quickly when it finally arrives.
Minuette wave (h) may not move beyond the end of minuette wave (f) at 1,283.43. Movement below 1,283.43 would confirm that minuette wave (h) must be complete.
Movement below the lower (b) – (d) trend line of the triangle would also provide an indication of a downwards breakout.
Minuette wave (g) may mot move above minuette wave (e) at 1,309.14. Any movement above this point would invalidate this main wave count and confirm the alternate below. At that stage the breakout would be confirmed as upwards.
I have created a parallel copy of the upper (a) – (c) trend line of the triangle and pushed it upwards to sit on the high of minuette wave (g). Minuette wave (i) may either fall short of the (a) – (c) trend line, or it may find resistance at the upper aqua blue trend line.
Alternate Wave Count.
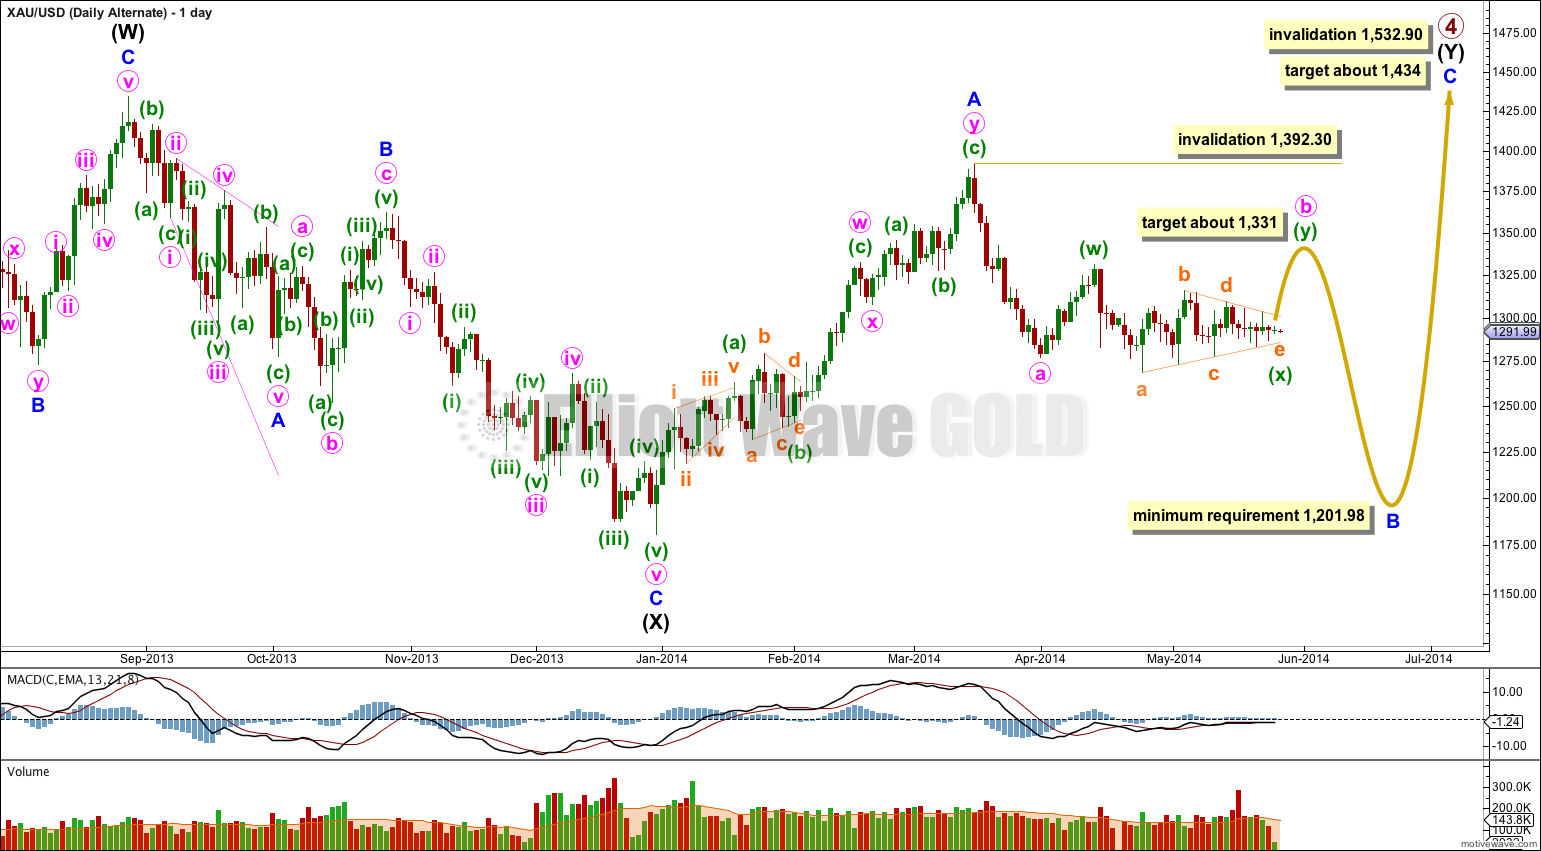
If price breaks above 1,309.14 this is the wave count I would use.
This wave count has a very low probability. However, I want to consider all possibilities no matter how unlikely so that we are prepared if my main wave count is wrong.
It is possible that minute wave b is a double combination: zigzag – X – second structure to complete.
Minuette wave (w) is a zigzag. Minuette wave (x) joining the two structures in the double may be a completed contracting regular triangle.
Because minuette wave (x) is very deep minute wave b would more likely be a double combination rather than a double zigzag. Combinations take up time and move price sideways and they normally have deep X waves. Double zigzags normally have a clear slope against the main trend direction, they do not move sideways, and their X waves are normally shallow and can often be brief.
Minuette wave (y) should unfold as a flat correction, which may be fairly time consuming. If it had the same duration as minuette wave (w) it would last nine days. It would most likely end about the same level as minuette wave (w) at 1,331.
X waves are almost always zigzags and it is unusual to see an X wave as a very time consuming triangle. This reduces the probability of this wave count.
This wave count seems to be trying to ignore the full extent of the triangle. Removing the first portion and seeing it as a separate structure for minuette wave (w) does not have the right look. This reduces the probability of this wave count.
This wave count sees minute wave b as incomplete, to last another nine or so days. This would see minute wave b even more out of proportion to minute wave a. This further reduces the probability of this wave count.
Minute wave b may not move beyond the start of minute wave a at 1,392.30.
Hi everyone !
I had a spike yesterday that reached 1303.95 on Metatrader that could explain the end of wave (i) of the main wave account if the 1286 breaks below.
Yeah, i see on netdania the minutte wave (i) 1301 appears on 1:00 last night Hong Kong time, but right now even the price breaks the b d channel line, the momemtum seems looks still very weak, it may because still too early 15:00. I am afraid the breakthrough need to wait until next month start, all the present month option will be expired