
I had expected to see a green candlestick for Thursday’s session, but price has moved a little lower. I have two wave counts for you today.
Summary: The second wave correction still must complete. It has most likely begun. I will expect a green candlestick for Friday’s and / or Monday’s sessions.
This analysis is published about 06:23 p.m. EST. Click on charts to enlarge.
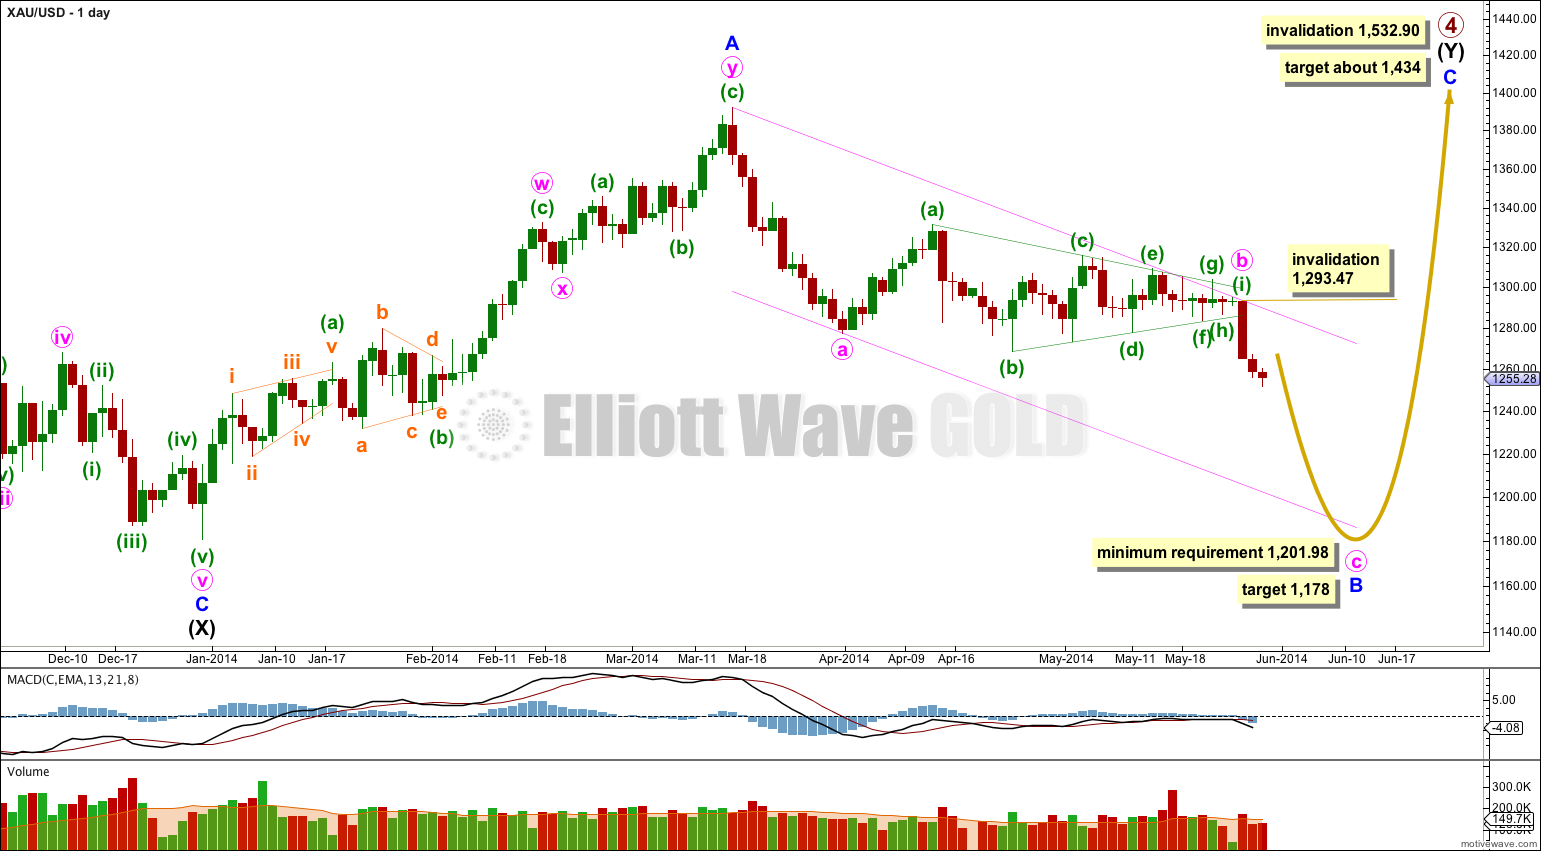
Gold is still within a large fourth wave correction at primary wave degree which is incomplete.
Primary wave 2 was a rare running flat. Primary wave 4 is unlikely to be a flat correction because it is likely to show structural alternation with primary wave 2.
Primary wave 4 is most likely to be completing as a double combination: zigzag – X – second structure. The second structure labeled intermediate wave (Y) is most likely to be a flat correction. Within the flat correction minor wave B must reach a minimum 90% the length of minor wave A at 1,201.98.
If downwards movement does not reach 1,201.98 or below then intermediate wave (Y) may not be a flat correction and may be a contracting triangle. I will keep this alternate possibility in mind as this next wave down unfolds. If it looks like a triangle may be forming I will again chart that possibility for you.
It remains possible that primary wave 4 in its entirety is a huge contracting triangle. I will again publish this idea daily for you from today onwards.
Overall the structure for primary wave 4 should take up time and move price sideways, and the second structure should end about the same level as the first at 1,434. Primary wave 4 may not move into primary wave 1 price territory. This wave count is invalidated with movement above 1,532.90.
Within intermediate wave (Y) minor wave B downwards is an incomplete corrective structure, and at this stage the structure is most likely to be a single zigzag with a triangle for minute wave b which is now complete. At 1,178 minute wave c would reach equality in length with minute wave a. This would see minor wave B 101% the length of minor wave A and so intermediate wave (Y) would be a regular flat correction.
Within the triangle of minute wave b the percentage retracements are: minuette wave (b) is 116% of minuette wave (a), minuette wave (c) is 75% of minuette wave (b), minuette wave (d) is 81% of minuette wave (c), minuette wave (e) is 83% of minuette wave (d), minuette wave (f) is 81% of minuette wave (e), minuette wave (g) is 79% of minuette wave (f), minuette wavwe (h) is 84% of minuette wave (g), and minuette wave (i) is 39% of minuette wave (h).
I have drawn a channel about minor wave B downwards: draw the first trend line from the start of minute wave a to the end of minute wave b, then place a parallel copy upon the end of minute wave a. I will expect downward movement to find support at the lower end of this channel due to this being the most common place for minute wave c to end.
Within minute wave c no second wave correction may move beyond the start of its first wave above 1,293.47. If minute wave c reaches equality in duration with minute wave a it will end in another ten days.
Main Hourly Wave Count.
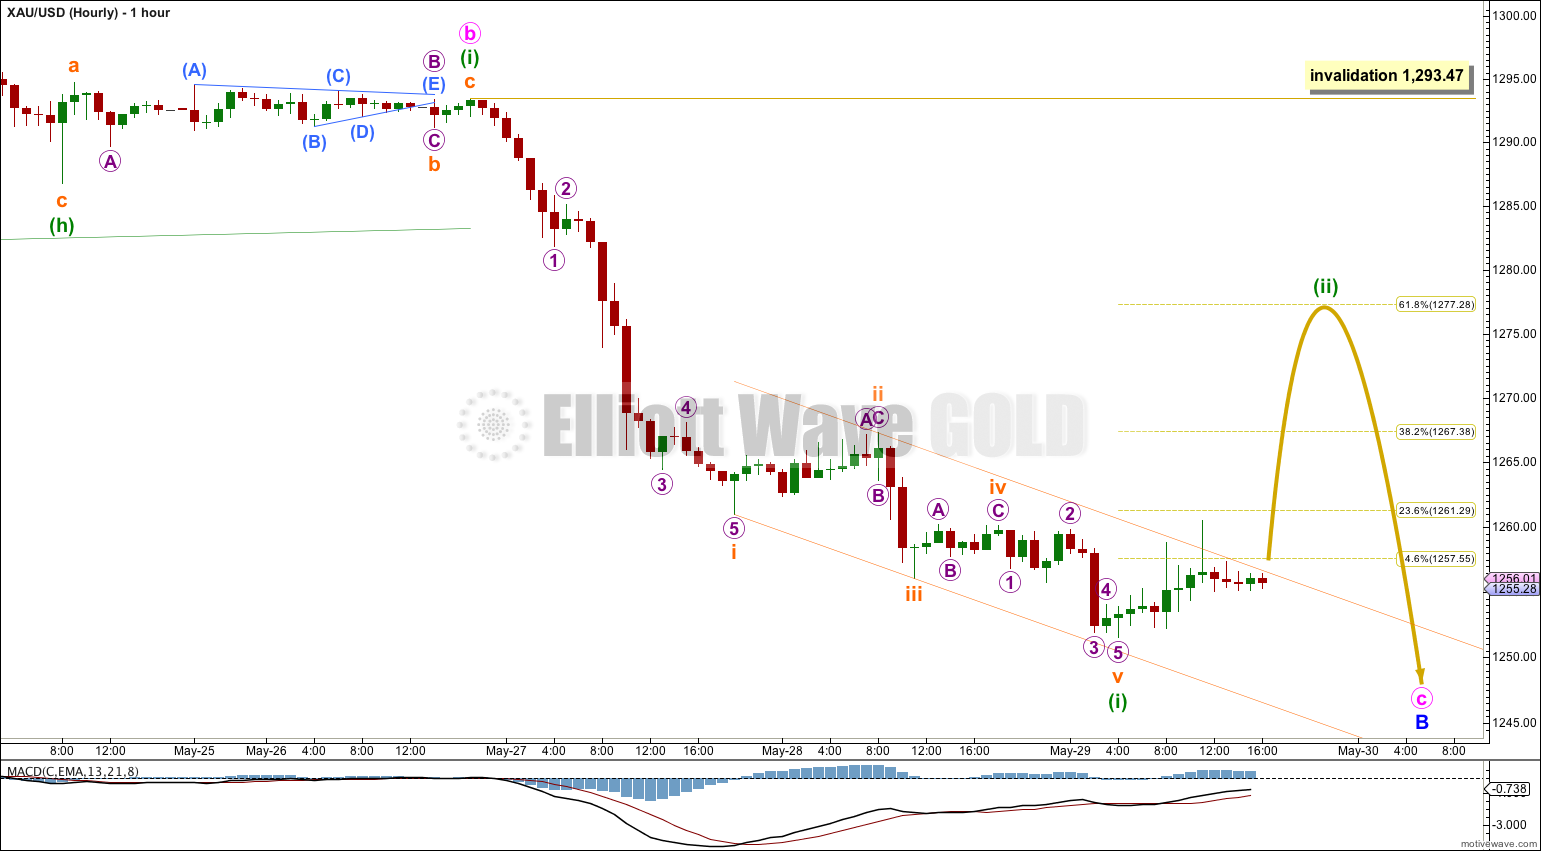
Further downwards movement is very difficult to analyse. I have considered several possibilities and discarded those which will not fit. Neither of the two wave counts I have today have a very typical look, and neither are a perfect fit, but this main wave count is the best of the bunch.
Minuette wave (i) may have just ended as an impulse with a strong extended first wave.
There are no adequate Fibonacci ratios between subminuette waves i, iii and v within minuette wave (i).
Subminuette wave iii shows weaker momentum than subminuette wave i. Mainly for this reason I am considering the alternate below.
I have used Elliott’s first technique to draw a channel about minuette wave (i): draw the first trend line from the lows labeled subminuette waves i to iii, then place a parallel copy upon the high labeled subminuette wave ii. When this channel is clearly breached by upwards movement then we shall have confirmation that minuette wave (i) is over and minuette wave (ii) is underway.
I will use the Fibonacci ratios of minuette wave (i) as targets for minuette wave (ii) to end, favouring the 0.618 Fibonacci ratio at 1,277.28.
Minuette wave (ii) may not move beyond the start of minuette wave (i) above 1,293.47.
Alternate Hourly Wave Count.
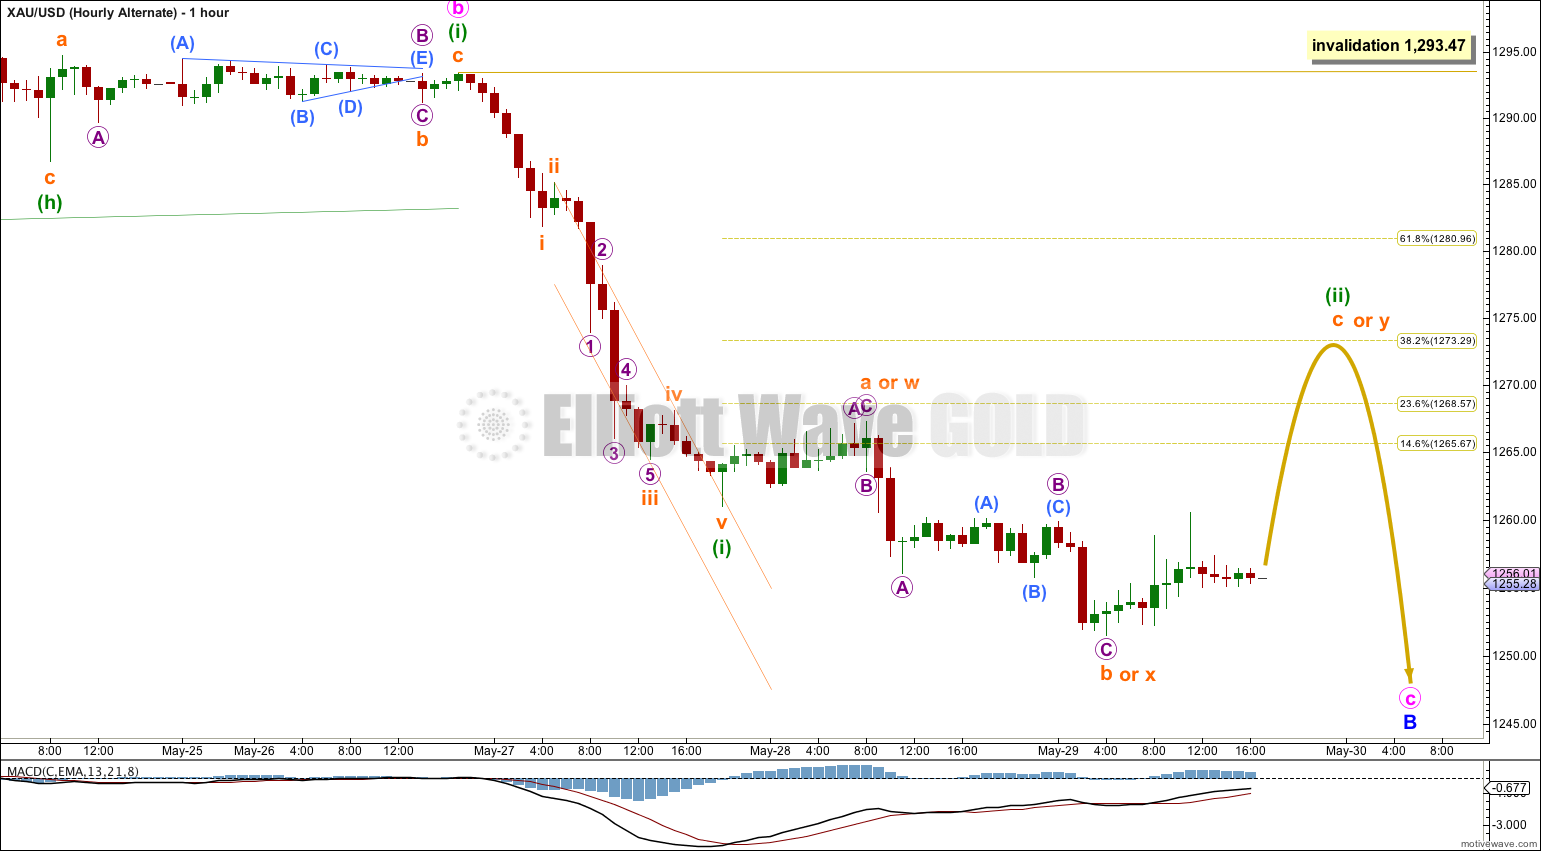
I want to continue to see minuette wave (i) ending at 1,260.98 because that has a typical look for the impulse, and it fits nicely with momentum. Here subminuette wave iii within minuette wave (i) has the strongest downwards momentum.
The problem then becomes the structure within minuette wave (ii). This structure must be incomplete because it quite simply does not fit as the start of a third wave down. Therefore, it must be part of the prior correction.
If minuette wave (ii) is continuing then it is either a flat or a combination. For both of these options subminuette wave b of a flat (or x of a combination) is now 2.5 times the length of subminuette wave a of the flat (or w of a combination). This is highly unusual and gives this wave count an odd look. It is unusual enough to reduce the probability of this wave count significantly to an alternate.
If minuette wave (ii) is completing as a flat correction then within it subminuette wave c would be extremely likely to make at least a slight new high above the end of subminuette wave a at 1.267.29 to avoid a truncation and a rare running flat.
If minuette wave (ii) is completing as a combination correction then subminuette wave y would be most likely to end about the same level as subminuette wave w at 1,267.29.
I would use the Fibonacci ratios of minuette wave (i) as targets for minuette wave (ii) to end, favouring the 0.382 Fibonacci ratio at 1,273.29.
Minuette wave (ii) may not move beyond the start of minuette wave (i) at 1,293.47.
Daily – Triangle.
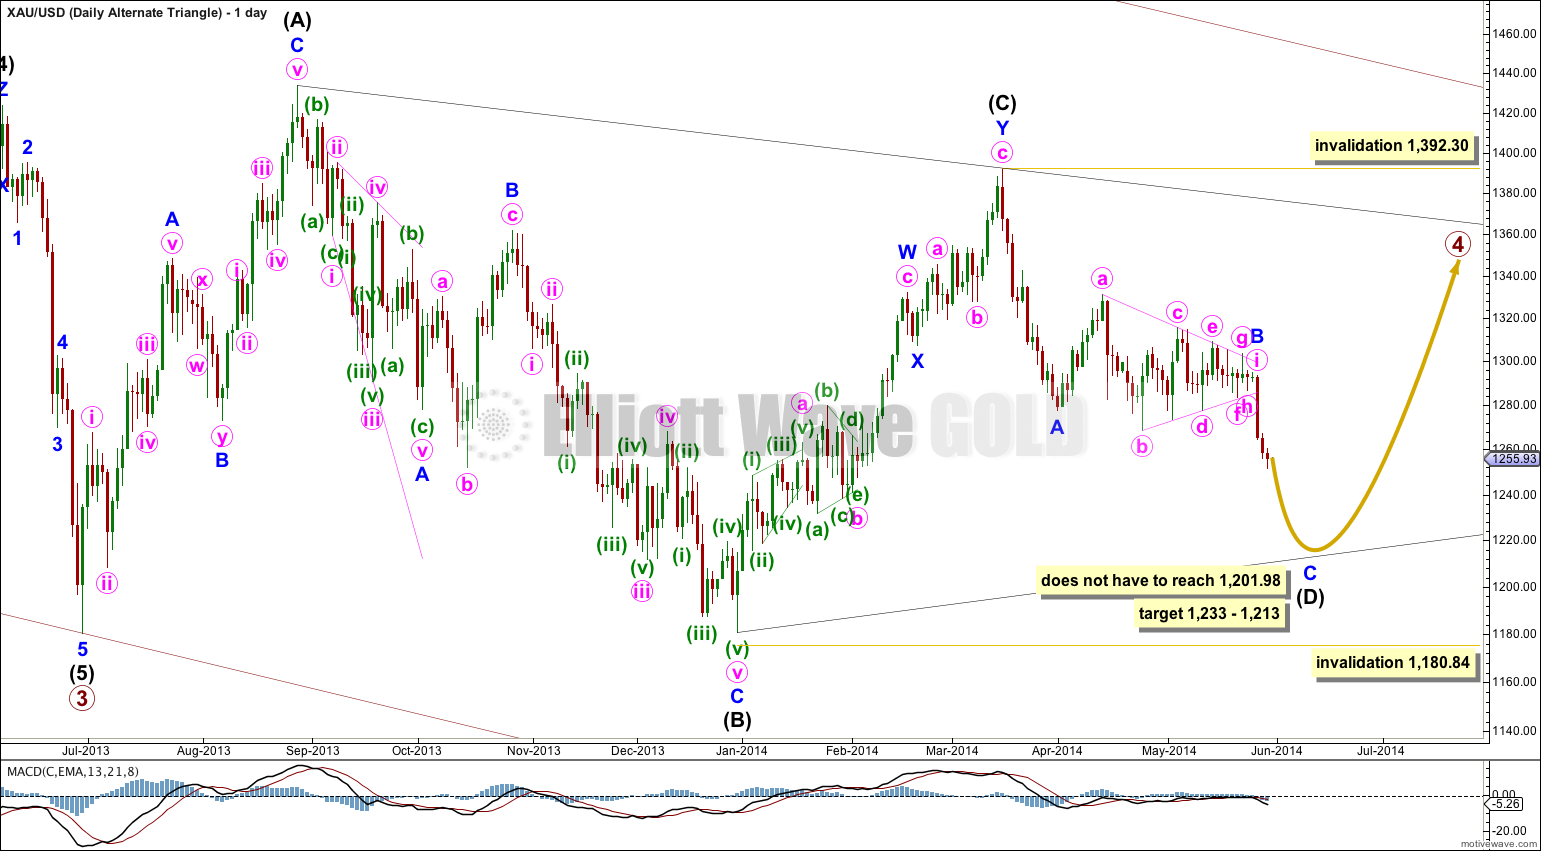
I have published this before and in the interests of clarity at this crucial stage in the bigger picture, I will again publish it daily.
It remains possible that primary wave 4 in its entirety is a huge regular contracting triangle.
So far one of the five subwaves of the triangle subdivides into a double zigzag. All the other four subwaves must then be simple corrections, and three of them must be single zigzags. The fourth may be another type of simple A-B-C correction, and most commonly it would also be a zigzag.
Intermediate wave (D) would most likely be incomplete for the triangle to have a typical look. Intermediate wave (D) may end between 1,233 and 1,213, 75% to 85% the length of intermediate wave (C), which in my experience is a typical wave length for a triangle subwave.
Intermediate wave (D) may not move beyond the end of intermediate wave (B) for a contracting triangle. For a barrier triangle intermediate wave (D) may end about the same level as intermediate wave (B) as long as the B-D trend line remains essentially flat. In practice this means that intermediate wave (D) may end very slightly below the end of intermediate wave (B). This lower invalidation point is not black and white. This is the only Elliott wave rule which is not black and white.
Intermediate wave (E) may not move beyond the end of intermediate wave (C) for either a contracting or barrier triangle.
Lara, is it possible that what you have labeled as (e) of the triangle is really the end of B? Then (f) and (g) would be i and ii,
(h) and (i) would be (i) and (ii) of iii and Tuesday’s drop would be (iii) of iii. Thanks.
Yes it is possible. You would have to see the downwards wave labeled (f) and (h) as five wave structures though. They look pretty good as threes, but I guess they could be fives.
The bigger reason why I wouldn’t want to use that idea is momentum; it was so flat to the end of wave (i), and the breakout was so clear with a sharp increase in momentum.
It’s an important judgment though, because it makes a big difference to target calculation.
Hi Lara, When I look at the Main Hourly Chart above it appears that subminuette iii is the shortest of the subminuette impulse waves. I know you wouldn’t label that way so how am I seeing this wrong? Thanks for your help.
I know it looks shorter doesn’t it! But it’s not. I had the hourly chart on a semi log scale. But even on arithmetic it looks shorter.
Subminuette wave iii from 1,267.29 to 1,256.06 is 11.23 long, and subminuette wave v from 1,260.10 to 1,251.51 is 8.59.