Last analysis expected to see more sideways movement before the downwards trend resumed. This is mostly what happened.
When price breaks below 1,273.43 I will have full confidence in this wave count and the target.
Summary: The target for downwards movement to end is at 1,200.89. This target may still be about eight days away. Monday should move price lower to a short term target at 1,267.
This analysis is published about 07:40 p.m. EST. Click on charts to enlarge.
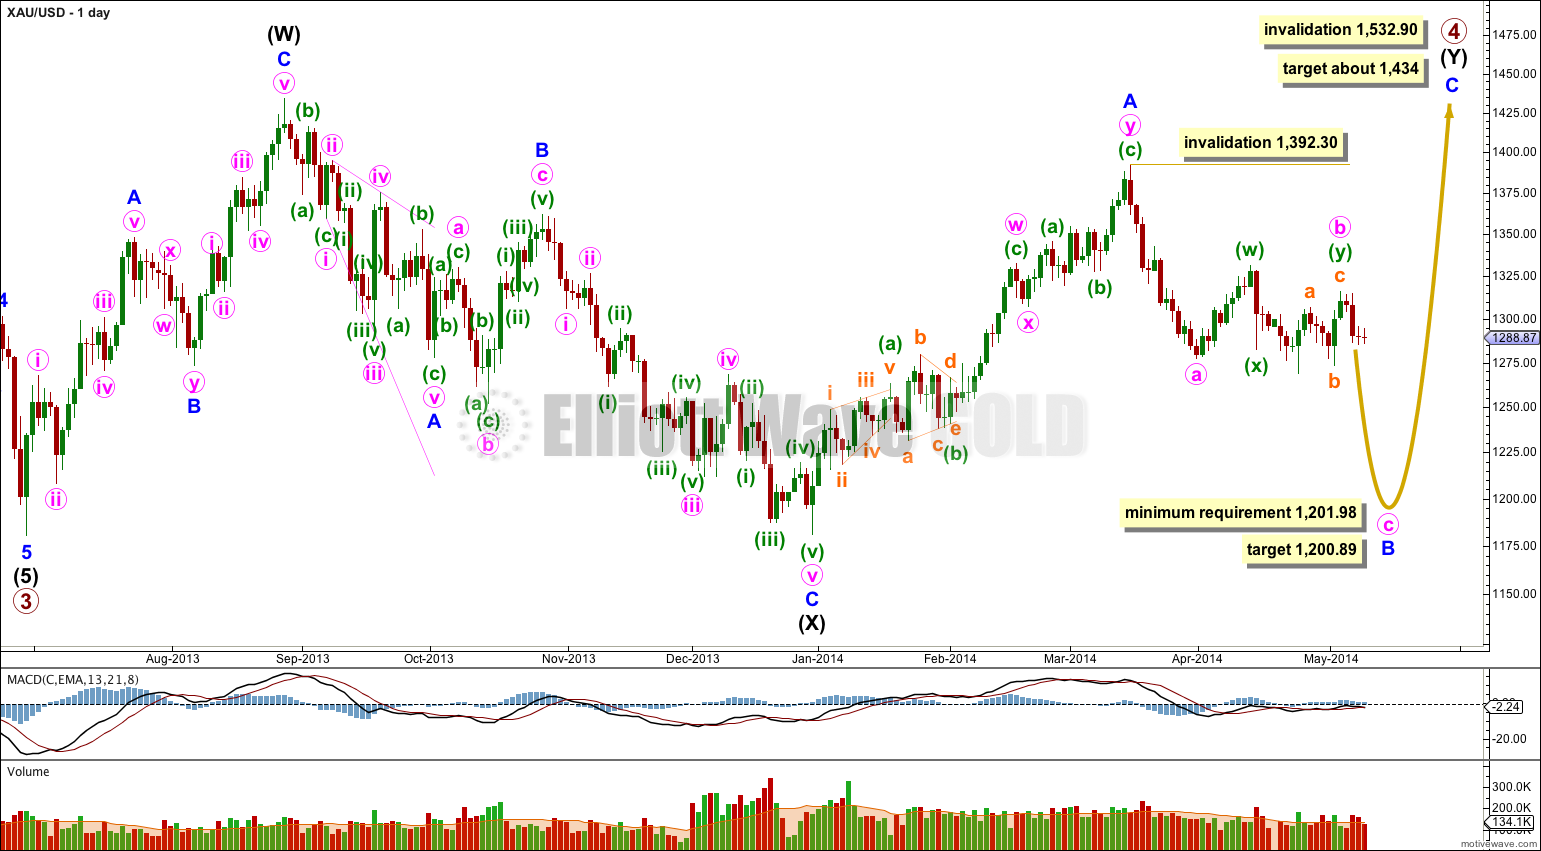
Gold is still within a large fourth wave correction at primary wave degree which is incomplete.
Primary wave 2 was a rare running flat. Primary wave 4 is unlikely to be a flat correction because it is likely to show structural alternation with primary wave 2.
Primary wave 4 is most likely to be completing as a double combination: zigzag – X – second structure. The second structure labeled intermediate wave (Y) is most likely to be a flat correction. Within the flat correction minor wave B must reach a minimum 90% the length of minor wave A at 1,201.98.
Overall the structure for primary wave 4 should take up time and move price sideways, and the second structure should end about the same level as the first at 1,434. Primary wave 4 may not move into primary wave 1 price territory. This wave count is invalidated with movement above 1,532.90.
Within intermediate wave (Y) minor wave B downwards is an incomplete corrective structure, and at this stage the structure may be either a single zigzag (as labeled here) or a double zigzag (relabel A-B-C to W-X-Y). When minute wave b is finally confirmed as complete then I will have two hourly wave counts for the two possibilities of the next downwards wave: either an impulse for a C wave or a zigzag for a Y wave.
If minor wave B is a single zigzag then within it minute wave b may not move beyond the start of minute wave a above 1,392.30. Minute wave c would reach equality in length with minute wave a at 1,200.89.
If minor wave B is a double zigzag, relabeled minute w-x-y, then within it there is no invalidation point for minute wave x. But X waves within double zigzags are usually relatively brief and shallow, as they very rarely make new price extremes beyond the start of the first zigzag in the double.
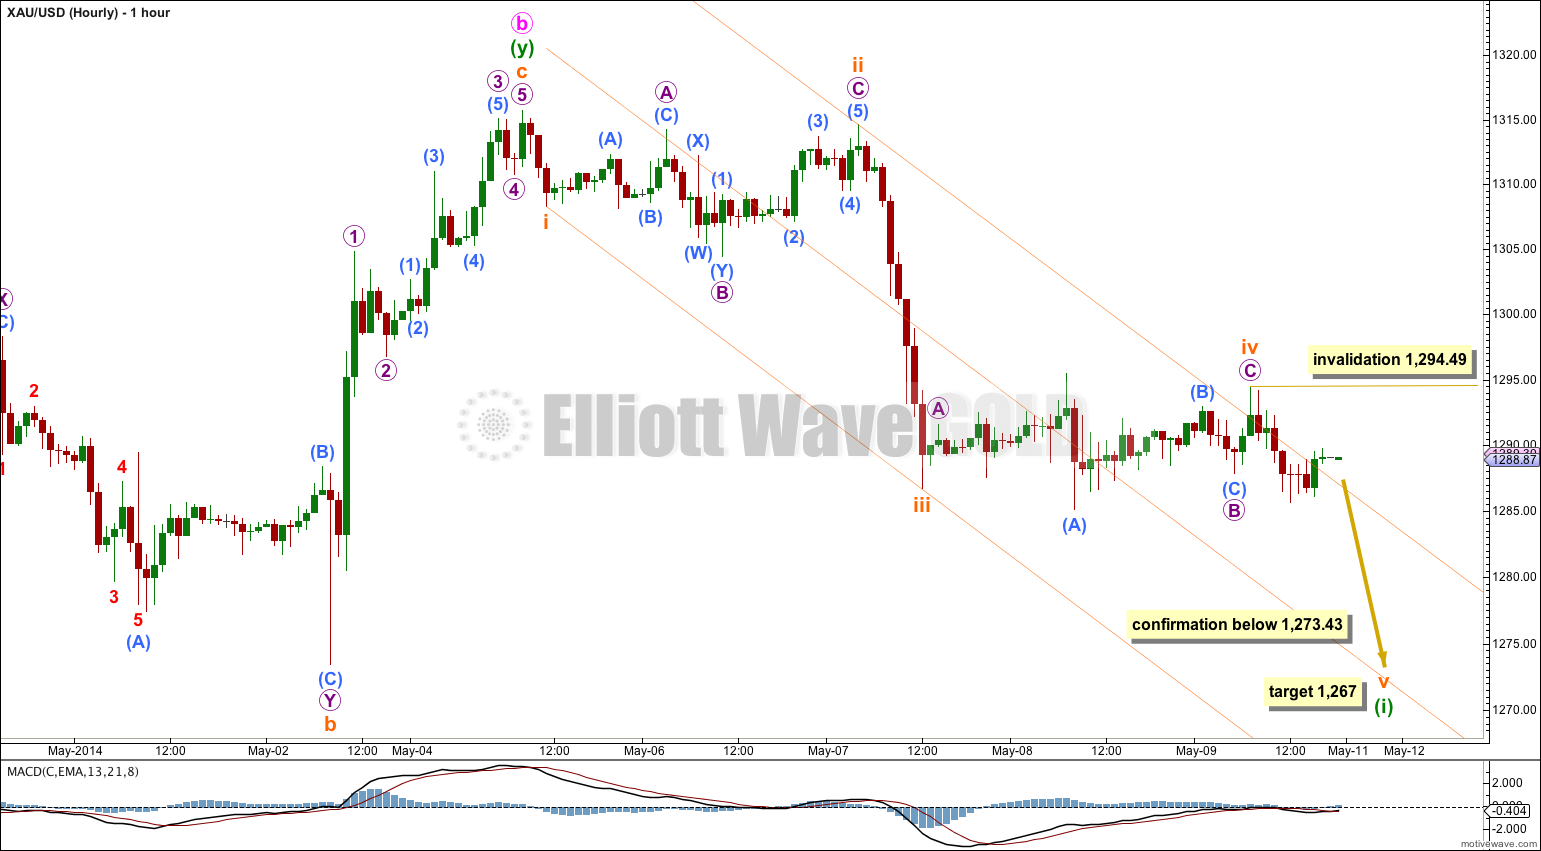
The structure of subminuette wave iv is now very likely to be complete. There is alternation in both depth and structure between subminuette waves ii and iv; subminuette wave ii was a deep expanded flat, subminuette wave iv may have been a shallow zigzag.
Because there is no Fibonacci ratio between subminuette waves i and iii I would expect to see a Fibonacci ratio between subminuette wave v and either of i or iii.
At 1,267 subminuette wave v would reach equality in length with subminuette wave iii. This is the most likely ratio for subminuette wave v and would see it end about the mid line of the parallel channel.
If price moves below 1,273.43 next week then I would have confidence that Gold has broken out of the range it has been trading in for the last 28 days. At that stage I would have more confidence in the target of 1,200.89 on the daily chart.
When minuette wave (i) is a clear five down on the hourly chart then I would also have increased confidence in this wave count. We almost have that now. When minuette wave (i) is complete then I would expect to see a correction for minuette wave (ii), the invalidation point would move back up to 1,315.72 and I would expect minuette wave (ii) to last at least two days and probably longer. This may begin mid to end next week.
While subminuette wave v is underway no second wave correction may move beyond its start above 1,294.49.