
Upwards movement was expected for Monday. Price is moving sideways in a narrow range completing a fourth wave triangle. I am adjusting the Elliott wave count to better fit with momentum, but it makes no difference to the target or direction expected.
Summary: Minor wave A may be very close to completion. When the sideways triangle is complete a final upwards thrust towards 1,330 would move price quickly higher.
Click on charts to enlarge.
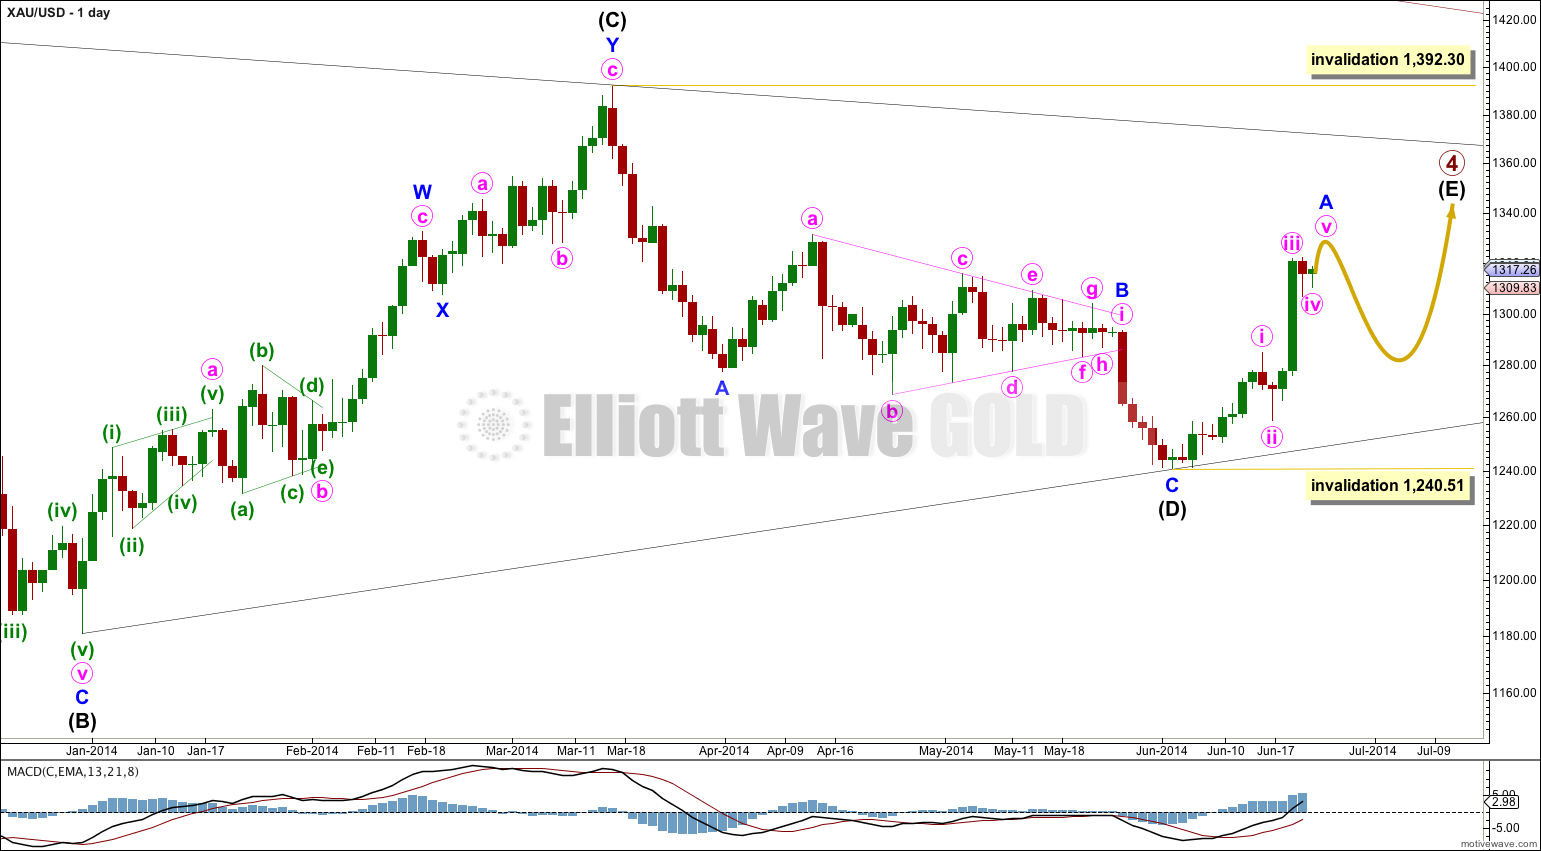
Gold is still within a large fourth wave correction at primary wave degree which is incomplete.
Primary wave 2 was a rare running flat. Primary wave 4 is unlikely to be a flat correction because it is likely to show structural alternation with primary wave 2.
This wave count expects primary wave 4 is a huge triangle. The triangle is now within the final wave of intermediate wave (E) which should subdivide as a zigzag.
Intermediate wave (E) is most likely to fall short of the (A) – (C) trend line. It may also overshoot this trend line, but that is less common.
Within the zigzag of intermediate wave (E) minor wave B may not move beyond the start of minor wave A at 1,240.51.
So far within primary wave 4 intermediate wave (A) lasted 43 days (no Fibonacci relationship), intermediate wave (B) lasted 88 days (just one day short of a Fibonacci 89), intermediate wave (C) lasted 53 days (just two days short of a Fibonacci 55) and intermediate wave (D) lasted 56 days (just one day more than a Fibonacci 55). If intermediate wave (E) exhibits a Fibonacci relationship then I would expect it to last either 34 or 55 days (give or take one or two days either side of these numbers). So far it has lasted only 14 days.
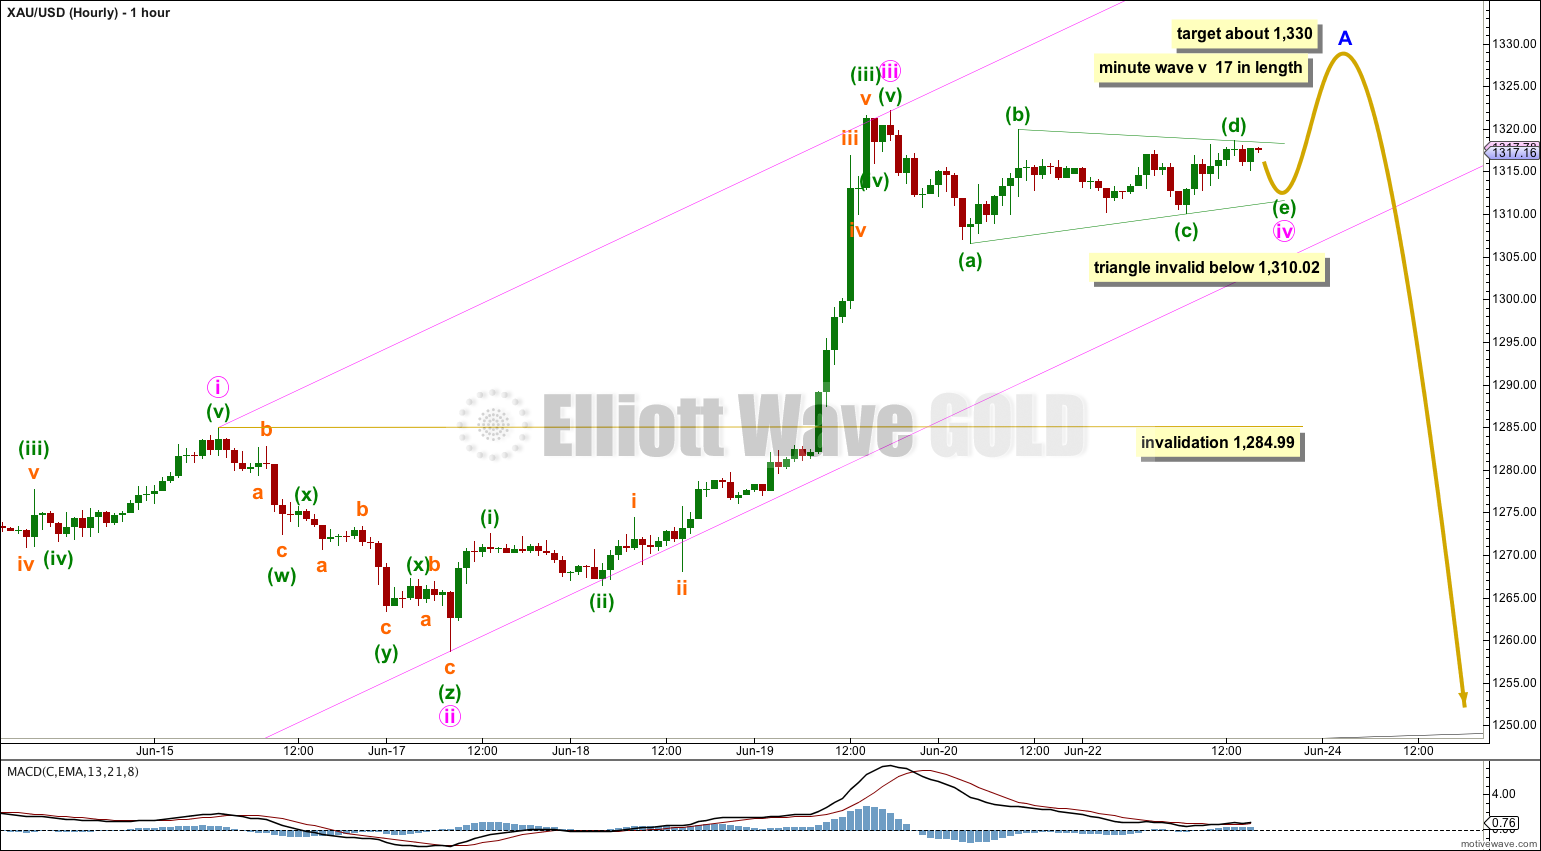
I have adjusted the wave count within minor wave A to fit better with momentum. This wave count sees the third wave as the strongest. It also sees perfect alternation with the triangle of minute wave iv and the triple zigzag of minute wave ii.
There is no Fibonacci ratio between minute waves iii and i, so I would expect to see a Fibonacci ratio between minute wave v and either of iii or i. If minute wave v is 0.382 the length of minute wave i (16.99), then it may be close to equality in length with the widest part of the triangle (15.56).
Minute wave iv looks like it is completing as a barrier triangle, with the (b) – (d) trend line close to being flat. Fifth waves following barrier triangles are either short and sharp, or very long extensions. Considering the upper trend line for the triangle of primary wave 4 on the daily chart I would expect minor wave A to end comfortably short of that, and so I would not expect minute wave v to be a long extension. It is much more likely to be short and sharp.
If the triangle for minute wave iv remains valid (if price does not move below 1,310.02) then when it is done I would expect to see one short sharp upwards thrust about $17 in length.
If the triangle is invalidated with movement below 1,310.02 then minute wave iv may be completing as a double combination. It may not move into minute wave i price territory below 1,284.99.
Price movement above 1,319.88 would indicate the triangle is complete and minute wave v is underway. At that stage a target may be calculated using the end of the triangle and adding $17 to that point.
I have drawn a channel about minor wave A using Elliott’s first technique: draw the first trend line from the highs of minute waves i to iii, then place a parallel copy upon the low of minute wave ii. I would expect minute wave v to end mid way within this channel. When the channel is breached by subsequent downwards movement that will provide first indication that minor wave A is over and minor wave B is underway.
This analysis is published about 05:27 p.m. EST.
Hi Lara,
Is the final 5th wave out of triangle expected by this week? If you can give timeline , it’d be helpful. I’m long via GLD Weekly options, so trying to see if it’s worth to exit and go long again.
Thx
Its here already, we have a new high.