
Another sideways session and another small red doji candlestick still fits the wave count. However, with sideways movement lasting over two days now I am again considering an alternate idea published previously. It makes no difference to overall direction at the daily chart level, but it makes a difference to target calculation and short term expectations.
Summary: A third wave down has most likely begun. The target is 1,206. Movement below 1,241.16 would provide full and final confirmation the third wave has begun.
This analysis is published about 8:20 p.m. EST. Click on charts to enlarge.
Main Wave Count.
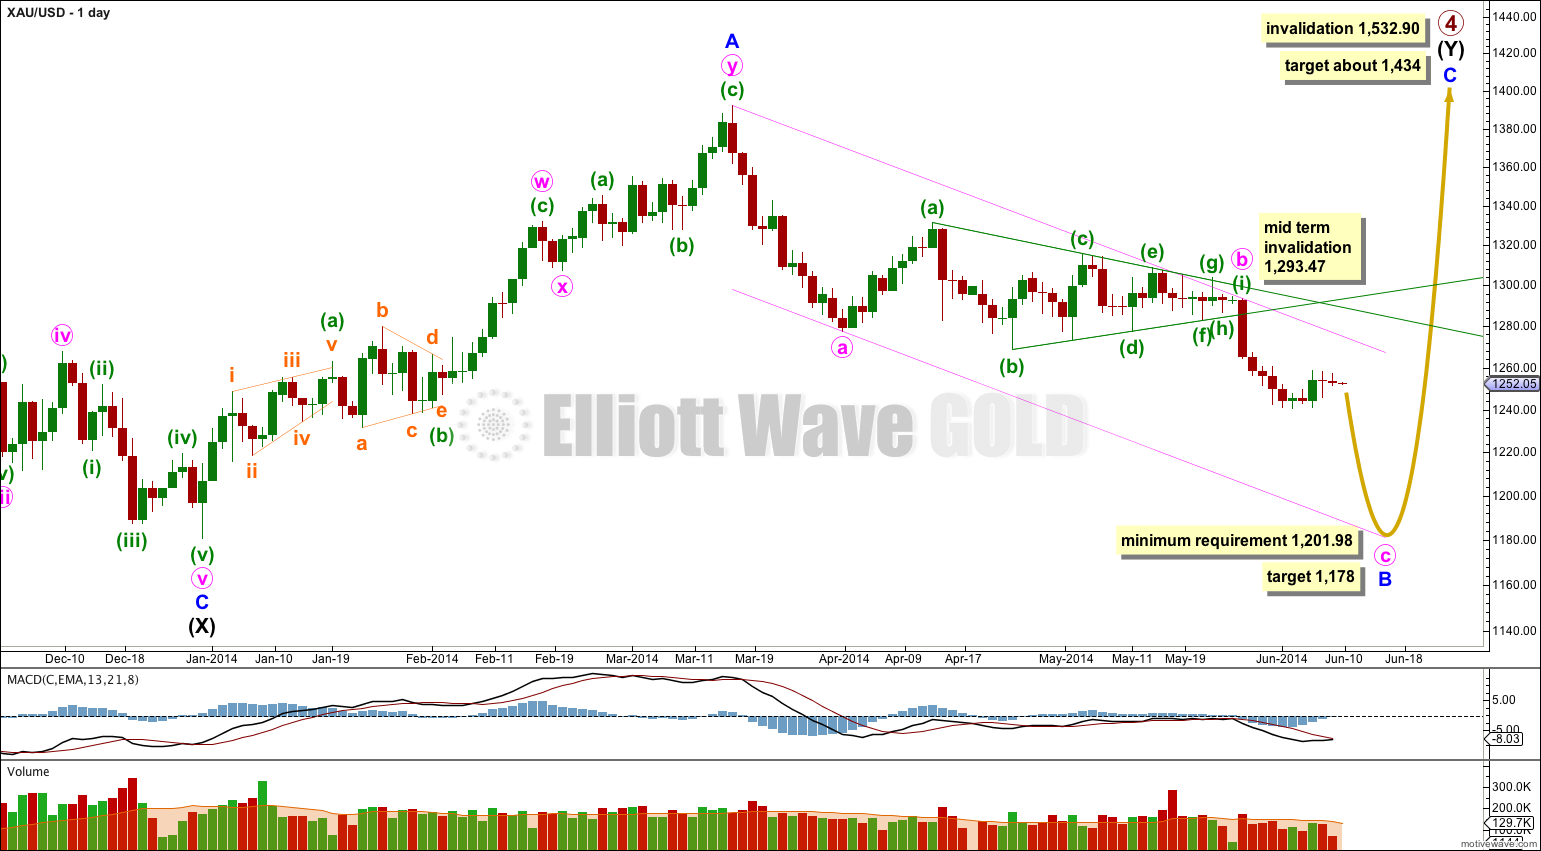
Gold is still within a large fourth wave correction at primary wave degree which is incomplete.
Primary wave 2 was a rare running flat. Primary wave 4 is unlikely to be a flat correction because it is likely to show structural alternation with primary wave 2.
Primary wave 4 is most likely to be completing as a double combination: zigzag – X – second structure. The second structure labeled intermediate wave (Y) is most likely to be a flat correction. Within the flat correction minor wave B must reach a minimum 90% the length of minor wave A at 1,201.98.
If downwards movement does not reach 1,201.98 or below then intermediate wave (Y) may not be a flat correction and may be a contracting triangle. I will keep this alternate possibility in mind as this next wave down unfolds. If it looks like a triangle may be forming I will again chart that possibility for you.
It remains possible that primary wave 4 in its entirety is a huge contracting triangle. This alternate idea is published at the end of this analysis daily.
Overall a double combination for primary wave 4 should take up time and move price sideways, and the second structure should end about the same level as the first at 1,434. Primary wave 4 may not move into primary wave 1 price territory. This wave count is invalidated with movement above 1,532.90.
Within intermediate wave (Y) minor wave B downwards is incomplete. It may be a single zigzag as labeled here. If it is a single zigzag then minute wave c is unfolding as a five wave impulse. Within the impulse minuette wave (ii) may not move beyond the start of minuette wave (i) at 1,293.47. At 1,178 minute wave c would reach equality in length with minute wave a.
I have drawn a channel about minor wave B downwards: draw the first trend line from the start of minute wave a to the end of minute wave b, then place a parallel copy upon the end of minute wave a. I will expect downward movement to find support at the lower end of this channel due to this being the most common place for minute wave c to end.
Within minor wave B downwards I have extended the triangle trend lines for minute wave b outwards. The point in time at which they cross over may be where the downwards trend has resumed. This does not always work, but it does work often enough to look out for it.
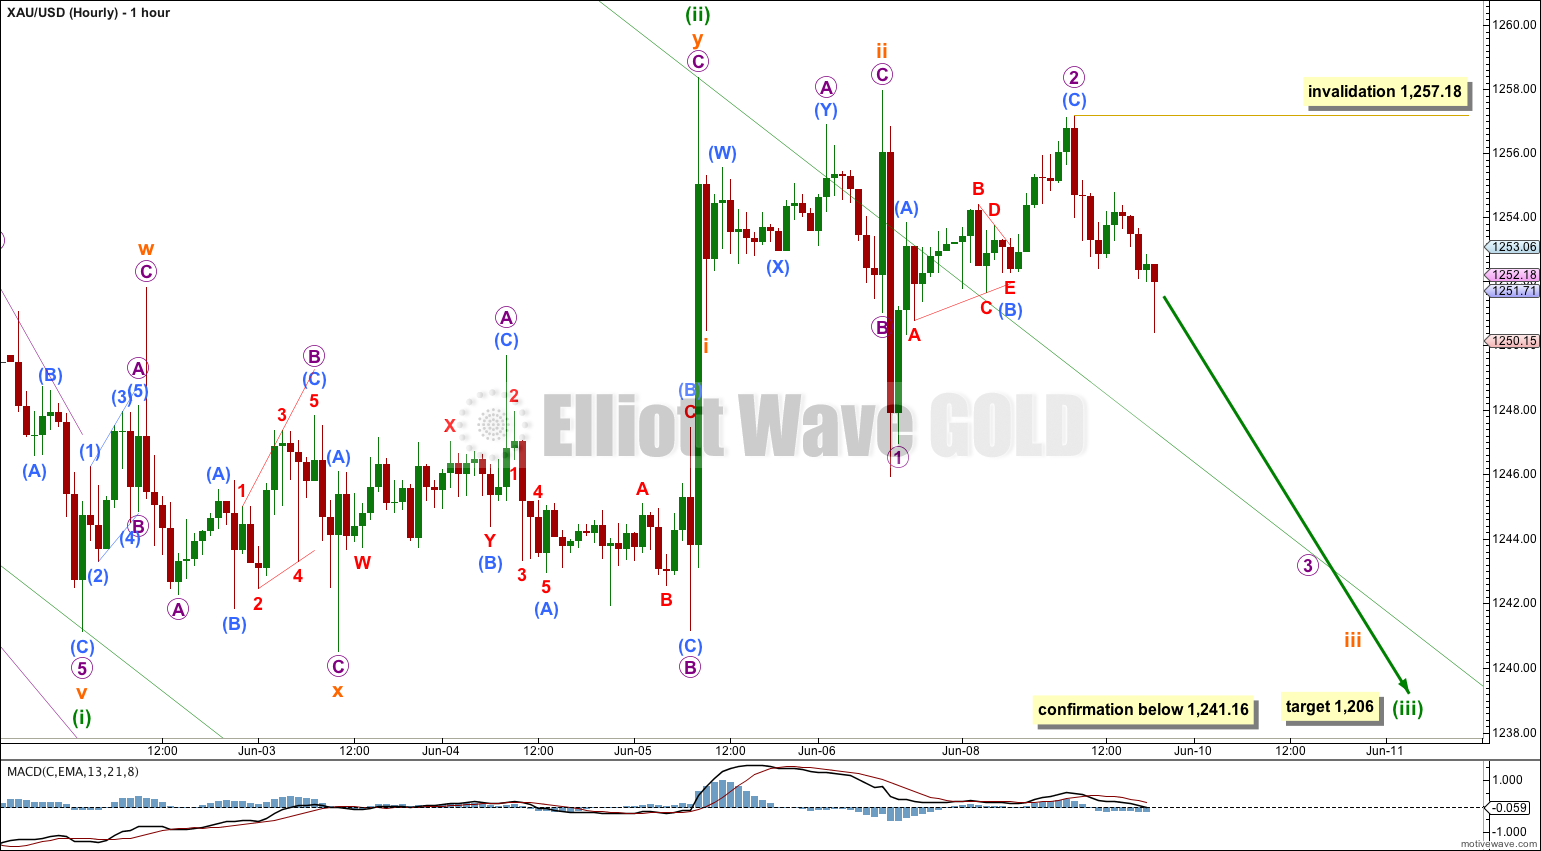
Minuette wave (ii) is still most likely over at 1,258.38. At that point lasting 77 hours in comparison to minuette wave (i) lasting 101 hours, it is nicely in proportion. Within an impulse the corrective waves of two and four are normally less time consuming than the actionary waves of one, three and five.
Within minuette wave (iii) we may now have two complete overlapping first and second waves. This indicates a strong increase in downwards momentum may happen early this week, and if this wave count is correct it should happen from here.
For this main wave count minuette wave (ii) is a double combination: zigzag – X – flat. The subdivisions fit perfectly within this movement, but the second corrective structure of subminuette wave y has deepened the correction beyond the end of subminuette wave w. This gives this piece of the wave count an atypical look: combinations normally move sideways, and don’t normally slope strongly against the main trend.
Movement below 1,241.16 would confirm that minuette wave (ii) is over and minuette wave (iii) has begun. At that stage I would have confidence in the target.
Within micro wave 3 no second wave correction may move beyond the start of its first wave above 1,257.18.
Alternate Wave Count.
I have published this alternate idea for you before, and I’m going back to it again today because of sideways movement for Monday’s session.
If within minor wave B downwards the first wave is a three wave zigzag and not a five wave impulse then minor wave B may be completing as a double zigzag, with minute wave x a nine wave triangle. This means that the current downwards movement may be completing as a zigzag and not an impulse. This may explain the sideways movement of the last two days quite nicely. The overall direction is the same; I still expect more downwards movement.
Within minute wave y minuette wave (b) would be incomplete on the hourly chart. It may not move beyond the start of minuette wave (a) above 1,293.47. When minuette wave (b) is complete then I can calculate a target for minuette wave (c) to end. I cannot do that yet because I don’t know where minuette wave (c) starts.
If the next piece of downwards movement does not show a strong increase in downwards momentum then this alternate would be an excellent explanation.
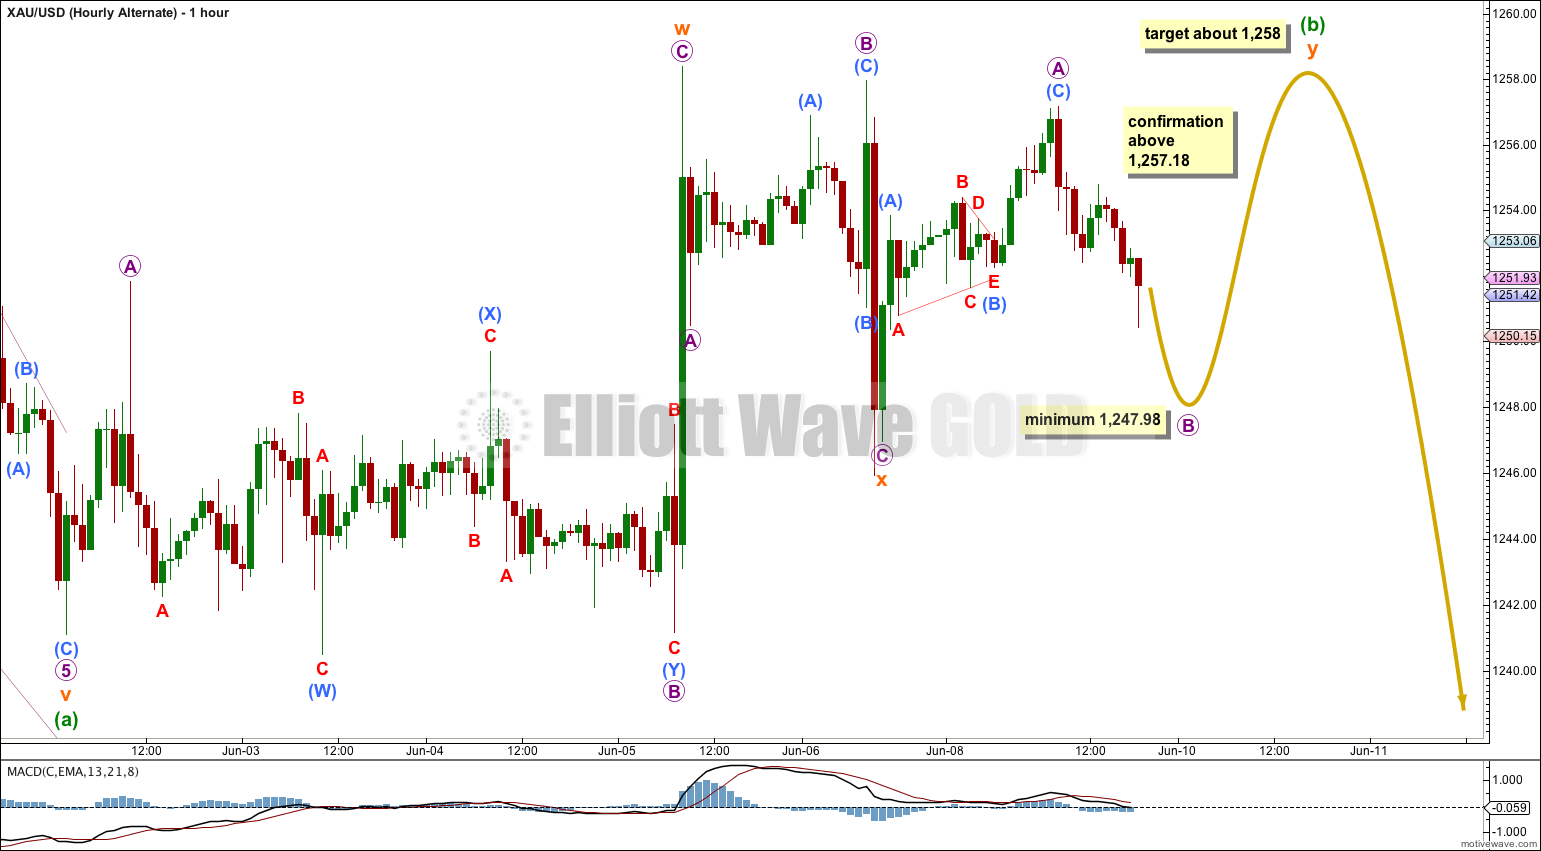
Within minuette wave (b) the structure fits best as a double flat correction. Within the second flat correction micro wave B should move lower to reach a minimum 90% length of micro wave A at 1,247.98 or below. Micro wave C would then be most likely to make at least a new high above the end of micro wave A at 1,257.18 to avoid a truncation.
Double flat corrections move price sideways. The second flat in the double normally ends about the same level as the first. Subminuette wave y would be expected to end about 1,258.
Within subminuette wave w micro wave B is labeled here as a double, but the subdivisions fit for this only as a double zigzag. Double zigzags normally slope sharply against the main trend and do not normally move price sideways. This structure is sideways and is very atypical for a double zigzag. This reduces the probability of this wave count.
A double zigzag which moves only sideways is more unusual than a double combination that slopes against the main trend. This alternate wave count has a lower probability (for this reason and others previously published) than the main wave count.
If price moves above 1,257.18 in the next couple of days after micro wave B is complete then this alternate may be correct.
Daily – Triangle.
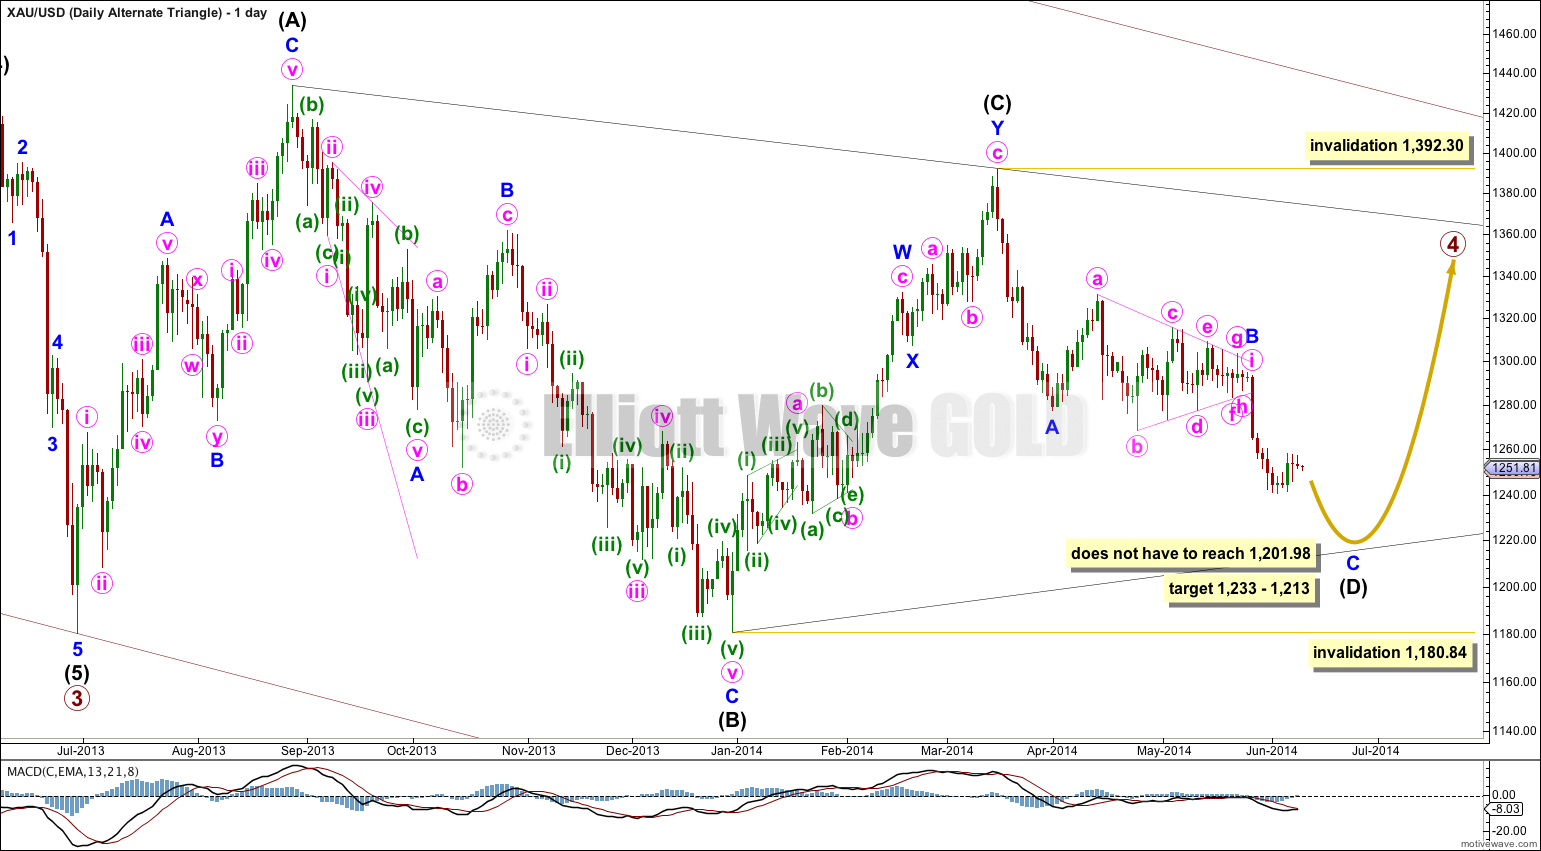
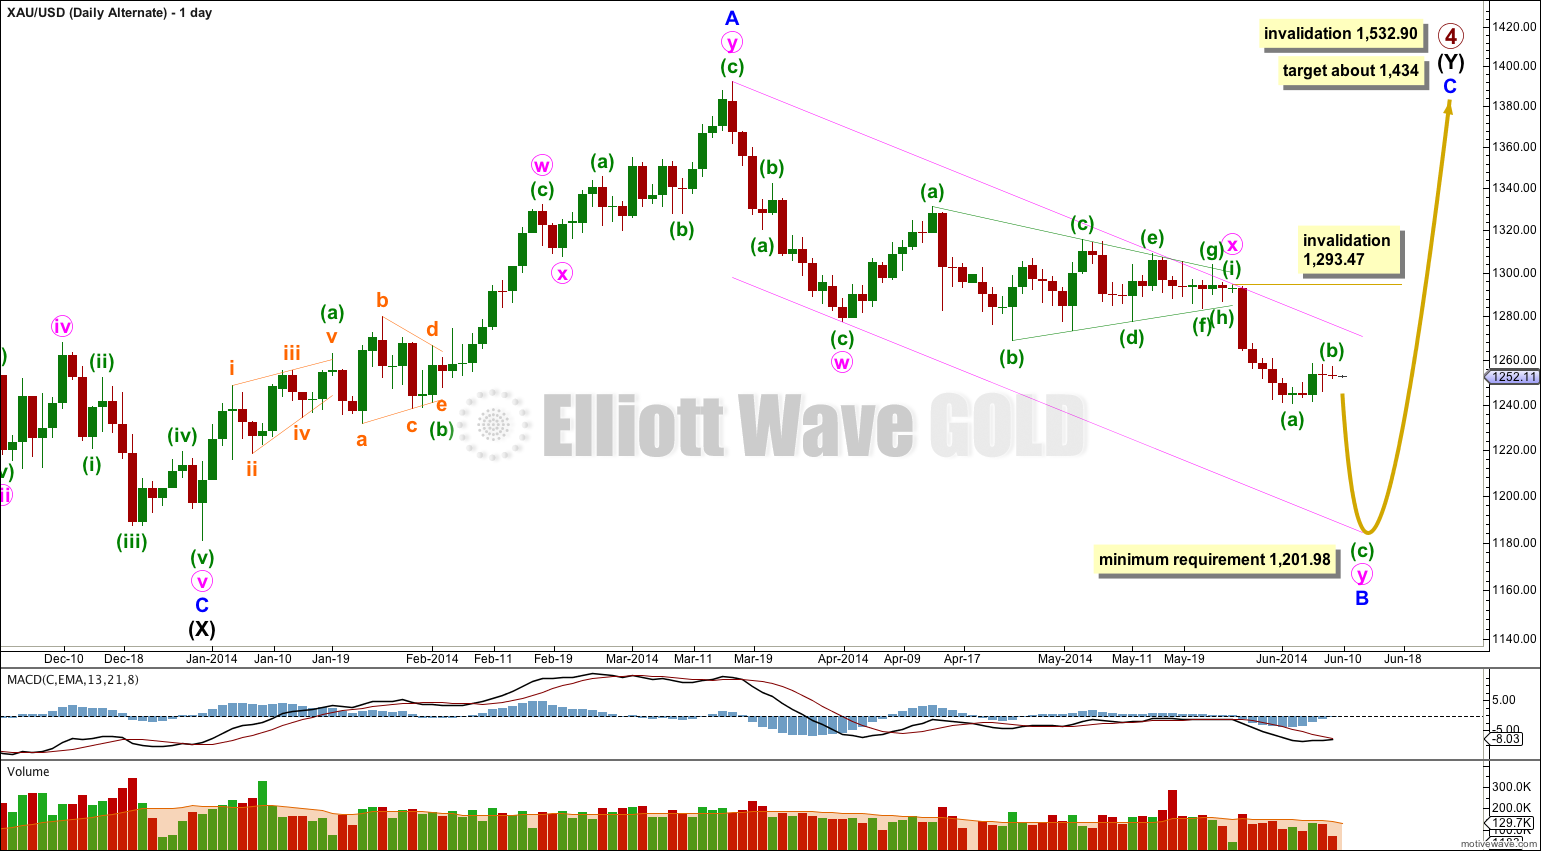
It remains possible that primary wave 4 in its entirety is a huge regular contracting triangle.
So far one of the five subwaves of the triangle subdivides into a double zigzag. All the other four subwaves must then be simple corrections, and three of them must be single zigzags. The fourth may be another type of simple A-B-C correction, and most commonly it would also be a zigzag.
Intermediate wave (D) would most likely be incomplete for the triangle to have a typical look. Intermediate wave (D) may end between 1,233 and 1,213, 75% to 85% the length of intermediate wave (C), which in my experience is a typical wave length for a triangle subwave.
Intermediate wave (D) may not move beyond the end of intermediate wave (B) for a contracting triangle. For a barrier triangle intermediate wave (D) may end about the same level as intermediate wave (B) as long as the B-D trend line remains essentially flat. In practice this means that intermediate wave (D) may end very slightly below the end of intermediate wave (B). This lower invalidation point is not black and white. This is the only Elliott wave rule which is not black and white.
Intermediate wave (E) may not move beyond the end of intermediate wave (C) for either a contracting or barrier triangle.