
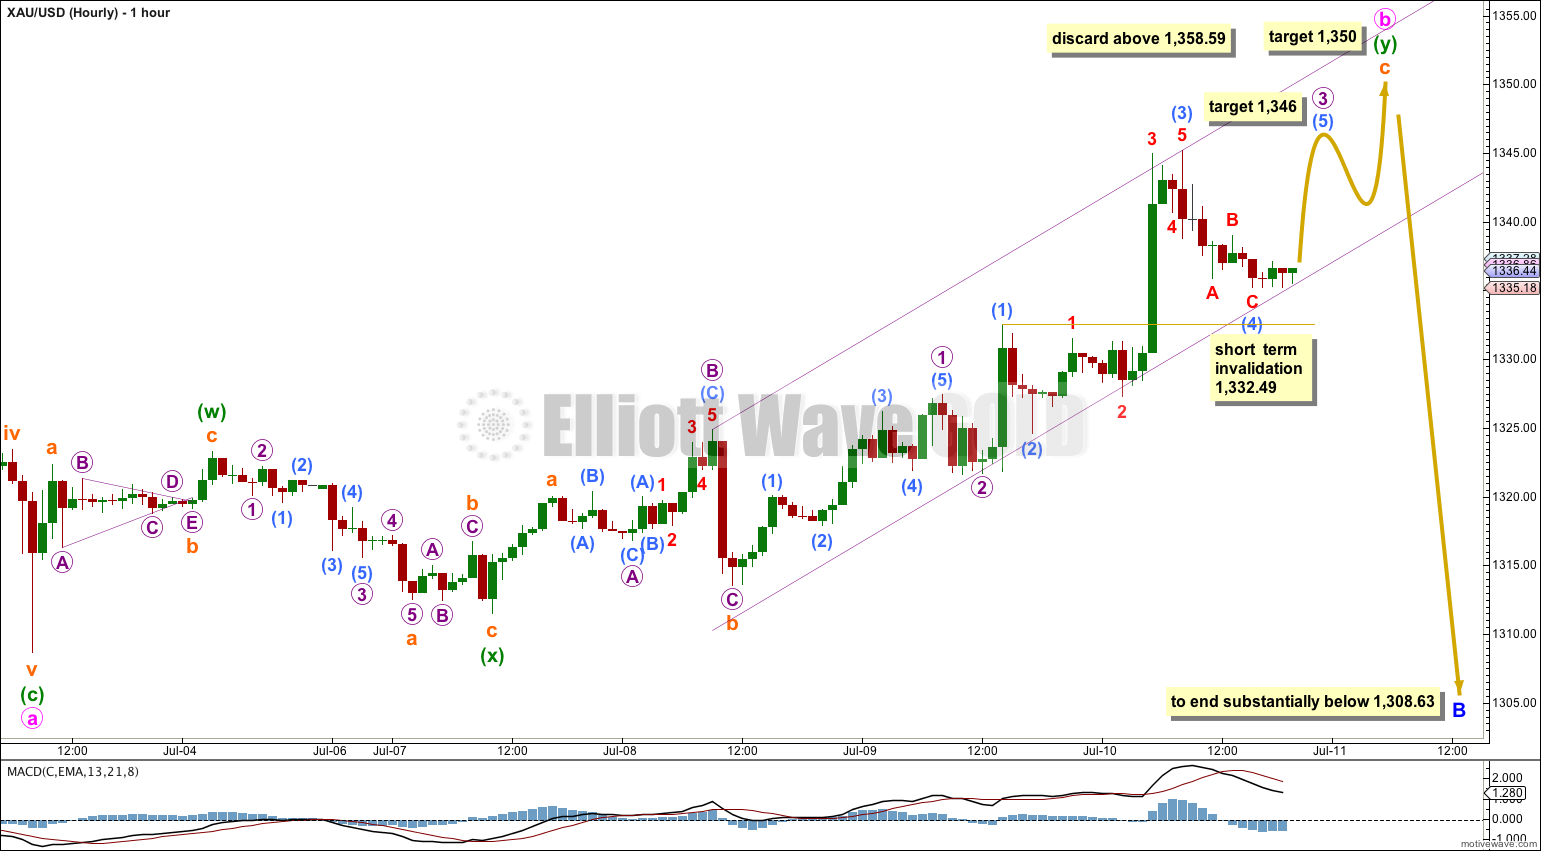
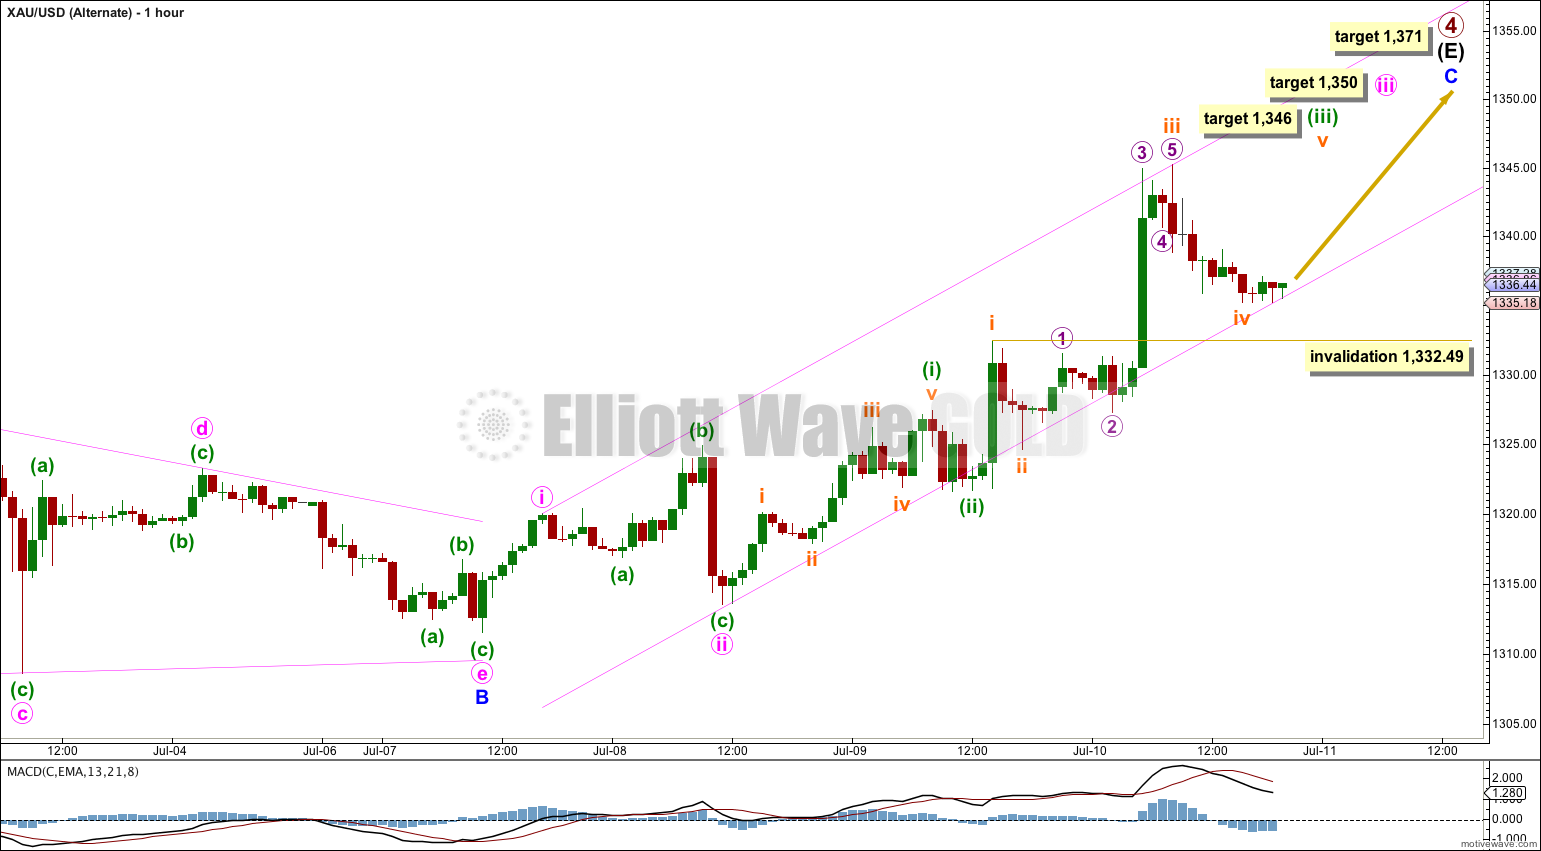
Movement above 1,332.49 invalidated the first two hourly wave counts leaving only one hourly wave count, the third. At that stage the analysis expected more upwards movement to end between 1,333.61 to 1,343.10. Upwards movement has reached 1,345.22.
Summary: Upwards movement should continue a little further to 1,350. Thereafter, I expect a trend change and a new five wave structure downwards to be about $65.40 in length. I will use the channel on the hourly chart as the first indicator of that trend change. If price moves above 1,358.59 I have an alternate for you which has an upwards target at 1,371.
Click on charts to enlarge.
Main Wave Count.
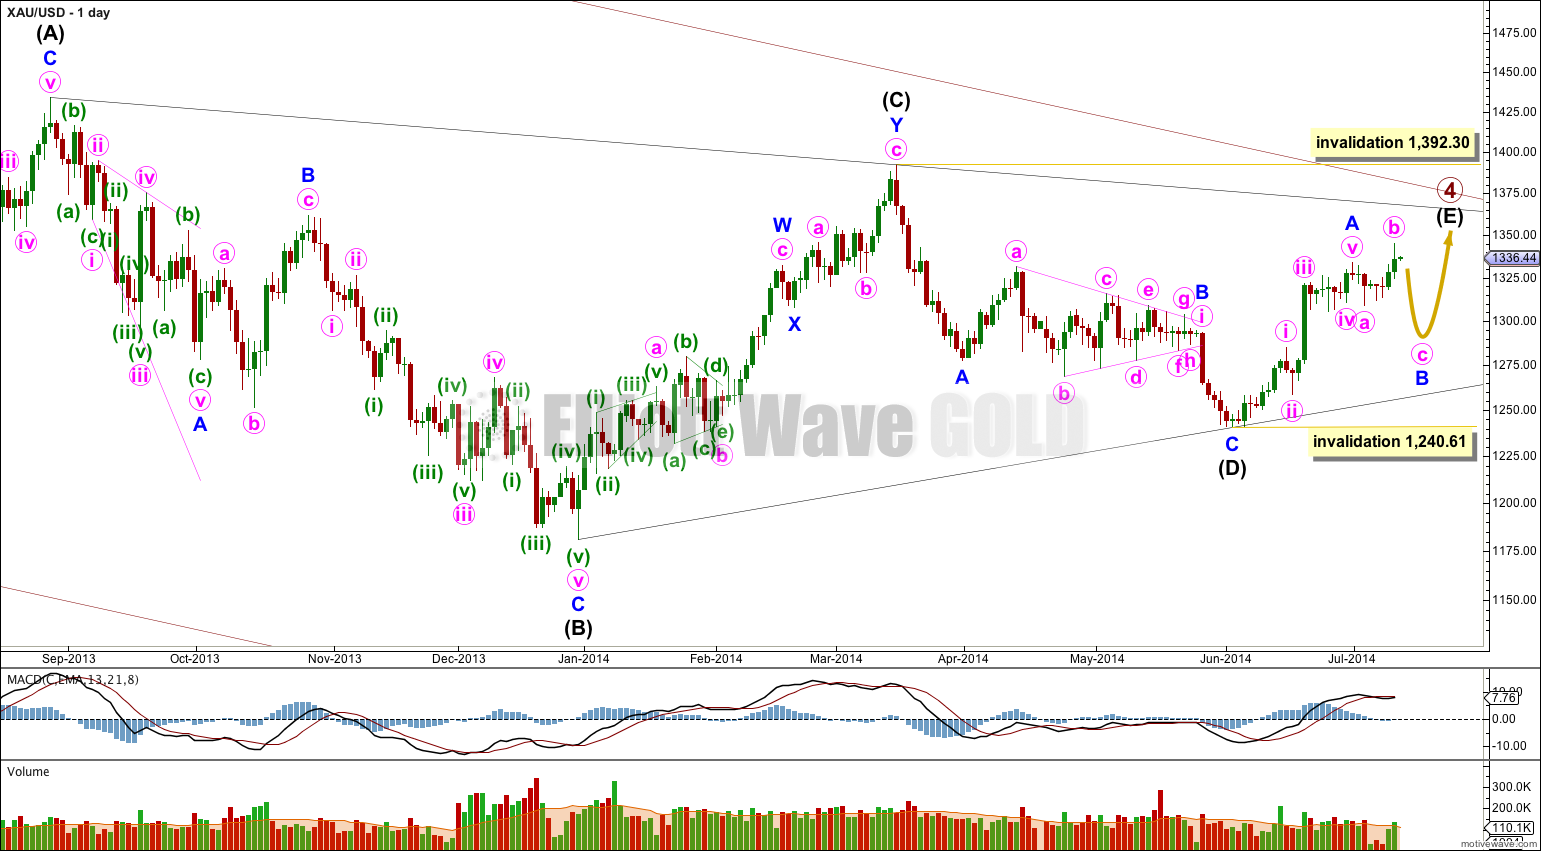
It is likely that only minor wave A is complete and sideways movement is an incomplete minor wave B. This wave count could see primary wave 4 last another two weeks to complete in a total Fibonacci 55 weeks which would be very satisfying analytically.
If minor wave B moved substantially lower it should find very strong resistance at the (B)-(D) trend line. A breach of this trend line would look very atypical and at that stage this main wave count would significantly reduce in probability, so much so I may discard it. However, I do not expect minor wave B to be deep; the deepest target I have for minor wave B to end is about the 0.382 Fibonacci ratio at 1,298.
Minor wave B may not move beyond the start of minor wave A below 1,240.61. Invalidation of this wave count at the daily chart level would provide full confidence in the alternate wave count.
B waves exhibit the greatest variety in form and structure of all waves. They are often very choppy, overlapping range bound movements which are extremely difficult to analyse. Flexibility in analysis is essential during B waves. I will focus in identifying the end of this sideways movement over one to two days. When it is done price should break out upwards.
I am still as confident as I can be that minor wave B is incomplete. I want to continue to consider all possibilities, and with that in mind I have a new alternate wave count for you today. This main wave count has a higher probability. I would judge this main wave count to be 70% likely, with the alternate the remaining possible 30%.
This main wave count sees minor wave B as an incomplete expanded flat correction. Minute wave b is now a little longer than the maximum common length to minute wave a, but it is within an allowable range. When minute wave b reaches up to twice the length of minute wave a at 1,358.59 then this wave count should be discarded in favour of the alternate below.
Within this expanded flat minute wave a subdivides as a zigzag. Minute wave b subdivides as a double zigzag, with the second zigzag in the double deepening the correction.
Within minuette wave (y) zigzag at 1,350 subminuette wave c would reach 4.236 the length of subminuette wave a.
I have adjusted the wave count within subminuette wave c a little today. This labeling has a more typical look. I expect we have just passed the middle of a third wave, and I expect to see more upwards movement before subminuette wave c is a complete five wave impulse.
Within subminuette wave c micro wave 3 is incomplete. There is no Fibonacci ratio between submicro waves (1) and (3) so it is very likely submicro wave (5) will exhibit a Fibonacci ratio to either of submicro waves (1) or (3). At 1,346 submicro wave (5) would reach equality in length with submicro wave (1), which is the most common ratio for a fifth wave.
At this stage submicro wave (4) may not move into submicro wave (1) price territory below 1,332.49.
When submicro wave (5) is complete then the invalidation point moves down to the high of micro wave 1 at 1,327.41. Micro wave 4 may not move into micro wave 1 price territory.
When micro wave 4 is complete then a final fifth wave may take price up to the final target at 1,350.
When minute wave b is complete then I can calculate a target for minute wave c for you. I would expect it to most likely move substantially below the end of minute wave a at 1,308.63 for this expanded flat correction to have a most typical look. It would most likely be 2.618 the length of minute wave a so $65.40 in length.
I have drawn a “best fit” channel about subminuette wave c. If we see upwards movement to the targets, and one more small fourth wave correction interrupts that movement then this wave count will have a typical look. If after that the channel is clearly breached by downwards movement that shall be the first indication of a trend change.
Alternate Wave Count.
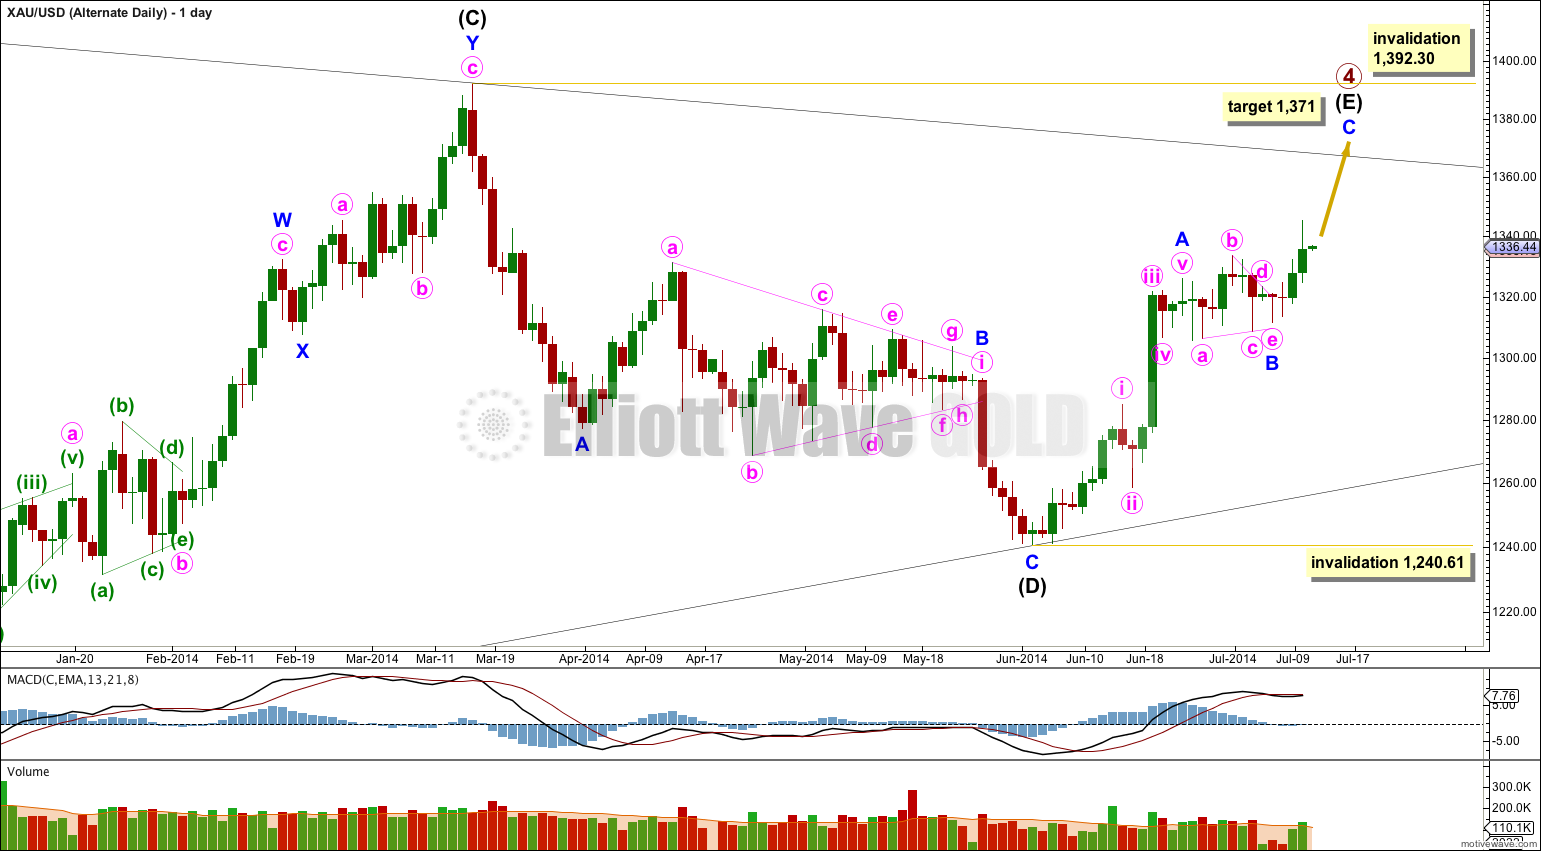
In trying to see if minor wave B could be complete I have considered the possibility of a triangle. If this is correct then minor wave C may have begun at 1,311.49.
At 1,371 minor wave C would reach 0.618 the length of minor wave A. This would see intermediate wave (E) only slightly overshoot the (A)-(C) trend line which does not have a typical look. The target may be a little too low… or too high. Once minute waves iii and iv within minor wave C have ended I could calculate the target at minute wave degree which would have a higher probability. I cannot do that yet.
If this wave count becomes the main wave count with price movement above 1,358.59 then the target at 1,371 will be recalculated at minute wave degree towards the end of upwards movement.
This chart shows the possible triangle for minor wave B. There are several problems with this wave count which reduce its probability. I publish it today for two reasons: I want to consider all possibilities, and this chart illustrates why the main wave count has a higher probability.
Minute wave v of minor wave A does not subdivide nicely as a five wave structure. The main wave count sees this movement as a three, which has a much better fit.
Within the triangle of minor wave B there is an overshoot of the b-d trend line by minuette wave (b) within minute wave c. This gives the triangle an atypical look. Triangle trend lines are normally very strongly adhered to, and are sometimes slightly overshot but not by this much. When they are overshot it is sometimes the end of triangle subwaves which overshoot, and not the middle portion of the subwaves.
Most of the structure within minor wave C is seen in the same way as for the main wave count for this upwards movement. A third wave has just finished the middle, and the structure is incomplete.
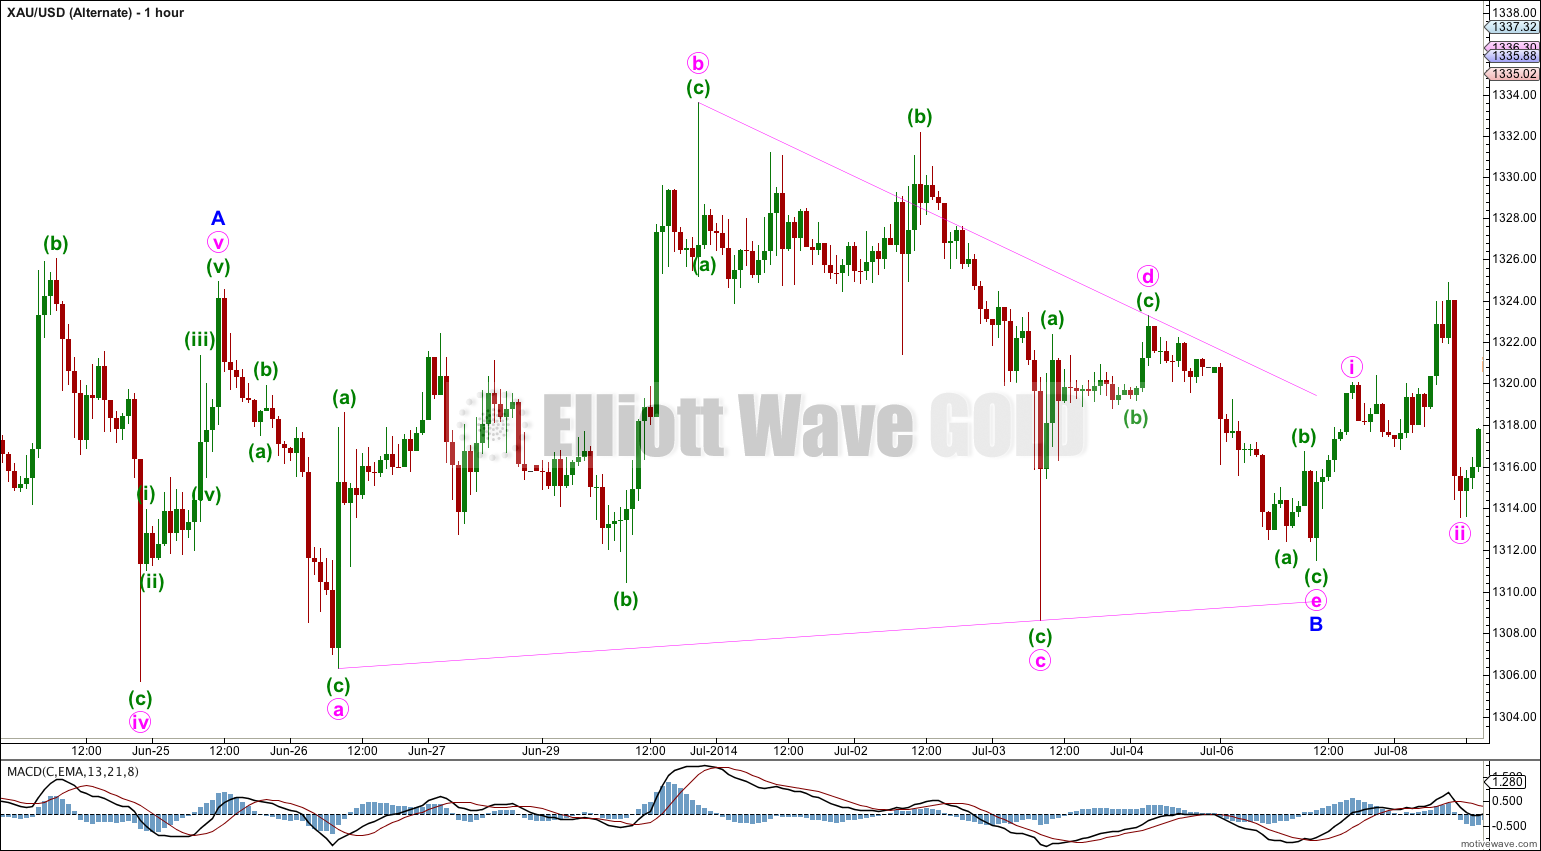
At 1,350 minute wave iii would reach 4.236 the length of minute wave i.
Within minuette wave (iii) subminuette wave iii may not move into subminuette wave i price territory below 1,332.49.
At 1,346 subminuette wave v would reach equality in length with subminuette wave iii. Once minuette wave (iii) is complete the invalidation point moves down to the end of minuette wave (i) at 1,327.41.
Minuette wave (iv) may not move into minuette wave (i) price territory below 1,327.41.
Thereafter, minuette wave (v) should move up to the target for minute wave iii.
Up to this point the main wave count and this alternate wave count are in agreement with what should happen.
When minute wave iii is complete that is when this alternate diverges from the main wave count.
When minute wave iii is complete then minute wave iv should unfold sideways and lower. It may not move into minute wave i price territory below 1,320.04. This price point will differentiate this alternate wave count. Movement below 1,320.04 at that stage would invalidate this alternate and provide strong confirmation for the main wave count.
This analysis is published about 09:08 p.m. EST.
That’s brilliant, thank you Bob!
I’ll use that data. Yes, that helps a lot.
GDX charts can now be up to date 🙂
Hey Lara, I’m seeing a harami on the daily GDX chart and the MACD is skimming along and about to cross over. This will be a bearish indicator for many tech savvy investors. I would bet that we are very close to the top.
And as far as your peanut gallery.. Don’t sweat it. Im down a considerable chunk on my recent leveraged short, but i knew what i was getting myself into.
“If you cant handle the stress, go buy an income fund.”
I’m getting my data for GDX here:
https://nz.finance.yahoo.com/q/hp?s=GDX
And Yahoo is not showing me the data for the very last day, 11th July, so when I update my charts the last candlestick I see is the big red candlestick for 10th July.
So I can’t see the harami.
If anyone can give me a link to a source where I can get data for GDX in .csv format which includes the most recent trading day then my analysis for GDX will be more up to date for you all.
I’ll ask members to look for me, while I get on with the Gold analysis.
I find searching for data in the right format sometimes takes quite some time.
Lara, Google Finance has the data in .csv format and it is updated sooner than Yahoo. Hope this helps.
http://www.google.com/finance/historical?cid=709738&startdate=Jan+1%2C+2010&enddate=Jul+13%2C+2014&num=30&ei=zNzCU8jHCsGIjAKWj4DADQ
Hi Lara. That was mighty solid analysis. Keep up the good work. Don’t feel too bad when there are undue criticisms. There will always be armchair critics: people who blame others at the first sign of things not going their way. And, of course, there are reasonable people who truly appreciate the effort that has been put in, especially in trying situations.
It is extremely difficult to predict what will happen next as an event unfolds. Although Elliott Wave analysis provides a strong framework to work with, deviations along the way can, and very often do, occur. We have to factor all this in its stride. If everything is so straightforward, then everybody will arrive at the same conclusion, and therefore profit from it. (Theoretically, nobody will profit because this is a zero-sum game).
I am sure that there are many others like me who find your work enlightening, and illuminate the way in an otherwise seemingly random trend. Thank you for your efforts!
Thank you!
Lara, crazy wave patterns, don’t be concerned with naysayers, your comments on percentages and probabilities as stated below are great.
In addition to daily gold analysis the features I like and hope to see continued (1) daily summary (2) ability to compare gold, silver and gdx charts and now (3) your comments on percentages and probabilities.
“I am still as confident as I can be that minor wave B is incomplete. I want to continue to consider all possibilities, and with that in mind I have a new alternate wave count for you today. This main wave count has a higher probability. I would judge this main wave count to be 70% likely, with the alternate the remaining possible 30%.”
Thanks Davey! That made me LOL, and made my day a little brighter.
I don’t have a very thick skin, and I take my analysis very seriously. Normally I have comments moderated by someone else so that anything upsetting is deleted. Those ones slipped by my moderator today. Although, they were rather tame compared to some of the horrible things random internet people say (not members!).
I can totally handle criticism of my work, as long as it stays focussed on the analysis and does not get personal.
No surf for me today. You may hear in the background of the videos the wind howling. Its been hammering us for five days now, gusts over 100km per hour!