
Movement below 1,292.25 has clarified the situation for the short term. The main hourly Elliott wave count was judged to have about a 60% probability, but was invalidated. The less likely hourly alternate is now the main count, and I still have an alternate daily Elliott wave count for you.
Summary: I expect to see very choppy overlapping movement for several days. The target at 1,280 looks too high. I will be able to calculate a more accurate target for you towards the end of this structure. For the next 24 hours or so I expect to see at least one green candlestick upwards to end between 1,312 to 1,318.
Click on charts to enlarge.
Main Wave Count.
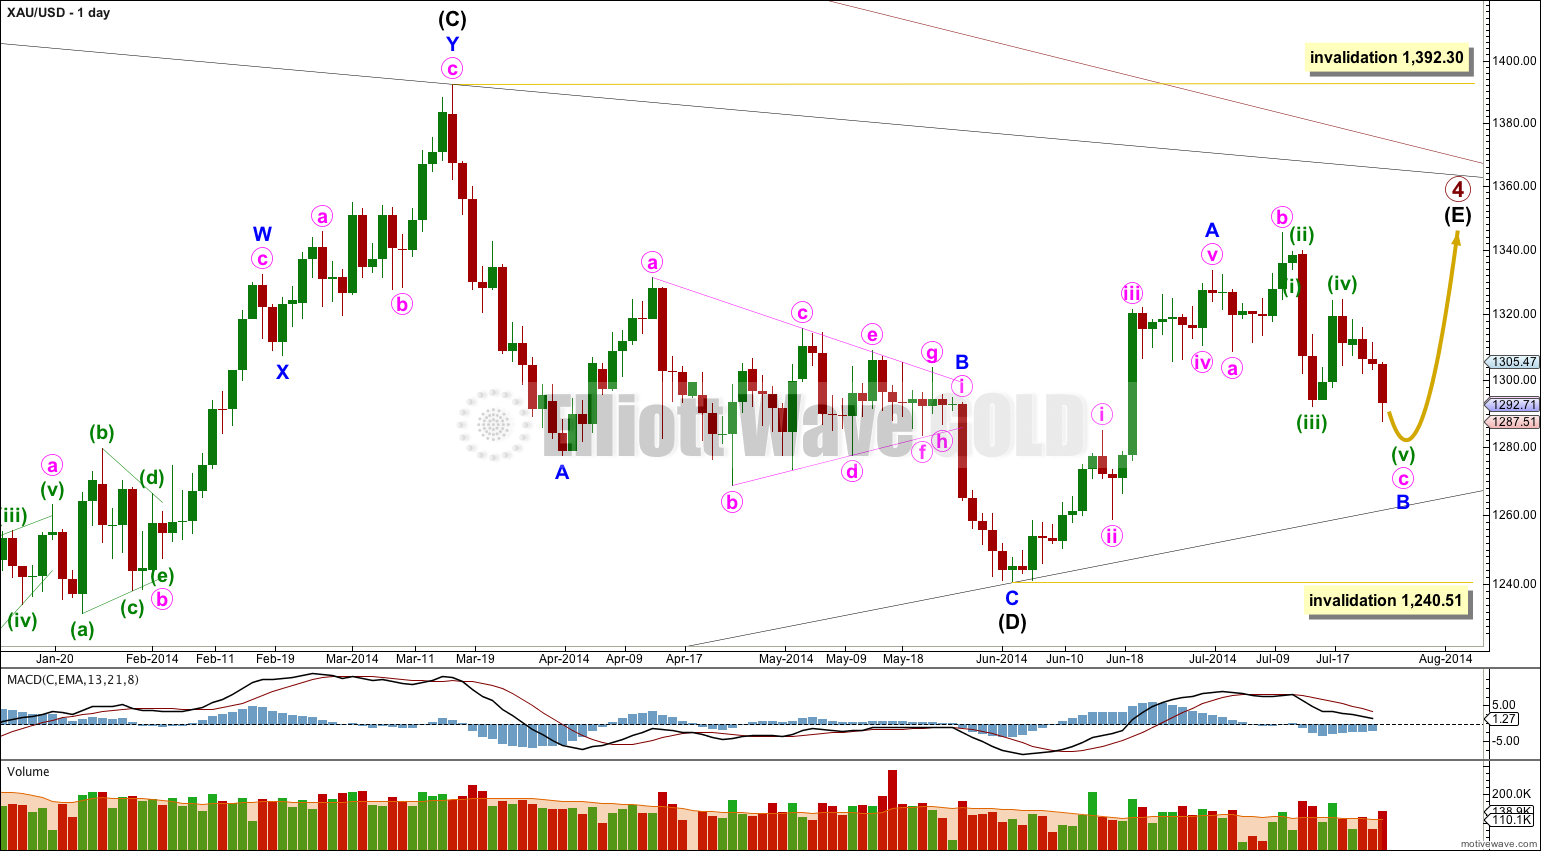
Primary wave 4 is an almost complete regular contracting triangle, now in its 56th week. Primary wave 2 lasted 53 weeks. The close proportion between primary waves 2 and 4 gives this wave count the right look on the weekly chart.
The final zigzag of intermediate wave (E) may still be a couple of weeks away from completion. Within it minor wave B may be an incomplete expanded flat. At 1,280 minute wave c would reach 2.618 the length of minute wave a, but this target looks to be too close.
Minor wave B may not move beyond the start of minor wave A below 1,240.51. However, downwards movement within intermediate wave (E) should adhere strongly to the triangle trend lines for primary wave 4. An intraday overshoot is acceptable, but if the lower black (B)-(D) trend line is breached by a full daily candlestick this wave count would be discarded in favour of the alternate below.
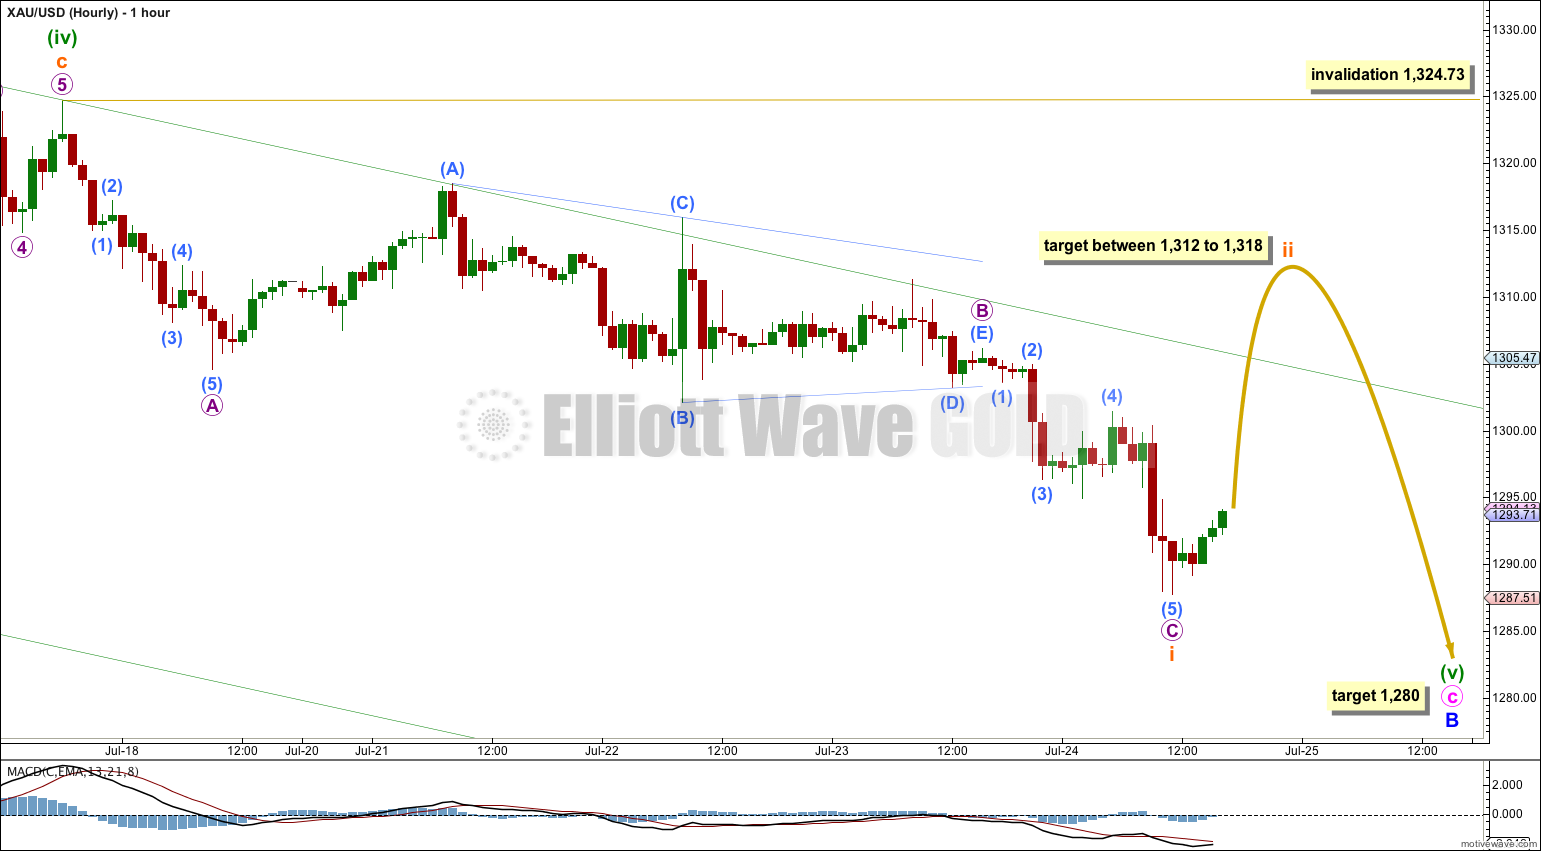
At the hourly chart level the clearest thing is the triangle for micro wave B. If my labeling of a triangle in this position is correct then it has a significant effect on the wave count and expectations for the next several days.
A triangle cannot be the sole corrective structure in a second wave position, and so minuette wave (v) may not be unfolding as an impulse. A triangle may only occur as a B wave, fourth wave, or within a bigger combination.
The triangle does not fit well at all as part of minuette wave (iv), and so it must be a B wave. This indicates that a diagonal is unfolding downwards for minuette wave (v) because within ending diagonals all the subwaves must be single zigzags.
At this stage it looks like micro wave C is complete and is 1.71 short of equality with micro wave A. Movement above 1,296.98 would give me confidence that subminuette wave ii upwards is underway as at that point upwards movement could not be a second wave correction within submicro wave (5) and so micro wave C and subminuette wave i would have to be over.
Within diagonals the second and fourth wave corrections are normally very deep, between 0.66 to 0.81 of the prior wave. Subminuette wave ii may end between 1,312 and 1,318. It should show up on the daily chart as at least one green candlestick. Subminuette wave ii may not move beyond the start of subminuette wave i above 1,324.73.
Overall if minuette wave (v) is unfolding as a diagonal it should show very choppy overlapping movement, generally trending downwards, for several days yet.
Alternate Daily Wave Count.
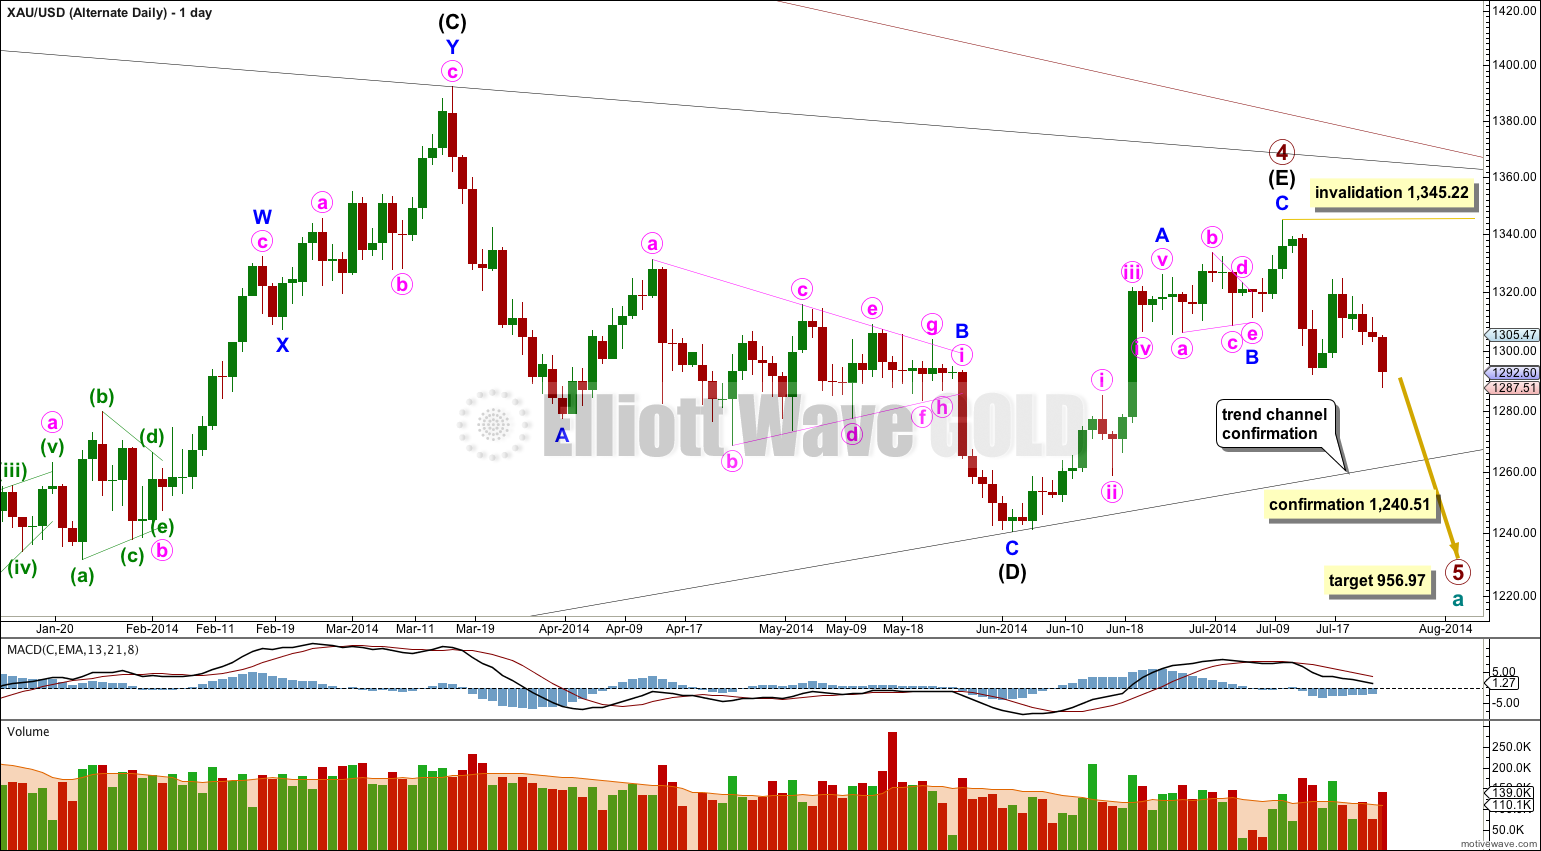
It is more likely today that primary wave 4 is complete in a total 54 weeks, just one short of a Fibonacci 55 and just one week longer than primary wave 2 which was 53 weeks in duration.
The subdivisions for this alternate do not have as neat a fit as the main wave count:
– The triangle for minor wave B has an overshoot of the b-d trend line within minute wave c which looks significant on the hourly chart.
– At the end of minor wave A minute wave v does not subdivide well as a five wave structure on the hourly chart. This movement fits better as a three.
– Minor wave C subdivides here as a five wave structure, but it has a much better fit as a zigzag (which is how the main wave count sees it).
For the three reasons above this alternate has a lower probability. I would judge it at this stage to have about a 30% probability.
The differentiating point is the lower (B)-(D) trend line here on the daily chart. If this trend line is breached by a full daily candlestick below it and not touching it then I would discard the main wave count and this alternate would be my only wave count.
At 956.97 primary wave 5 would reach equality in length with primary wave 1. Primary wave 1 was a remarkably brief three weeks in duration. Primary wave 5 could also be as brief, but it is more likely to show a little alternation and be longer lasting.
This analysis is published about 05:01 p.m. EST.