
Sideways movement continues as expected from yesterday’s sole Elliott wave count. It now shows as two red doji candlesticks on the daily chart. The target remains the same.
Summary: Sideways movement is extremely close to completion. Price should break out upwards and show a strong increase in momentum. I expect this next wave up to be a third wave about $14 in length, but it could be longer than that. A break above 1,332.18 would give me confidence that the third wave up has begun.
Click on charts to enlarge.
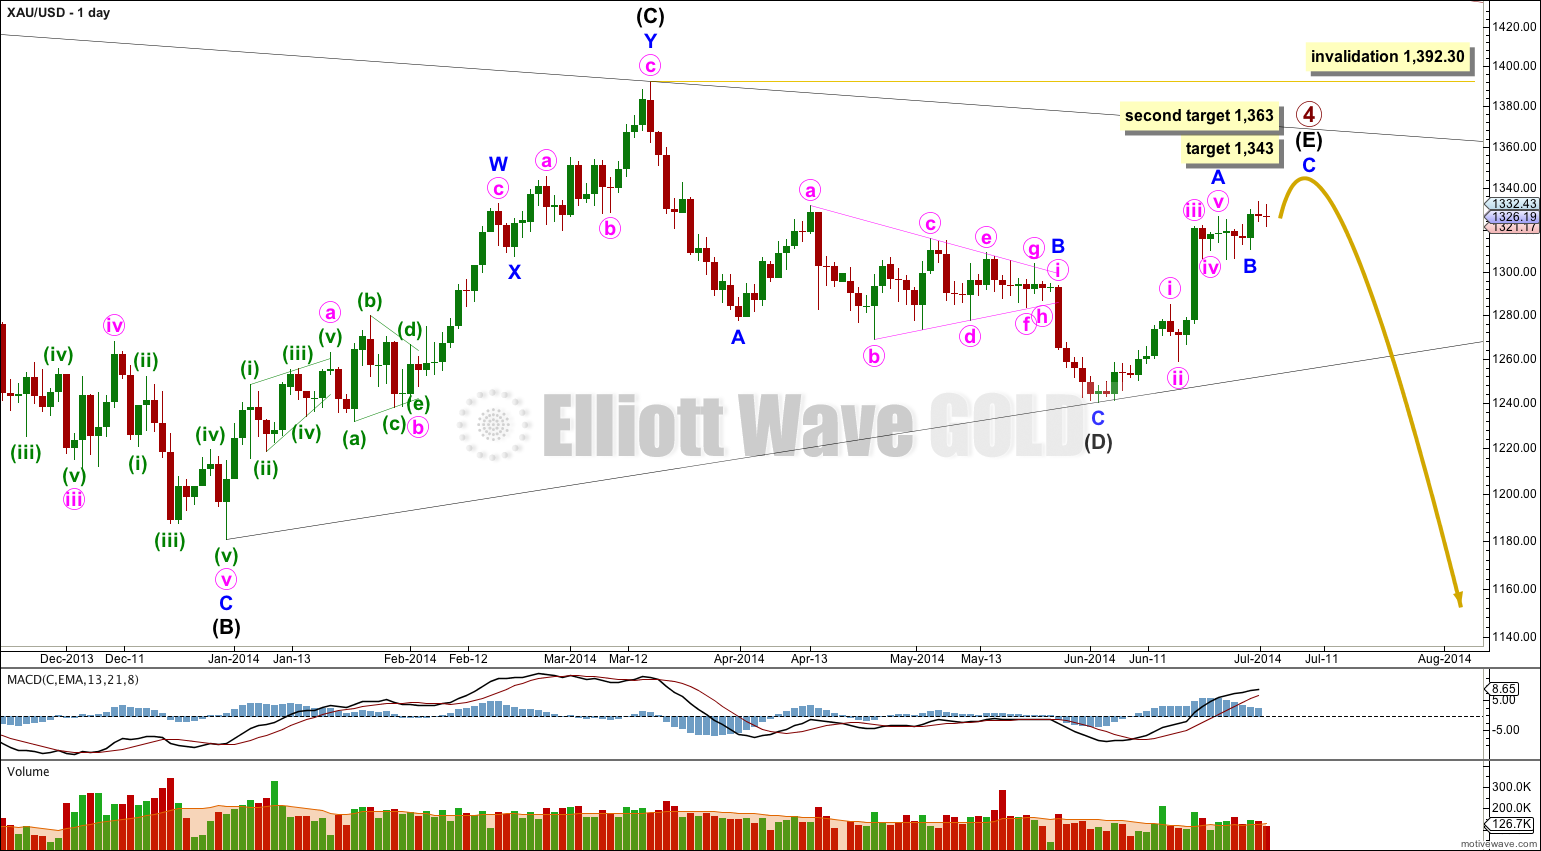
Primary wave 4 is very close to completion as a regular contracting triangle.
Intermediate wave (E) is most likely to fall short of the (A)-(C) trend line. It may also overshoot this trend line, but that is less common. If it does overshoot this trend line then it may find resistance, and end, at the upper edge of the bigger maroon channel on the weekly chart.
Within the zigzag of intermediate wave (E) at 1,343 minor wave C would reach 0.382 the length of minor wave A and intermediate wave (E) would end before the (A)-(C) trend line. The next likely place for minor wave C to end would be at 1,363 where it would reach 0.618 the length of minor wave A. Minor wave C cannot reach equality with minor wave A because that would take price above the invalidation point.
When there is more structure within minor wave C to analyse I will be able to calculate a target for it to end at minute degree. At that stage I will be able to determine which of the two targets is more likely. At this stage I favour the lower target because it would see intermediate wave (E) end comfortably short of the (A)-(C) trend line which is more typical.
So far within primary wave 4 intermediate wave (A) lasted 43 days (no Fibonacci relationship), intermediate wave (B) lasted 88 days (just one day short of a Fibonacci 89), intermediate wave (C) lasted 53 days (just two days short of a Fibonacci 55) and intermediate wave (D) lasted 56 days (just one day more than a Fibonacci 55). So far intermediate wave (E) has lasted 21 days and is incomplete. It may complete in a total Fibonacci 34 days (give or take one day either side of this) or it may not exhibit a Fibonacci duration.
Sideways movement for the last two days is proving typically difficult to analyse, and I expect this is because it is incomplete.
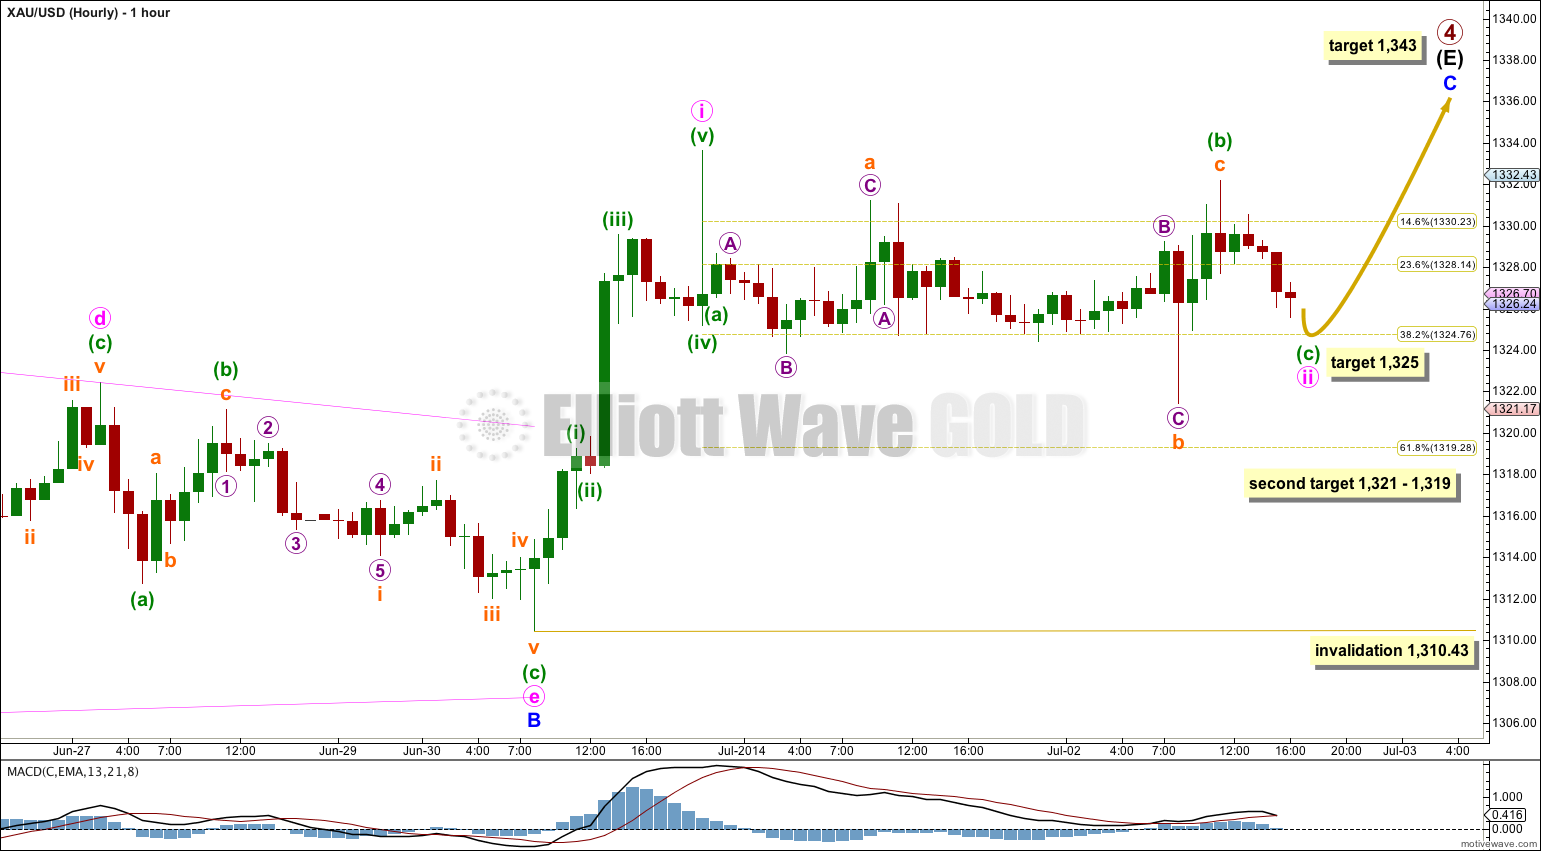
Minute wave ii may be completing as a shallow zigzag. Within it minuette wave (b) is a typically time consuming correction which subdivides as an expanded flat.
At 1,325 minuette wave (c) would reach equality in length with minuette wave (a). If price moves below this first (more likely) target then the next expectation for it to end would be at 1,321 where minuette wave (c) would reach 1.618 the length of minuette wave (a), to 1,319 where minuette wave ii would be 0.618 the length of minuette wave i.
I expect this correction to be over well within the next 24 hours, as it is most likely that minute wave ii will not show another red candlestick on the daily chart.
No matter where minute wave ii ends I will have confidence at this stage that it is over when price moves above 1,332.18. At that stage upwards movement could not be a second wave correction within minuette wave (c) and so minuette wave (c) and minute wave ii would have to be over.
When I know where minute wave ii has ended then I can calculate a target for you for minute wave iii. I cannot do that yet. I expect minute wave iii to most likely be 0.618 the length of minute wave i at about $14 in length because I expect intermediate wave (E) to fall short of the (A)-(C) trend line on the daily chart.
This analysis is published about 05:00 p.m. EST.
1310 breached, could that be it ?