
Sideways movement was not expected as most likely. The alternate wave count has increased in probability.
Summary: I expect that Gold is within a B wave. I expect to see choppy overlapping movement for a few more days before it is done. It may end about 1,297.25.
Click on charts to enlarge.
Main Wave Count.
Sideways movement for Monday took price out of the channel on the hourly chart before a clear five wave structure downwards had completed. This significantly reduces the probability of what was my last main wave count and increases the probability of this wave count.
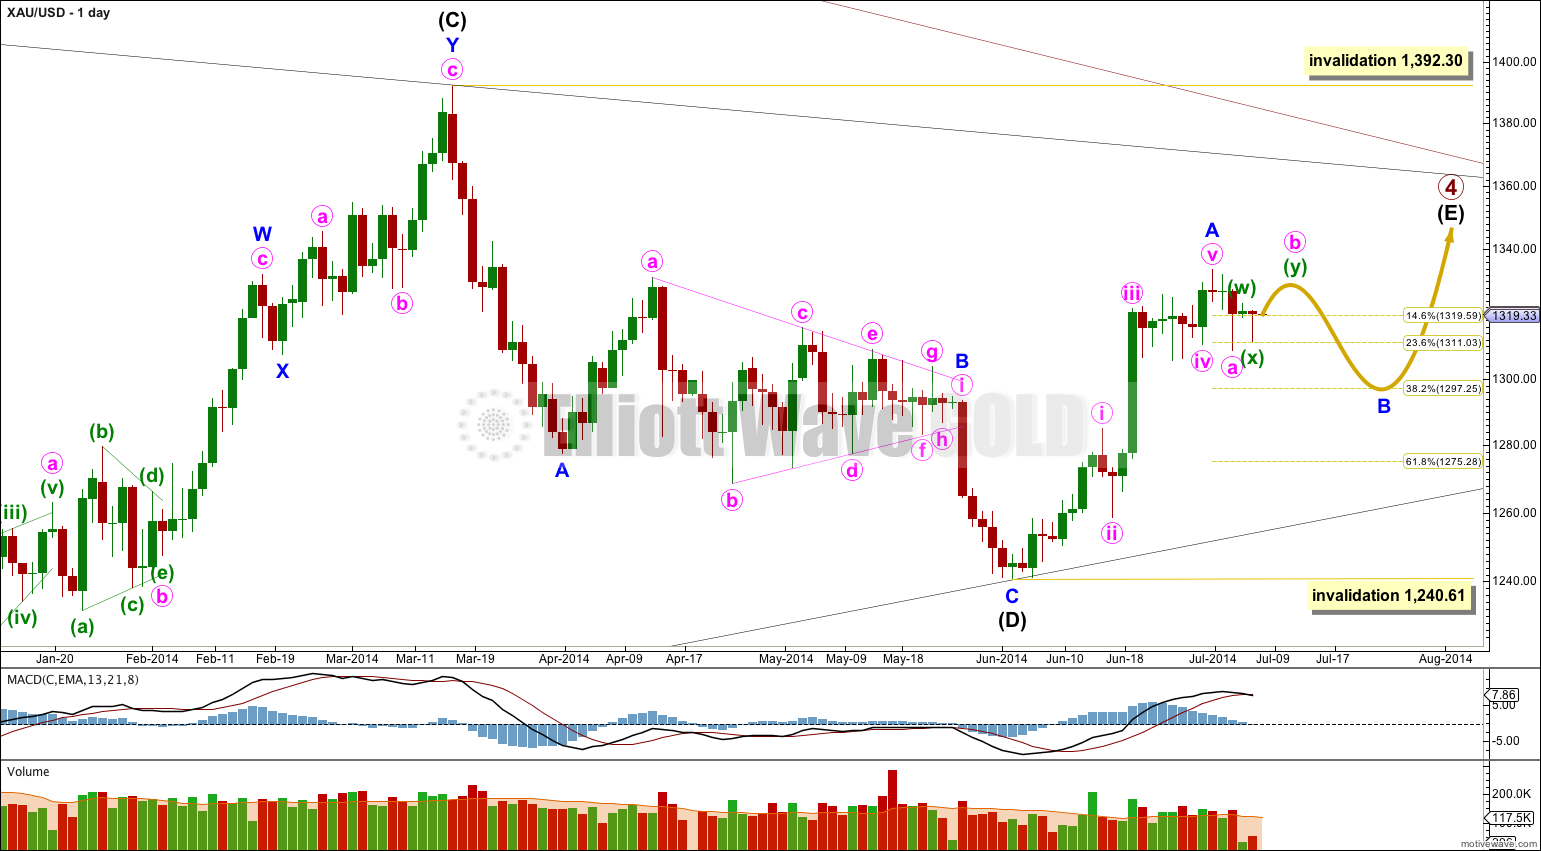
It is now more likely that only minor wave A is complete and sideways movement is an incomplete minor wave B. This wave count could see primary wave 4 last another two weeks to complete in a total Fibonacci 55 weeks which would be very satisfying analytically.
If minor wave B moved substantially lower it should find very strong resistance at the (B)-(D) trend line. A breach of this trend line would look very atypical and at that stage this main wave count would significantly reduce in probability, so much so I may discard it.
Minor wave B may not move beyond the start of minor wave A below 1,240.61. Invalidation of this wave count at the daily chart level would provide full confidence in the alternate wave count.
Minor wave B should overall sideways over the next few days, and may end about the 0.382 Fibonacci ratio of minor wave A at 1,297.25.
B waves exhibit the greatest variety in form and structure of all waves. They are often very choppy, overlapping range bound movements which are extremely difficult to analyse. Flexibility in analysis is essential during B waves. I will focus in identifying the end of this sideways movement over the next few days. When it is done price should break out to the upside.
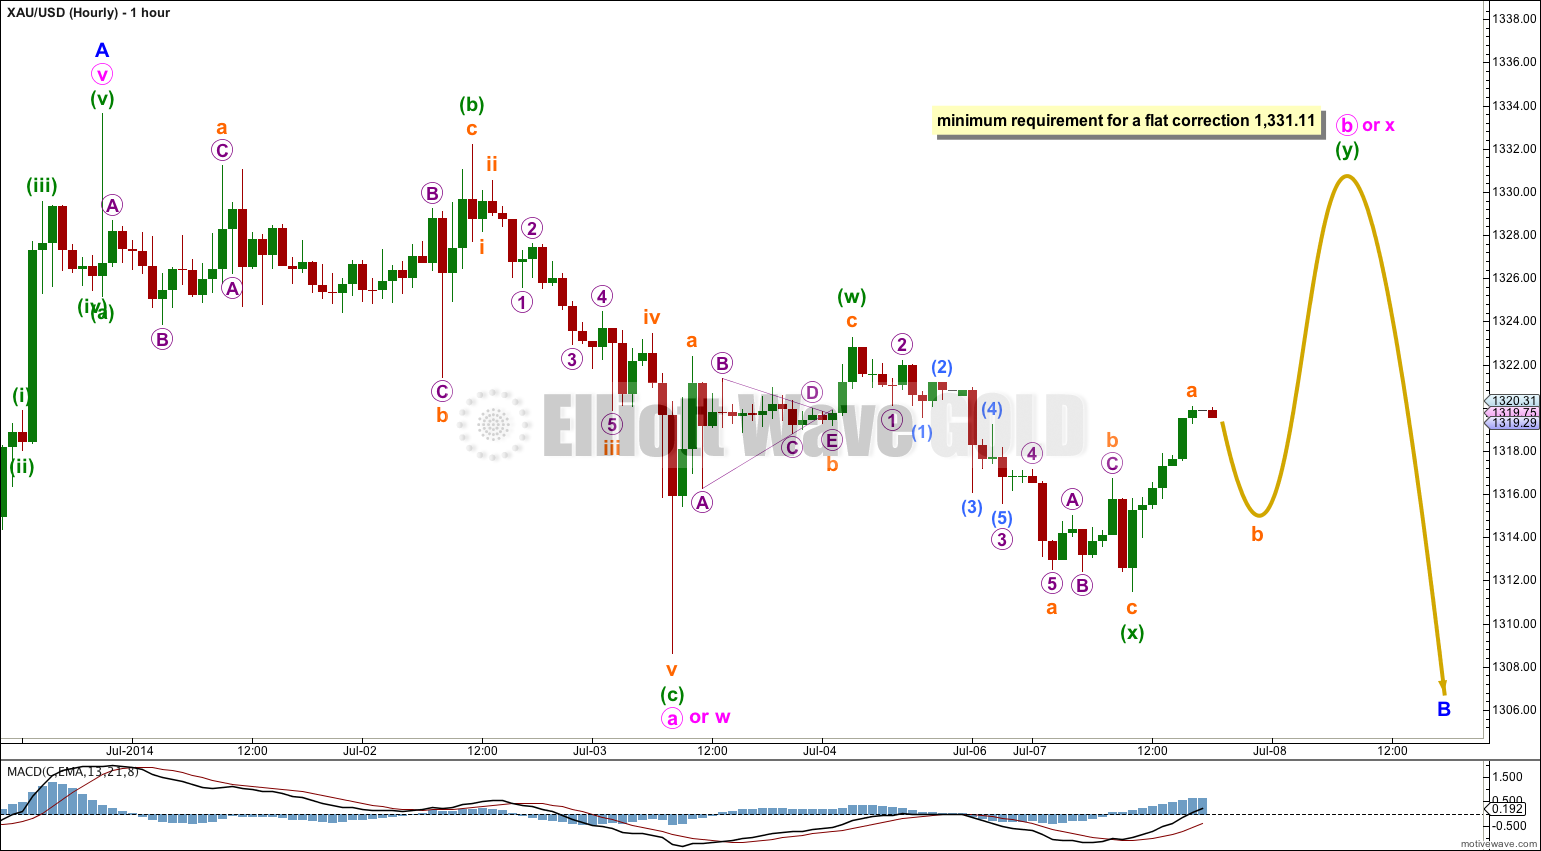
There is now not a clear five wave structure downwards on the hourly chart, but there is a clear three downwards. This fits better with this wave count.
Minor wave B may be unfolding as a flat correction, double combination, or double zigzag.
If minor wave B is a flat then minute wave a must subdivide as a three (it does) and minute wave b must also be a three and must reach up to 90% the length of minute wave a at 1,331.11 or above. Minute wave b may make a new high beyond the start of minute wave a at 1,333.61.
If minor wave B is a double combination then minute wave w is a zigzag so minute wave y may unfold as a flat or triangle. It has not yet begun, and minute wave x is most likely to move price higher first as X waves within combinations are normally quite deep.
If minor wave B is a double zigzag then minute wave w is a complete zigzag. Minute wave x may be over at the high labeled minuette wave (w) because X waves within double zigzags are normally quite shallow. Minute wave y may continue lower from here as a second zigzag to take minor wave B downwards to about the 0.382 Fibonacci ratio of minor wave A at 1,297.25.
Overall I am trying to present three ideas in this one chart. B waves are notoriously difficult to predict because they exhibit so much variety. The structure is incomplete and I expect more choppy overlapping sideways movement for at least another two days and probably a bit longer. When minor wave B is complete then minor wave C should break out upwards to new highs above the end of minor wave A at 1,333.61 to avoid a truncation.
Alternate Wave Count.
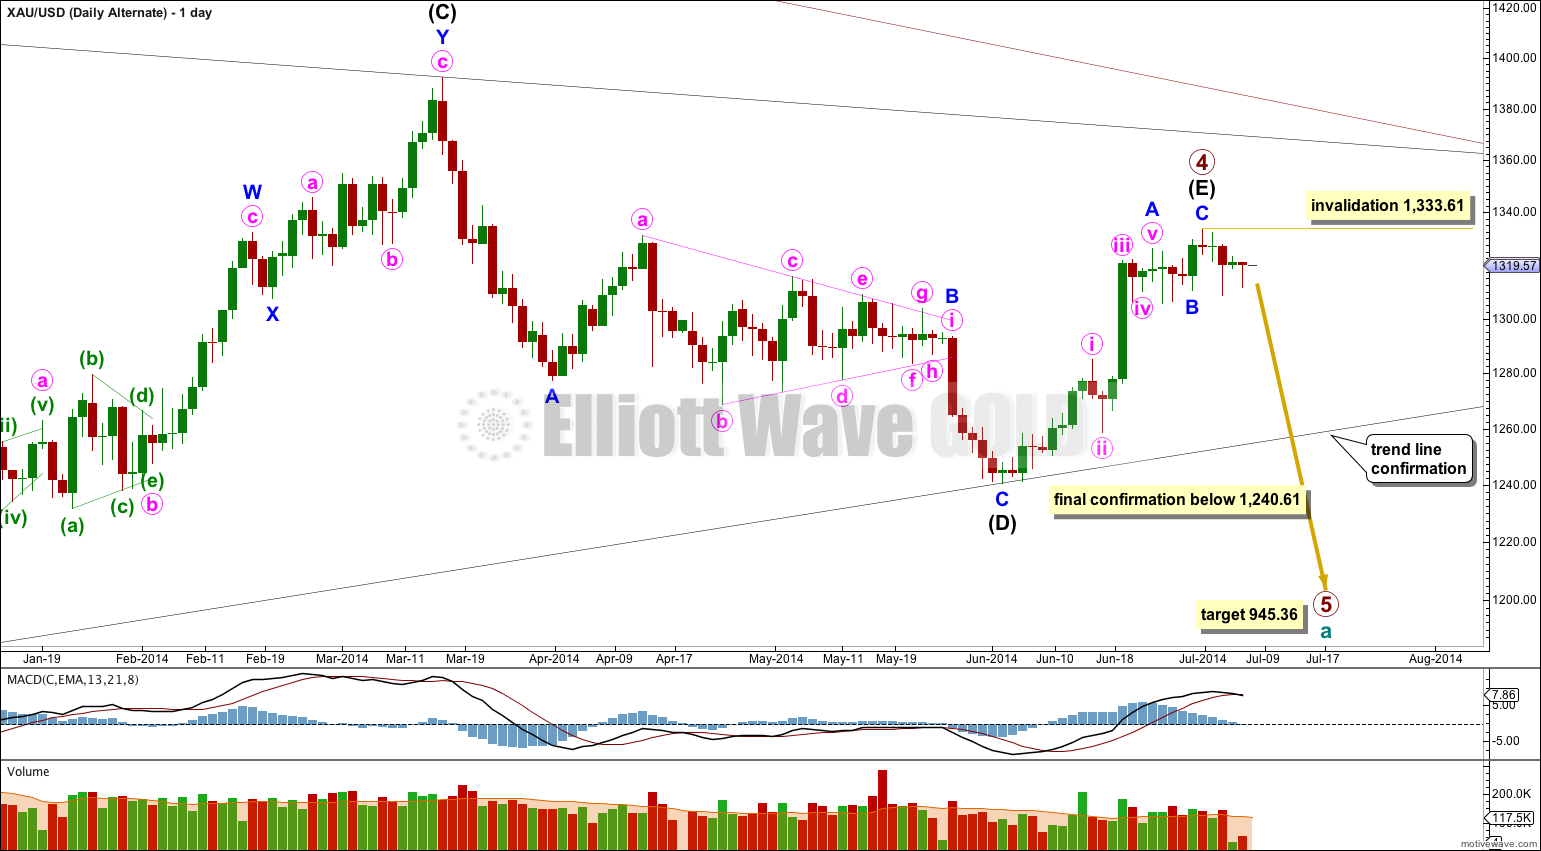
Primary wave 4 may be a complete regular contracting triangle.
Intermediate wave (E) may have ended in just 20 days, one short of a Fibonacci 21. E waves of triangles are often short and brief, and this one looks reasonably typical.
Within primary wave 5 downwards no second wave correction may move beyond the start of its first wave above 1,333.61. Any movement above this point would immediately invalidate this main wave count and clearly confirm the main wave count.
A clear breach of the (B)-(D) trend line would provide confidence in this alternate wave count. Thereafter, full confirmation would come with price movement below 1,240.61.
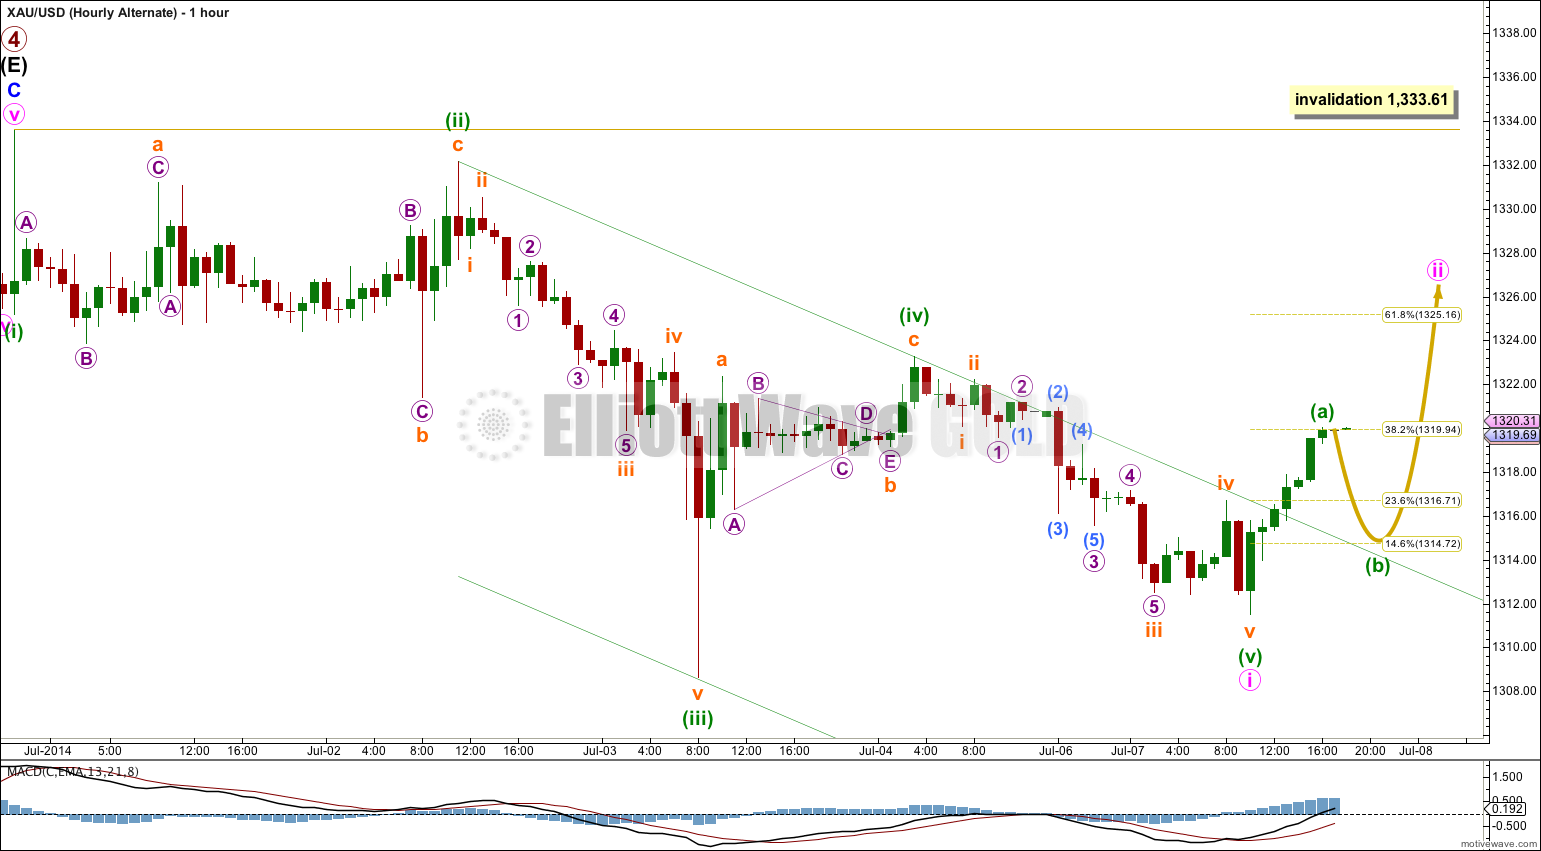
Sideways movement has again breached the channel, this time using Elliott’s second technique. That it did this before a new low is significant. There is now not a clear five down on the hourly chart which fits within a channel as an impulse should do.
To see a complete five down for minute wave i minuette wave (v) is significantly truncated. This reduces the probability of this wave count.
Minute wave ii would be incomplete and should move higher. It may end about the 0.618 Fibonacci ratio of minute wave i at 1,325.16.
Minute wave ii may not move beyond the start of minute wave i at 1,333.61.
This analysis is published about 07:03 p.m. EST.