
While the Elliott wave monthly chart looks fairly clear at this time, the Elliott wave daily chart is not. With GDX data I cannot look at subdivisions on any time frame below daily.
I have one monthly wave count and two daily charts for you this week.
Click charts to enlarge.
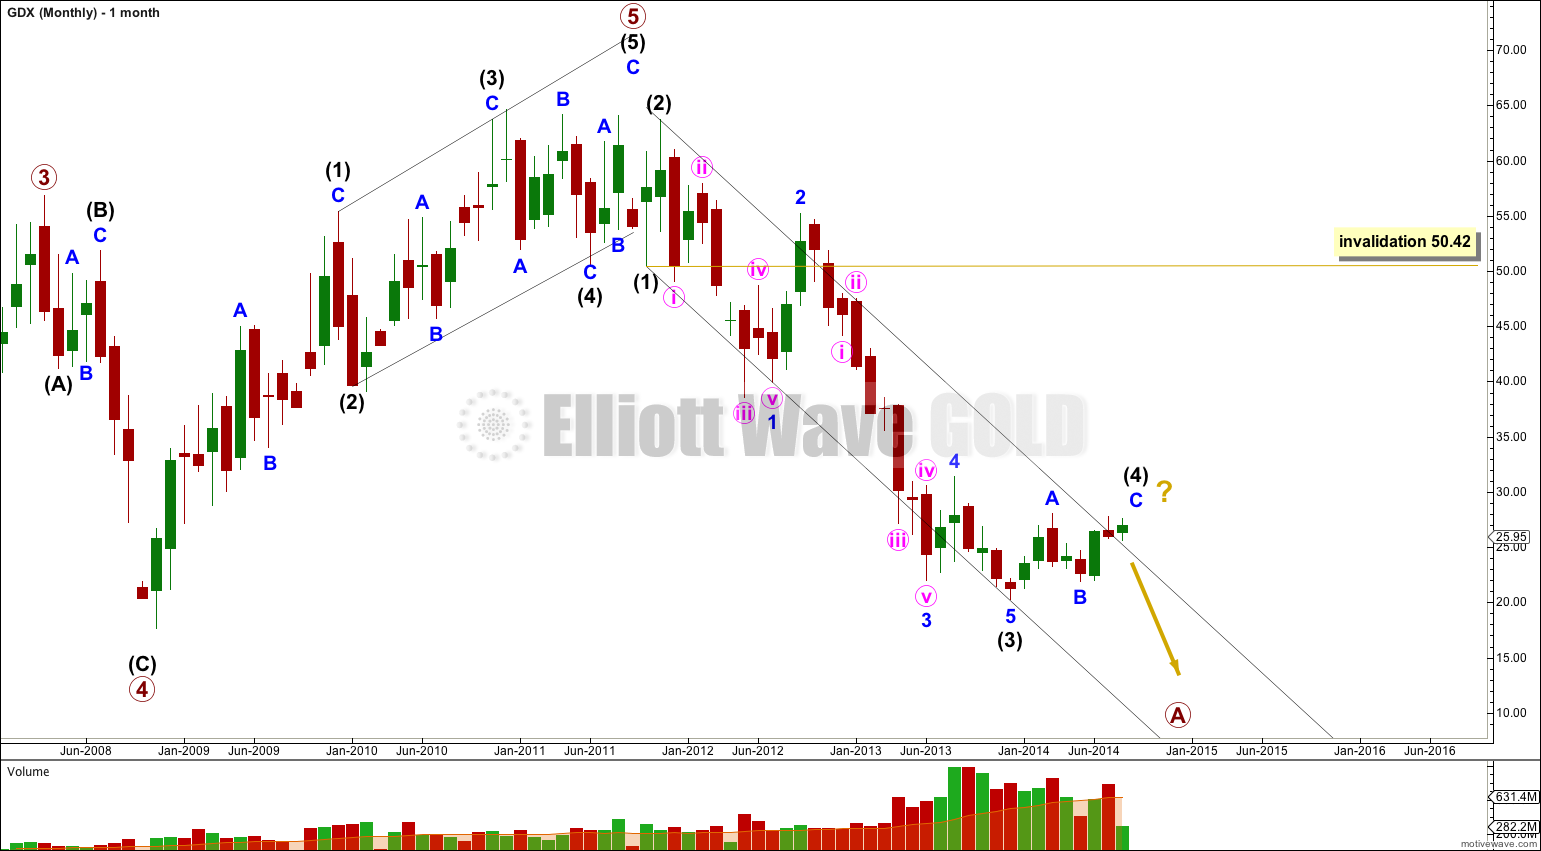
The clearest piece of movement is the downwards movement from the high. This looks most like a first, second and third wave. This may be the start of a larger correction.
Intermediate wave (3) is $1.06 longer than 2.618 the length of intermediate wave (1).
Within intermediate wave (3) there are no Fibonacci ratios between minor waves 1, 3 and 5.
Ratios within minor wave 1 of intermediate wave (3) are: minute wave iii has no Fibonacci ratio to minute wave i, and minute wave v is $2.19 longer than 0.618 the length of minute wave i.
Ratios within minor wave 3 of intermediate wave (3) are: minute wave iii has no Fibonacci ratio to minute wave i, and minute wave v is $0.63 longer than 0.382 the length of minute wave iii.
Draw a parallel channel about this downwards movement. Draw the first trend line from the lows of intermediate waves (1) to (3), then place a parallel copy upon the high of intermediate wave (2). Intermediate wave (4) found some resistance just above the upper edge of the channel.
Intermediate wave (4) may be over already, or it may continue further sideways or higher for another one to few weeks. Only movement below 21.93 would confirm that intermediate wave (4) is over and intermediate wave (5) is underway.
The two daily wave counts below are in no particular order. I am not confident that I know this market well enough at this stage (I only began analysing GDX in October 2013) to be able to judge how its structures normally look.
Daily Wave Count I.
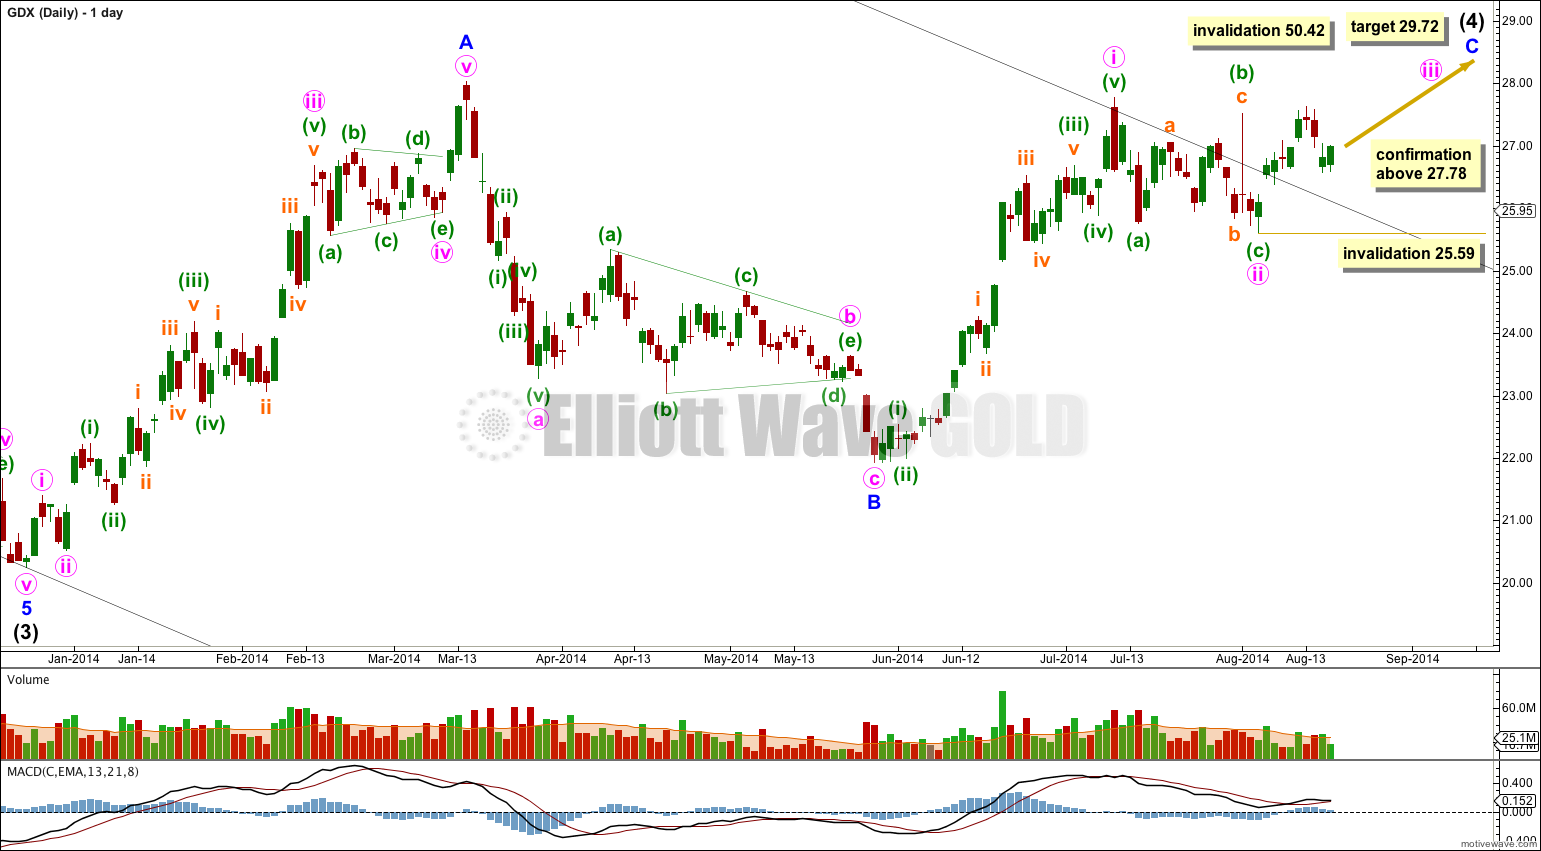
At 29.72 minor wave C would reach equality in length with minor wave A.
This would see intermediate wave (4) move comfortably outside the parallel channel on the monthly chart, copied over here to the daily chart (black trend line). I do not know how common this is for GDX, but it is reasonably common for all markets for fourth waves to not be contained within a channel drawn using Elliott’s first technique.
Within minor wave C minute waves iii and v may be shorter than minute wave i.
This wave count would be confirmed with movement above 27.78.
This first wave count sees the upwards wave for minor wave A as a five wave impulse. I think this has a slightly better fit than seeing this movement as a three.
Within minute wave iii no second wave correction may move beyond the start of its first wave below 25.59.
Daily Wave Count II.
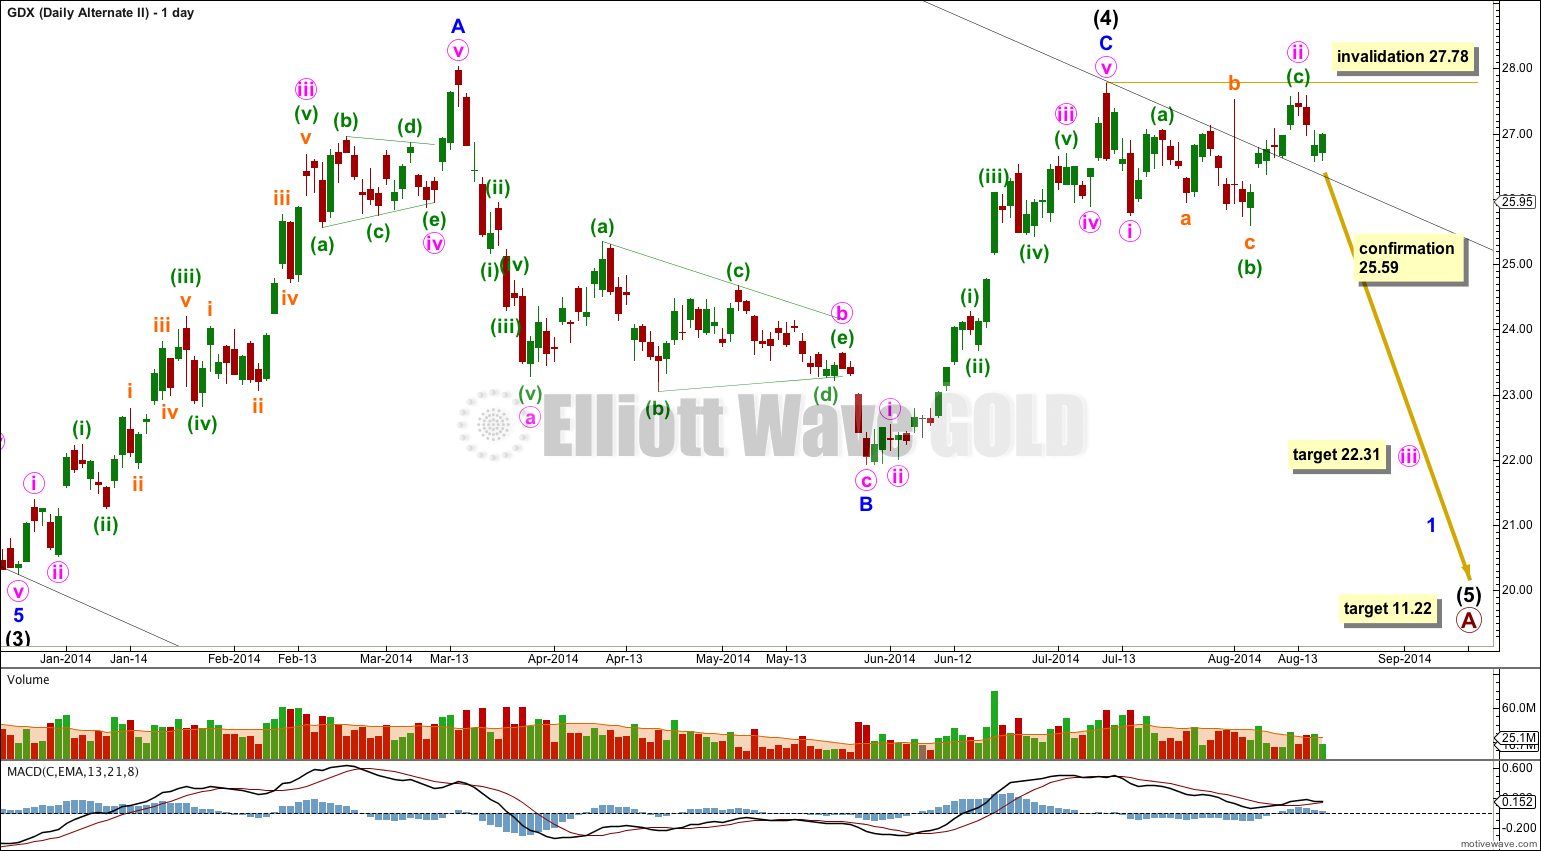
Intermediate wave (4) may be over with a very slightly truncated C wave (by 0.25).
If intermediate wave (5) has begun then within it a first and second wave are now very likely to be complete.
Minute wave ii is an expanded flat correction: within it minuette wave (b) is a 112% correction of minuette wave (a), and minuette wave (c) is just 0.08 short of 1.618 the length of minuette wave (a). Within minuette wave (b) subminuette wave b is also an expanded flat correction.
At 22.31 minute wave iii would reach 2.618 the length of minute wave i.
I would have confidence in this second wave count if the first wave count is invalidated with movement below 25.59.
At 11.22 intermediate wave (5) would reach equality in length with intermediate wave (1). This target is likely to be several weeks away.
If I was asked to pick a winner for GDX (which I don’t like to do) I would pick this second wave count. But the invalidation / confirmation points are now close by and it would be wiser to wait for one to be crossed.