
Upwards movement was expected for both the main and alternate Elliott wave counts of last analysis. I am adjusting my analysis of most recent movement, and this makes a difference to the confirmation/invalidation point and expectation of when we may have clarity.
Summary: I expect upwards movement for at least a few days, and most likely another 12 days to 1,346. If price breaches 1,305.27 I will have increased confidence in the target. Any movement to a new low below 1,273.03 would invalidate the main wave count and confirm primary wave 4 as over and primary wave 5 as underway. Because the (B)-(D) trend line is providing such strong support I have some more confidence that it may not be breached until there has been a new high above 1,345.22.
Click on charts to enlarge.
Main Wave Count.
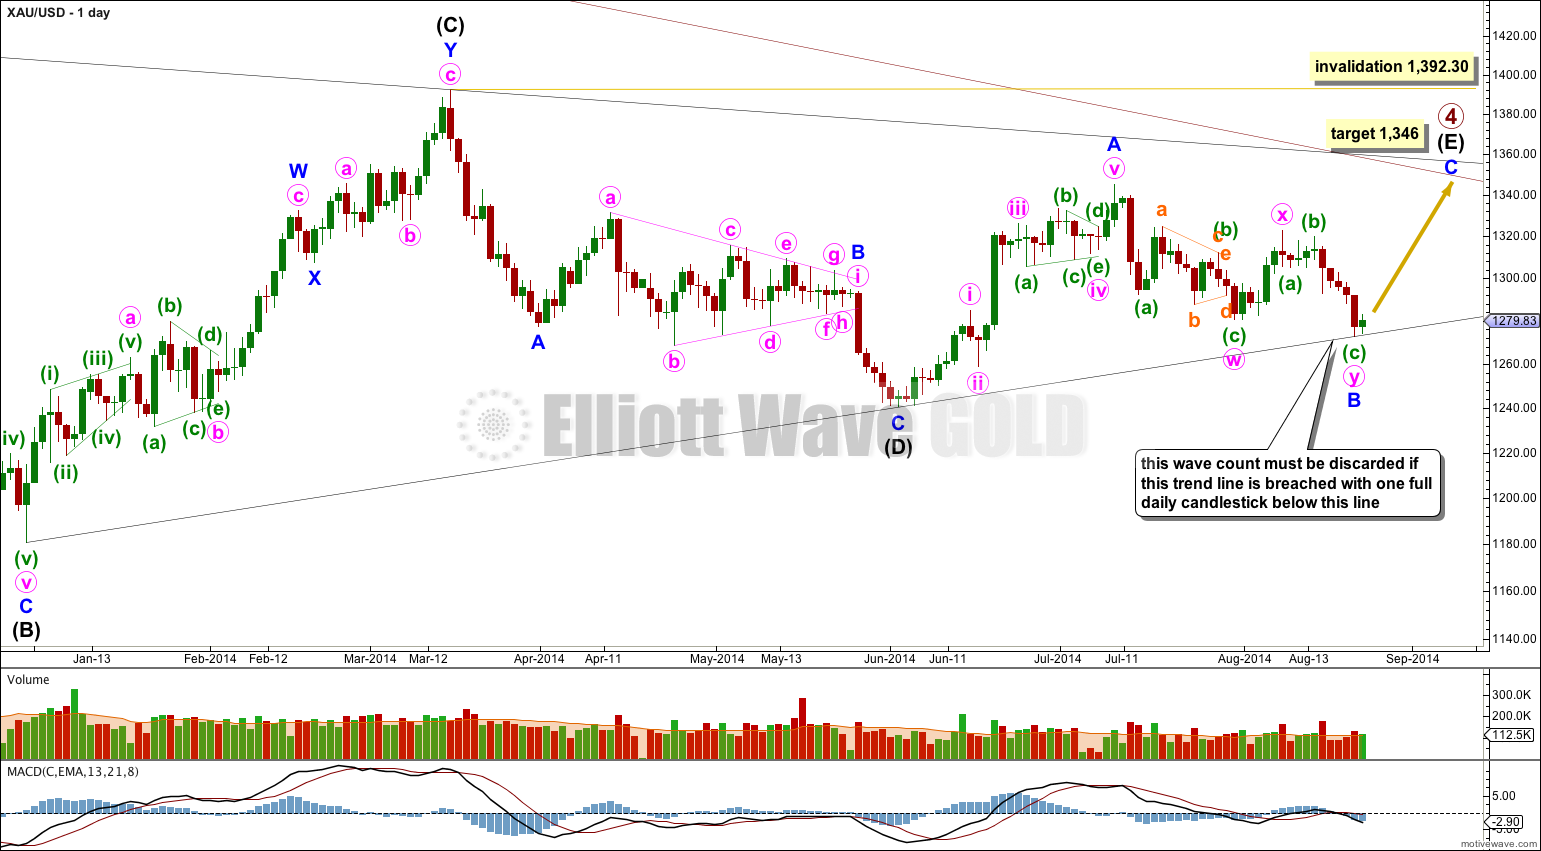
Primary wave 4 is an incomplete regular contracting triangle. Primary wave 2 was a deep 68% running flat correction. Primary wave 4 is showing alternation in depth and some alternation in structure.
Within the triangle of primary wave 4 intermediate wave (E) is unfolding as a zigzag: minor wave A is a five wave impulse and minor wave B downwards now fits as a completed double zigzag.
There are four nice examples of completed triangles on this daily chart. When triangles are complete the first movement out of them is most often quite swift and sharp. Importantly, this first movement does not hesitate at the B-D trend line and will plough straight through the trend line, which ceases to provide support or resistance. It is significant that at this stage the (B)-(D) trend line is still providing support to downwards movement. This is one reason why I consider this main wave count to have a higher probability.
If minor wave C is to avoid a truncation it should move above the end of minor wave A at 1,345.22. At 1,346 it would do this, and may end when price comes to touch the upper edge of the maroon channel copied over here from the weekly chart. This may see minor wave C last a Fibonacci 13 days in total.
The four examples of completed triangles here on the daily chart also show that the final subwave of a triangle most often ends comfortably short of the A-C trend line. The target at 1,346 would see this happen for primary wave 4.
Intermediate wave (E) may not move beyond the end of intermediate wave (C) above 1,392.30.
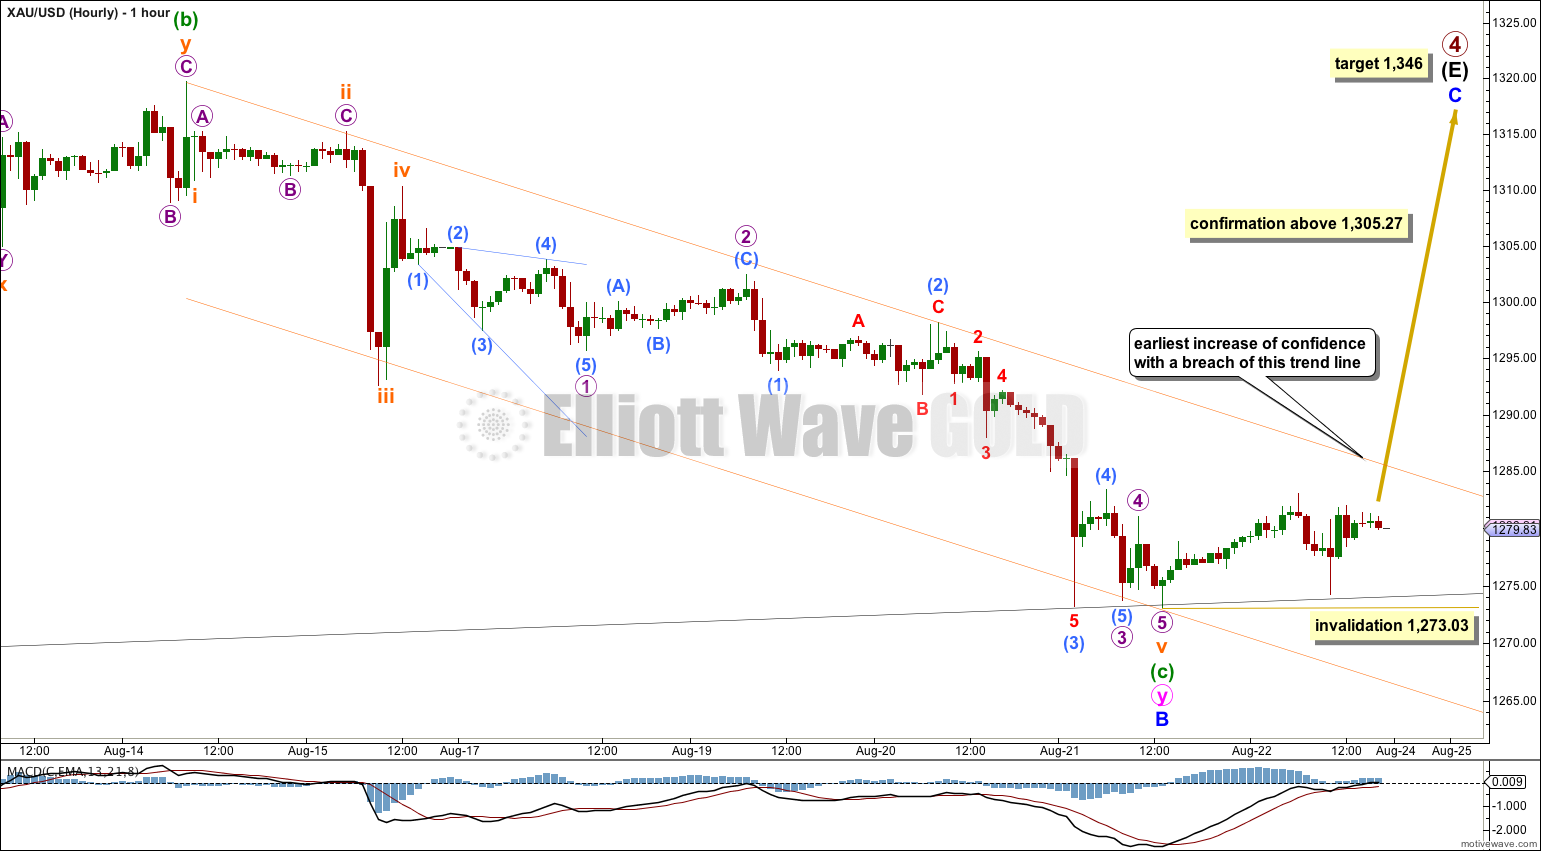
I have adjusted my analysis of minuette waves (b) and (c). I was concerned with last analysis having a gross disproportion between the fourth and second waves within the impulse of minuette wave (c), and as it was suggested minuette wave (c) may have ended with an extended fifth wave instead of an extended third, I find this wave count to have a better fit. This resolves the problem of proportion in the previous hourly wave count.
Minuette wave (b) is seen ending earlier, but it is still a double combination; flat – X – zigzag.
Minuette wave (c) is now just 0.68 longer than 2.618 the length of minuette wave (a).
Ratios within minuette wave (c) are: subminuette wave iii is 1.00 short of 2.618 the length of subminuette wave i, and subminuette wave v is 1.37 longer than 1.618 the length of subminuette wave iii.
Within the extended subminuette wave v there are no adequate Fibonacci ratios between micro waves 1, 3 and 5.
Ratios within micro wave 3 are: there is no adequate Fibonacci ratio between submicro waves (3) and (1), and submicro wave (5) is just 0.19 longer than 0.382 the length of submicro wave (3).
There is good alternation between subminuette waves ii and iv: subminuette wave ii is a relatively shallow 49% flat correction, and subminuette wave iv is a relatively deep 78% zigzag.
Minuette wave (c) does not fit into a channel drawn using Elliott’s techniques. This channel is a “best fit”, and the upper trend line particularly does seem to be showing nicely where price is finding some resistance. When this trend line is clearly breached that shall be the first indication that this wave count may be correct and confidence will increase at that point.
Movement above 1,305.27 would provide full invalidation of the alternate at the hourly and daily chart levels and would provide full confidence in this main wave count and the target. This may happen next week.
Within minor wave C no second wave correction may move beyond the start of its first wave below 1,273.03.
Alternate Daily Wave Count
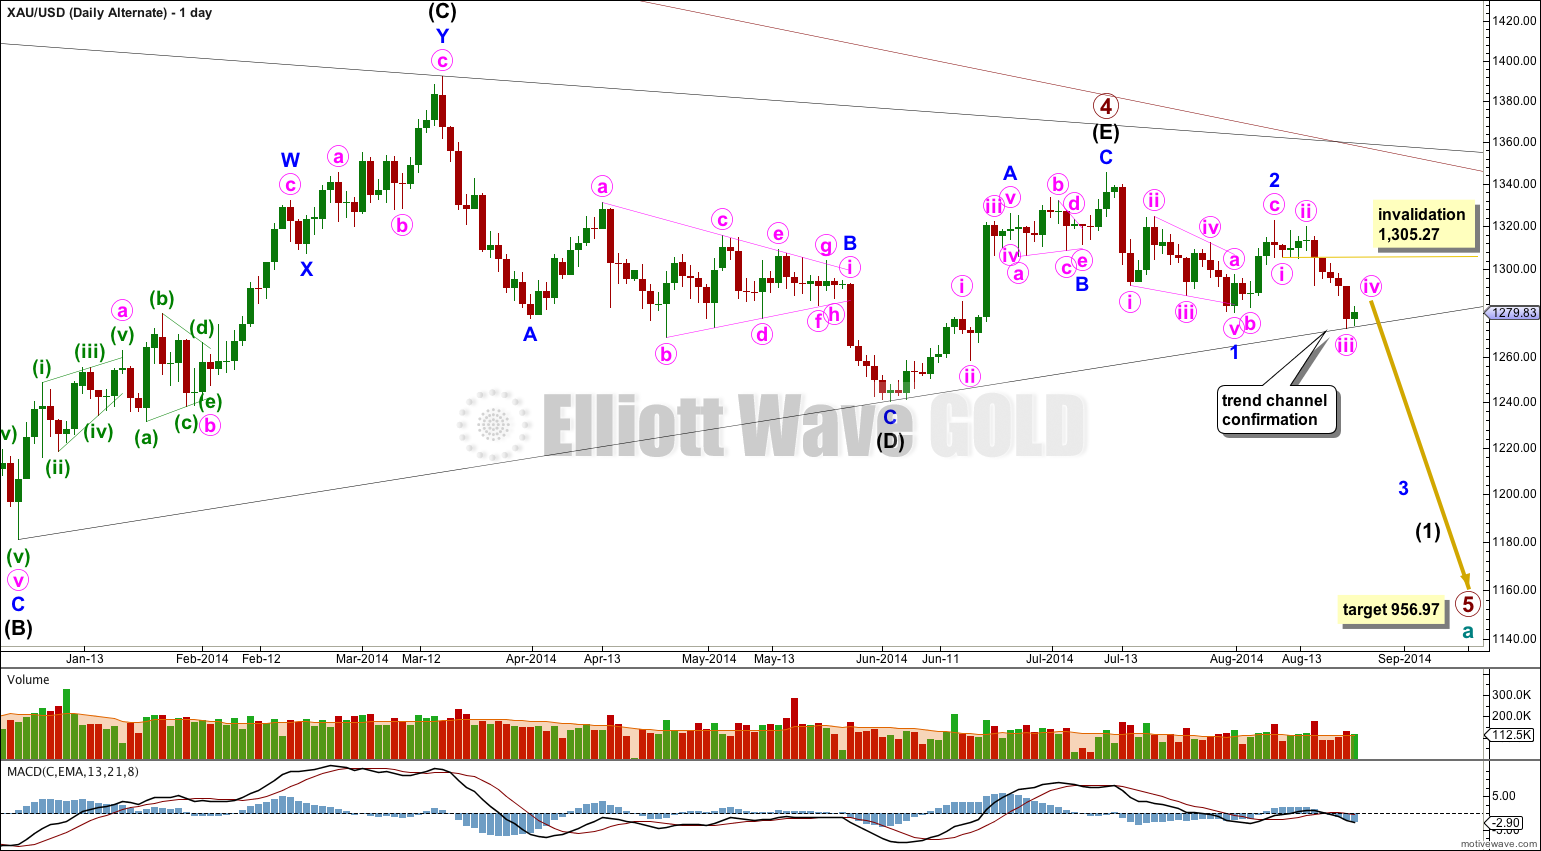
It is possible that primary wave 4 is over at the high of 1,345.22. This wave count still requires confirmation with a clear breach of the (B)-(D) trend line on this daily chart.
If primary wave 4 is over then primary wave 5 downwards would reach equality in length with primary wave 1 at 956.97. Primary wave 1 was a remarkably brief 3 weeks duration. I would expect primary wave 5 to last some months, and is already longer than one month.
The only structure which fits for minor wave 1 is a leading contracting diagonal. While leading diagonals are not rare, they are not very common either. This slightly reduces the probability of this wave count.
Within diagonals the second and fourth waves are commonly between 0.66 to 0.81 the prior wave. Here minute wave ii is 0.61 the length of minute wave i, just a little shorter than the common length, slightly reducing the probability of this wave count. Minute wave iv is 0.66 the length of minute wave iii, just within the common length.
Leading diagonals in first wave positions are normally followed by very deep second wave corrections. Minor wave 2 is deep at 65% the length of minor wave 1, but this is not “very” deep. This again very slightly reduces the probability of this wave count.
The biggest problem I have with this wave count and the main reason for it still being an alternate is the leading diagonal following the end of the triangle for primary wave 4. When triangles end the first piece of movement out of the triangle is almost always very strong and swift. Diagonals are not strong and swift movements. To see a first wave out of a triangle subdividing as a diagonal is highly unusual and does not at all fit with typical behaviour.
Also, today price is continuing to find strong support at the (B)-(D) trend line, which should have ceased to provide any support or resistance if the triangle was over. This is unusual and further reduces the probability of this alternate wave count.
Within minor wave 3 minute wave iv may not move into minute wave i price territory above 1,305.27.
A clear breach of the lower (B)-(D) trend line of the primary wave 4 triangle would provide full and final confirmation of this alternate. A full daily candlestick below that trend line would provide me with 100% confidence in this wave count.
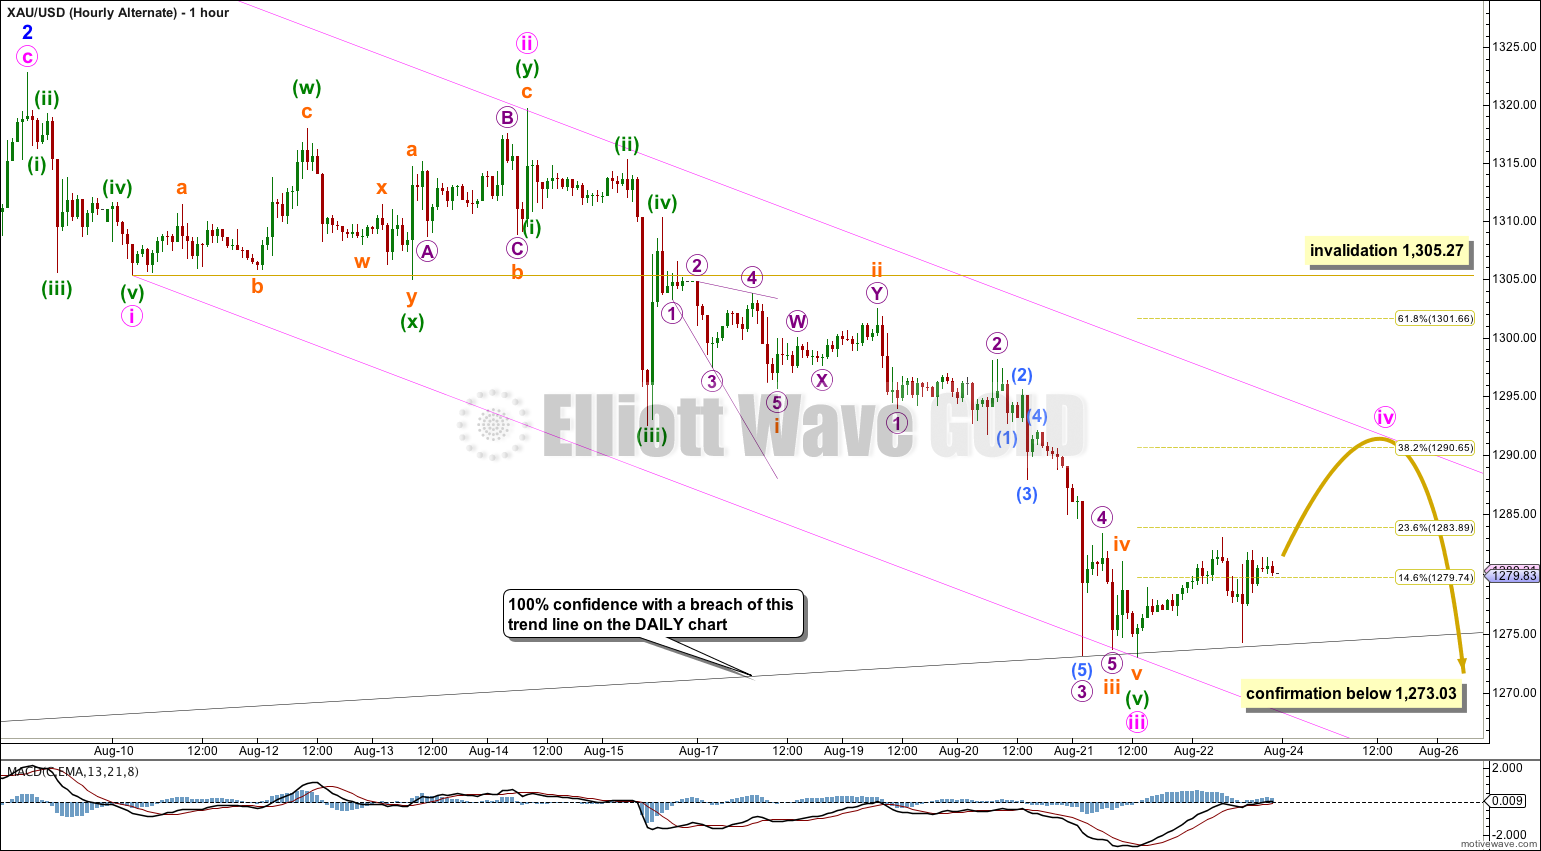
This wave count has been adjusted in the same way as the main hourly wave count. This wave count and the main hourly wave count see the subdivisions of recent movement in the same way: A-B-C and 1-2-3 have exactly the same subdivisions.
The channel drawn here uses Elliott’s first technique: draw the first trend line from the lows of minute waves i to iii, then place a parallel copy on the high of minute wave ii. I would expect minute wave iv to find resistance at the upper pink trend line. If this trend line is breached this wave count will further slightly reduce in probability, but fourth waves are not always contained within these channels and just a breach does not invalidate this wave count. Only movement above 1,305.27 would do that.
Minute wave ii was a very deep 82% double combination. Minute wave iv would most likely be a relatively shallow zigzag or zigzag multiple. It would most likely end about the 0.382 Fibonacci ratio of minute wave iii at 1,290.65.
Minute wave ii lasted three days so minute wave iv should be about the same duration so that their proportions are somewhat similar and the wave count has the right look.
For this alternate when minute wave iv is over minute wave v downwards would most likely be an extended wave so that minor wave 3 ends far enough below the end of minor wave 1 to allow room for upwards movement for the following correction of minor wave 4.
Any movement at any time below the black (B)-(D) trend line would immediately increase the probability of this wave count. A full daily candlestick below that trend line would see the main wave count firmly discarded in favour of this alternate. I expect that is quite unlikely.
After further analysis and judgement I would consider this alternate (or any variation of it which sees primary wave 4 as over) to have only about a 20% probability, with the main wave count an 80% probability.
This analysis is published about 09:55 p.m. EST.
Lara,
Could minute wave iv, in your alternate count, be forming a triangle? Any Elliott rules that would discredit this idea? Thanks.
opp….just busted out of that triangle.
It works. It looks like a regular barrier triangle. The B-D trend line is essentially flat.