
Downwards movement fits the alternate wave count better, but is not enough for final clarity.
Both Elliott wave counts remain valid and the mid term outlook for them is exactly the same.
Summary: The main hourly wave count has decreased in probability and the alternate has increased. Both have the same target at 1,346, but differ in the short term expectation. While price remains above 1,281.36 the main wave count will still be preferred, and it expects the middle of a third wave up to begin. If price breaks below 1,281.36 I expect downwards movement to again touch the black (B)-(D) trend line on the daily chart before the third wave begins.
Click on charts to enlarge.
Main Wave Count.
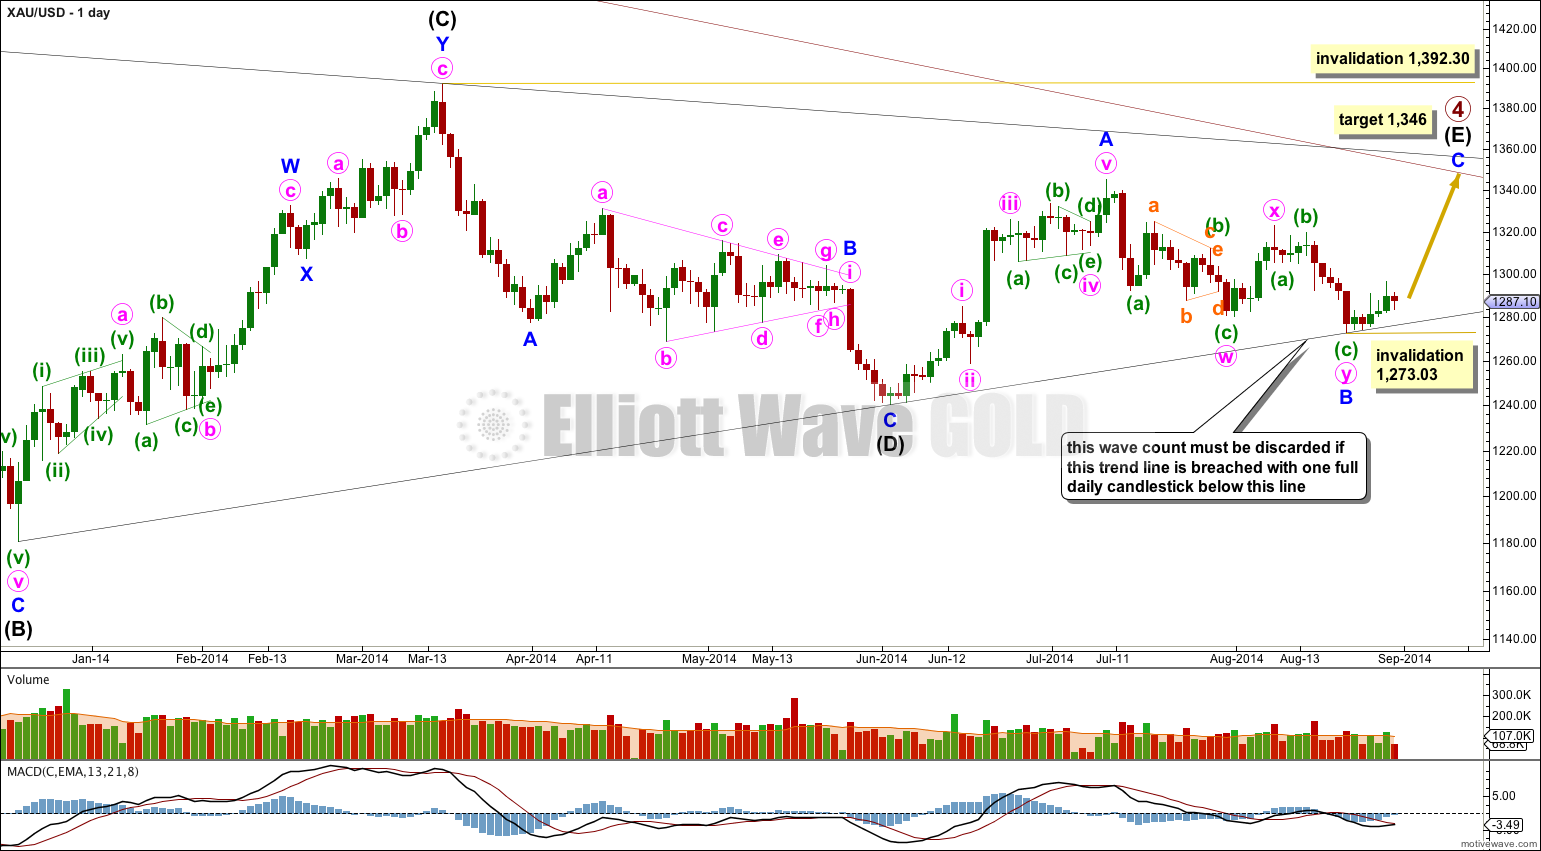
Primary wave 4 is an incomplete regular contracting triangle. Primary wave 2 was a deep 68% running flat correction. Primary wave 4 is showing alternation in depth and some alternation in structure.
Within the triangle of primary wave 4 intermediate wave (E) is unfolding as a zigzag: minor wave A is a five wave impulse and minor wave B downwards now fits as a completed double zigzag.
There are four nice examples of completed triangles on this daily chart. When triangles are complete the first movement out of them is most often quite swift and sharp. Importantly, this first movement does not hesitate at the B-D trend line and will plough straight through the trend line, which ceases to provide support or resistance. It is significant that at this stage the (B)-(D) trend line is still providing support to downwards movement. This is one reason why I consider this main wave count to have a higher probability.
If minor wave C is to avoid a truncation it should move above the end of minor wave A at 1,345.22. At 1,346 it would do this, and may end when price comes to touch the upper edge of the maroon channel copied over here from the weekly chart. This may see minor wave C last a Fibonacci 13 days in total. Please note, this time expectation is a rough guideline only. Gold does sometimes exhibit Fibonacci durations, but not often enough to be relied upon.
The four examples of completed triangles here on the daily chart also show that the final subwave of a triangle most often ends comfortably short of the A-C trend line. The target at 1,346 would see this happen for primary wave 4.
Intermediate wave (E) may not move beyond the end of intermediate wave (C) above 1,392.30.
Within minor wave C no second wave correction may move beyond the start of its first wave below 1,273.03.
Hourly Wave Count – Main.
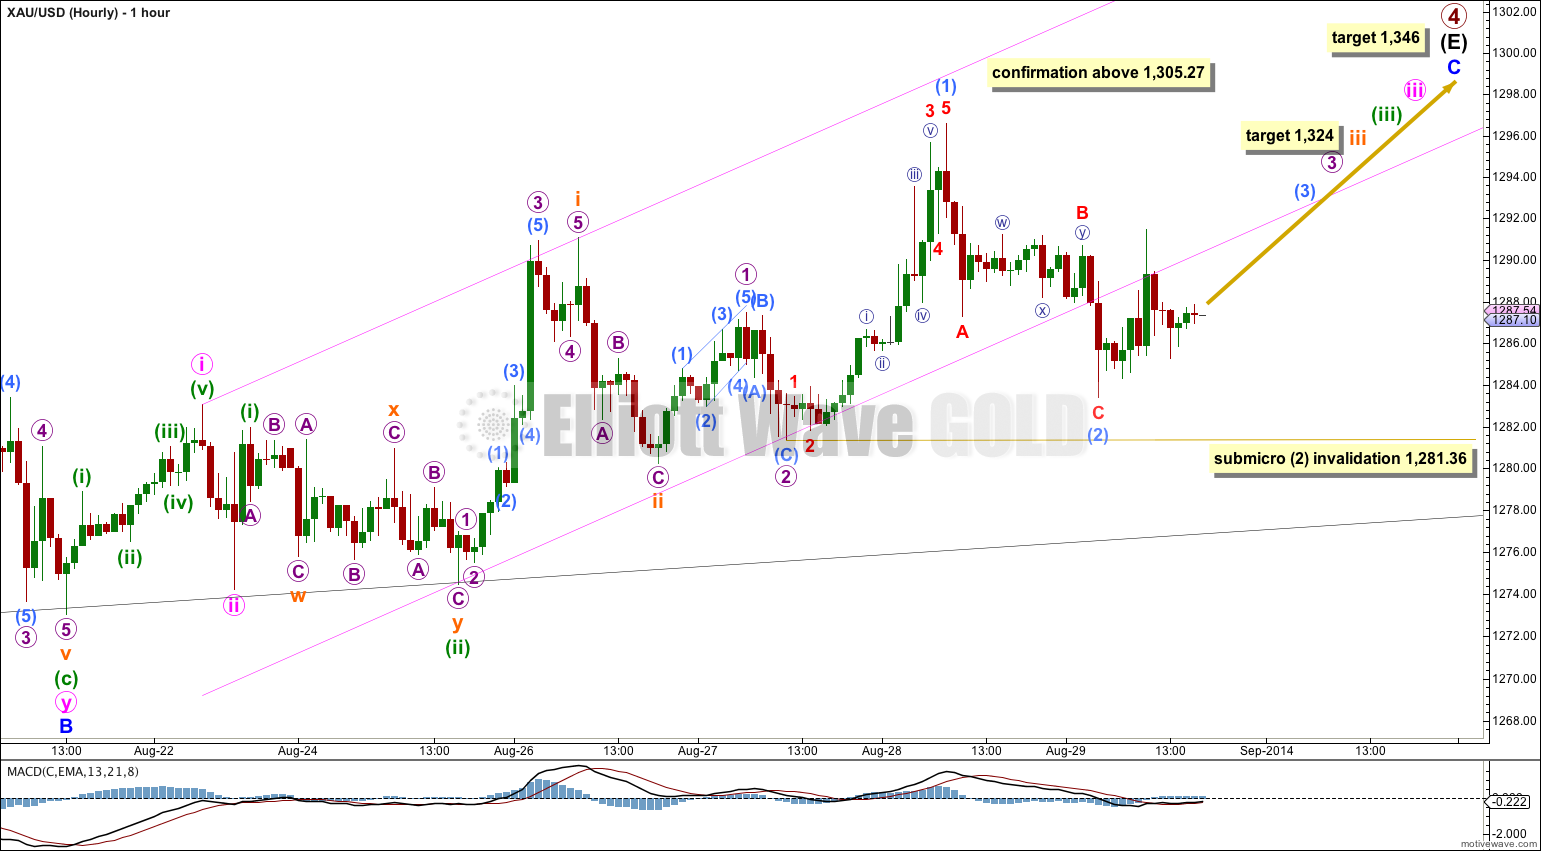
This wave count has the best fit in terms of subdivisions. We may still have a series of five overlapping first and second waves.
When third waves extend they necessarily begin with a series of overlapping first and second waves. This can sometimes put us off and may make us think that the third wave will not appear, and it can do that right before the third wave begins to move extremely strongly. Although momentum for submicro wave (1) has still not increased beyond that seen for subminuette wave i, I would not expect to see the strongest momentum until the middle of the third wave arrives, which is not here yet.
I have drawn the same best fit acceleration channel about this upwards movement: draw the first trend line from the highs of minute wave i to subminuette wave i, then place a parallel copy on the low of minuette wave (ii). If this wave count is correct then at this stage I would expect the lower edge of this channel to provide very strong support. The fact that this lower trend line is breached reduces the probability of this wave count substantially, but does not invalidate it.
At 1,324 subminuette wave iii would reach 2.618 the length of subminuette wave i. This target may still be about three days away.
Submicro wave (2) may not move beyond the start of submicro wave (1) below 1,281.36.
Hourly Wave Count – First Alternate.
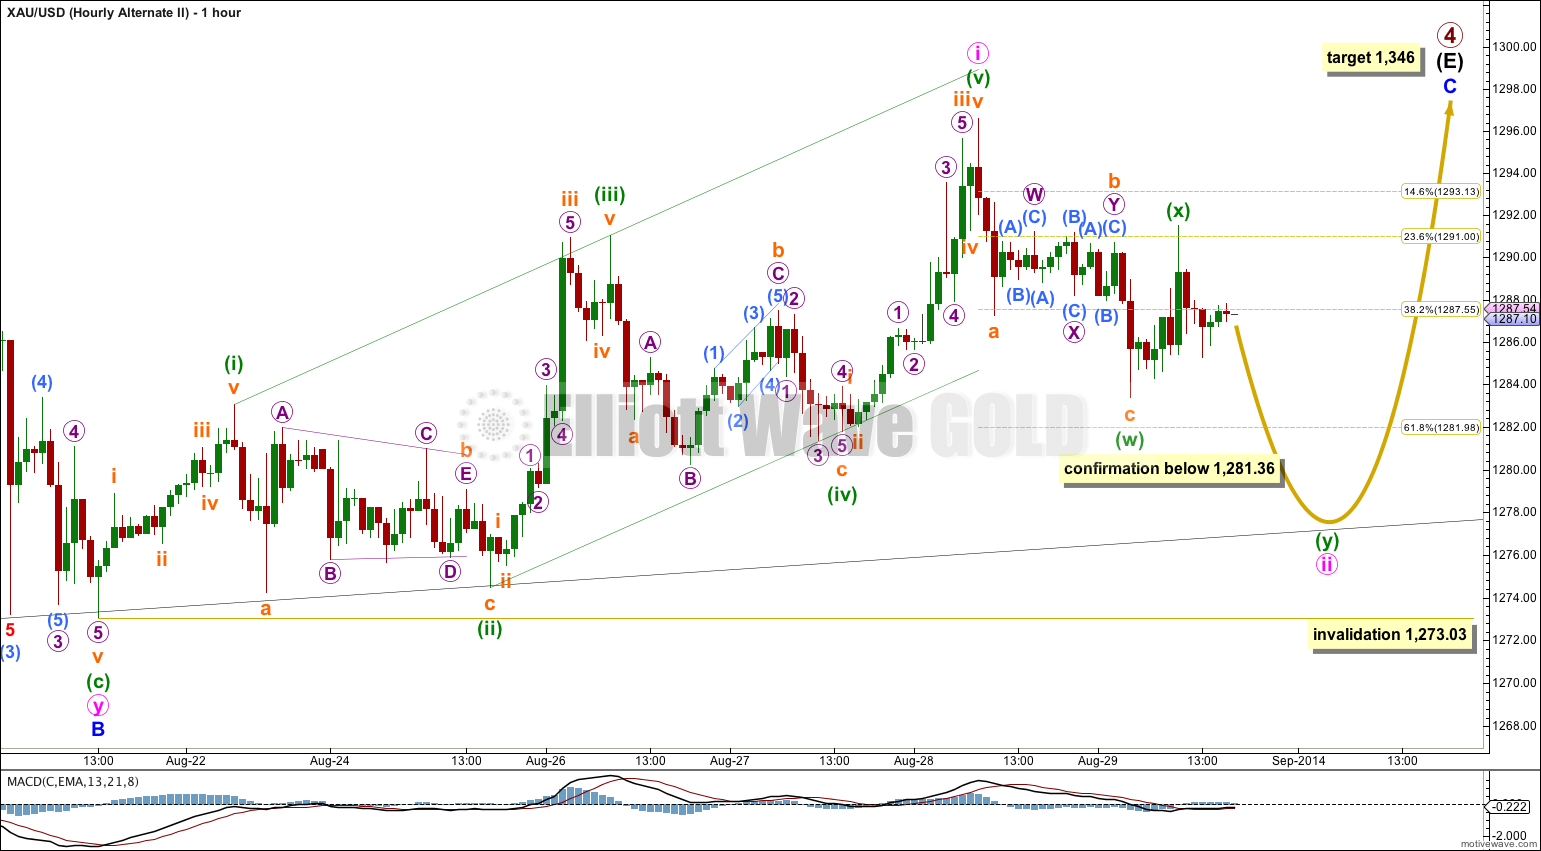
Minute wave i may have completed as a leading expanding diagonal, but this wave count has a few problems.
Within minuette wave (ii) subminuette wave b is an atypical looking barrier triangle because the A-C trend line does not have a clear enough slope.
Within subminuette wave b of minuette wave (iv) micro wave B must be seen as a three wave zigzag. On the five minute chart this movement subdivides better as a five wave impulse, which is what the main wave count sees it as. This further reduces the probability of this alternate.
Minuette wave (iv) did not move lower, and micro wave 5 within subminuette wave c is truncated. This further reduces the probability of this alternate today.
Minuette wave (iv) is less than the common length of 0.66 to 0.81 the length of minuette wave (iii), at just 0.56. This also slightly reduces the probability of this alternate today.
The biggest problem with this alternate still is the diagonal trend lines. They should clearly diverge for an expanding diagonal. The fact that they do not, they look closer to parallel, gives this structure overall an atypical look. This wave count looks forced.
If price moves below 1,281.36 this would be my preferred wave count, and at that stage I would expect it to be highly likely that price would move as low as the black (B)-(D) trend line on the daily chart.
Minute wave ii would most likely move deeper, and may be unfolding as a double zigzag to do so. I would expect it to touch the (B)-(D) trend line.
When first waves subdivide as diagonals they are commonly followed by very deep second wave corrections. Diagonals in first wave positions are not exactly rare, but they are not common either. Leading diagonals are almost always contracting, and the expanding variety is uncommon. These points reduce the probability of this wave count. Today I would judge it to have only about a 10-15% probability.
Second Alternate Daily Wave Count
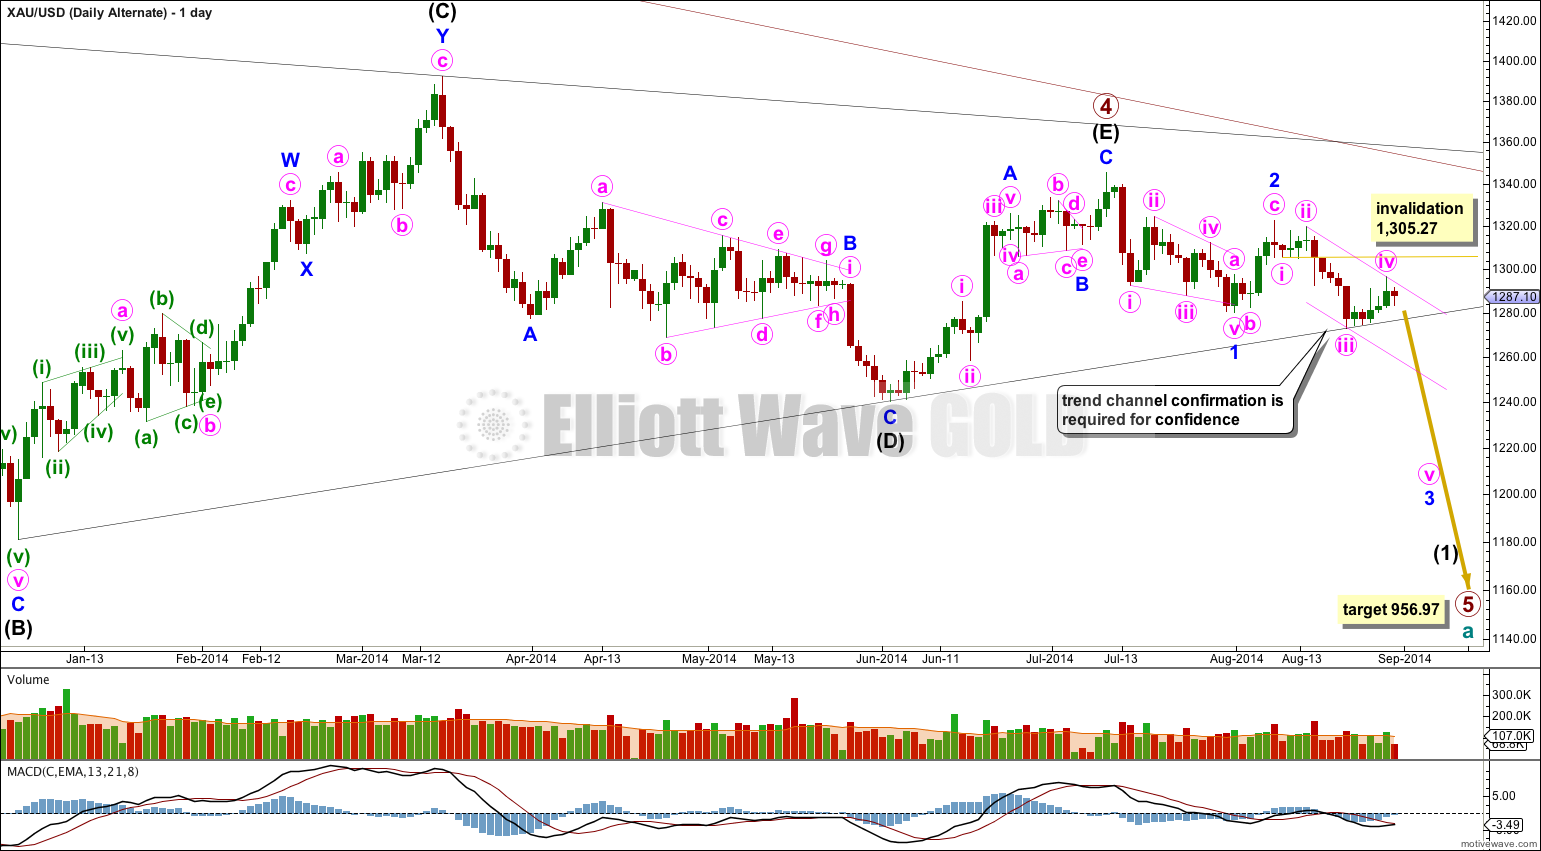
It is possible that primary wave 4 is over at the high of 1,345.22. This wave count still requires confirmation with a clear breach of the (B)-(D) trend line on this daily chart.
If primary wave 4 is over then primary wave 5 downwards would reach equality in length with primary wave 1 at 956.97. Primary wave 1 was a remarkably brief 3 weeks duration. I would expect primary wave 5 to last some months, and is already longer than one month.
The only structure which fits for minor wave 1 is a leading contracting diagonal. While leading diagonals are not rare, they are not very common either. This slightly reduces the probability of this wave count.
Within diagonals the second and fourth waves are commonly between 0.66 to 0.81 the prior wave. Here minute wave ii is 0.61 the length of minute wave i, just a little shorter than the common length, slightly reducing the probability of this wave count. Minute wave iv is 0.66 the length of minute wave iii, just within the common length.
Leading diagonals in first wave positions are normally followed by very deep second wave corrections. Minor wave 2 is deep at 65% the length of minor wave 1, but this is not “very” deep. This again very slightly reduces the probability of this wave count.
The biggest problem I have with this wave count and the main reason for it still being an alternate is the leading diagonal following the end of the triangle for primary wave 4. When triangles end the first piece of movement out of the triangle is almost always very strong and swift. Diagonals are not strong and swift movements. To see a first wave out of a triangle subdividing as a diagonal is highly unusual and does not at all fit with typical behaviour.
Also, price found strong support at the (B)-(D) trend line, which should have ceased to provide any support or resistance if the triangle was over. This is unusual and further reduces the probability of this alternate wave count. At this stage I would judge this alternate to have only about a 5% probability. I expect it to be invalidated within the next 48 hours.
Within minor wave 3 minute wave iv may not move into minute wave i price territory above 1,305.27.
A clear breach of the lower (B)-(D) trend line of the primary wave 4 triangle would provide full and final confirmation of this alternate. A full daily candlestick below that trend line would provide me with 100% confidence in this wave count.
Draw a channel about minor wave 3 here on the daily chart using Elliott’s first technique and copy it over to the hourly chart: draw the first trend line from the lows labeled minute waves i to iii, then place a parallel copy on the high labeled minute wave ii.
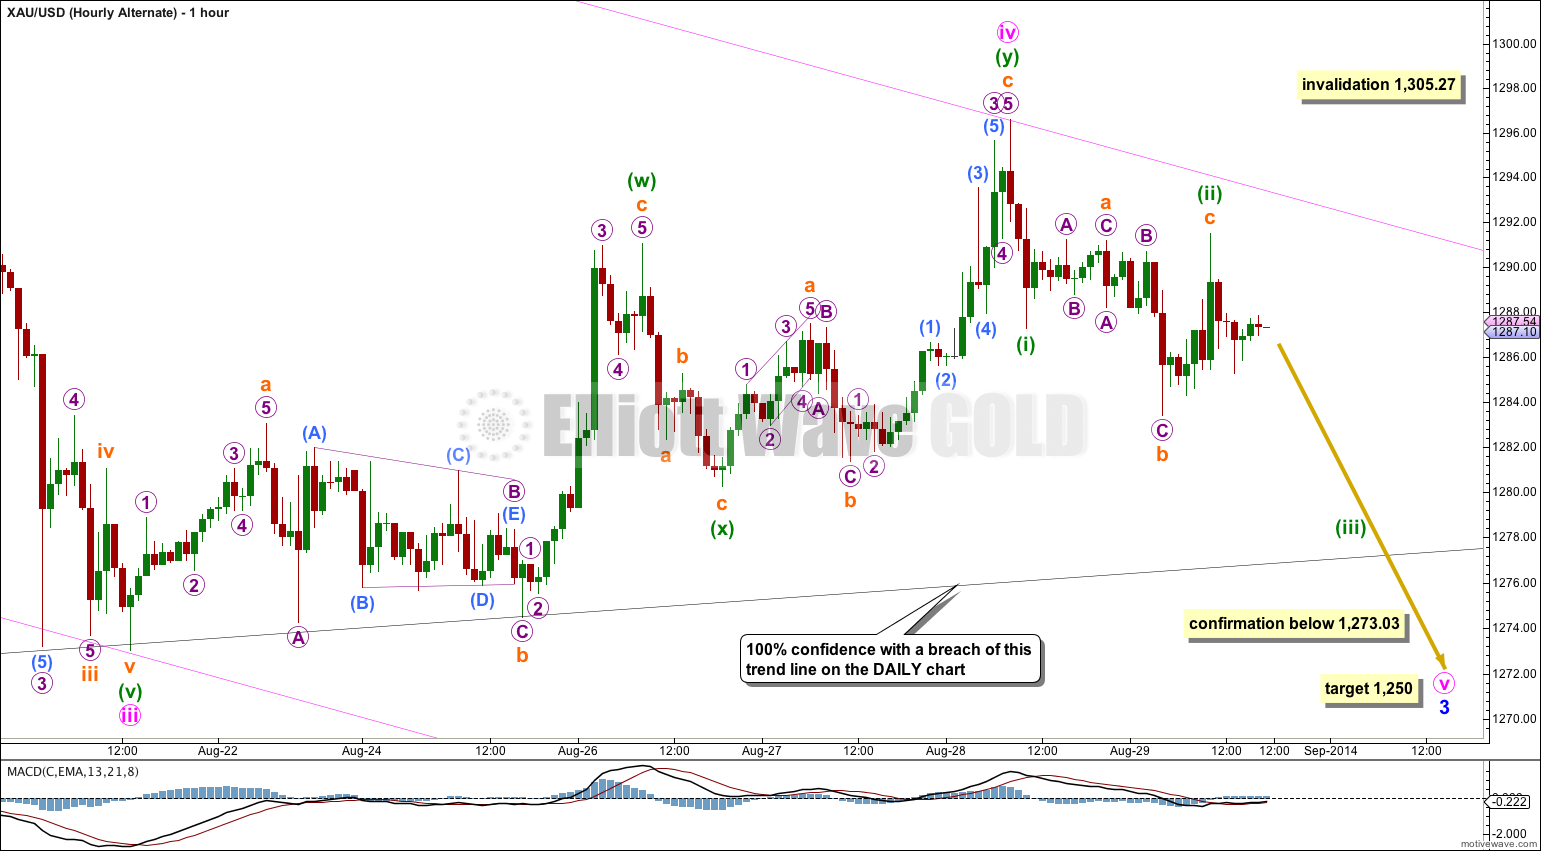
Minute wave ii was a deep combination and minute wave iv is also now a deep correction as a double zigzag. The deepening of this correction further reduces the probability of this alternate today.
At 1,250 minute wave v would reach equality in length with minute wave iii. Both minute waves iii and v would be extended.
This wave count requires confirmation initially with a new low below 1,273.03. Thereafter, I would wait for one full daily candlestick below the black (B)-(D) trend line on the daily chart before I would have full confidence in the idea that primary wave 5 has begun.
I would only take this wave count seriously with some confirmation.
This analysis is published about 08:15 p.m. EST.
Are we not justing waiting to see if Russia starts a war in Europe?????