
Again, downwards movement continued. With Monday’s session closing on a green candlestick, the wave count is slightly changed.
Summary: The third wave is over and the following fourth wave correction has arrived. The target at 1,221 was not met so this fourth wave is also most likely over, and downwards movement should resume from here. The target can now be calculated at two wave degrees to give a $1 zone of 1,219 – 1,218.
Click on charts to enlarge.
Main Wave Count
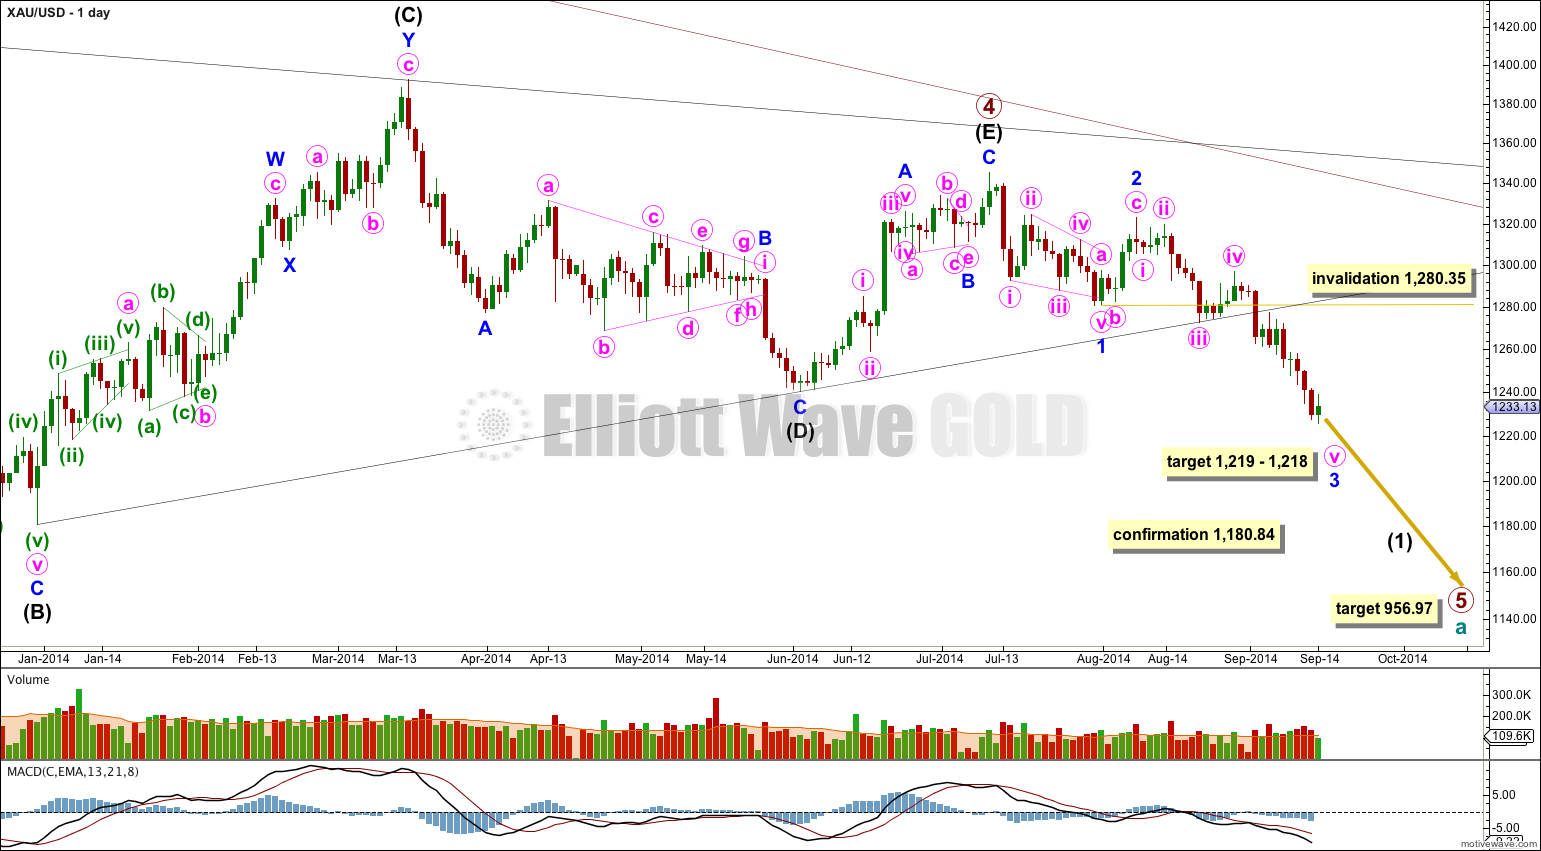
Extend the triangle trend lines of primary wave 4 outwards. The point in time at which they cross over may be the point in time at which primary wave 5 ends. This does not always work, but it works often enough to look out for. It is a rough guideline only and not definitive. A trend line placed from the end of primary wave 4 to the target of primary wave 5 at this point in time shows primary wave 5 would take a total 26 weeks to reach that point, and that is what I will expect. Primary wave 4 has just begun its 10th week.
The black (B)-(D) trend line is clearly breached. I have confidence that primary wave 5 has begun. The black (B)-(D) trend line is now also clearly breached on the weekly chart. This is significant.
In the last few trading days it is downwards days which have mostly higher volume. From a traditional technical analysis point of view this indicates the main trend is most likely down.
At 956.97 primary wave 5 would reach equality in length with primary wave 1. Primary wave 3 is $12.54 short of 1.618 the length of primary wave 1, and equality between primary waves 5 and 1 would give a perfect Elliott relationship for this downwards movement.
However, when triangles take their time and move close to the apex of the triangle, as primary wave 4 has (looking at this on a weekly chart is clearer) the movement following the triangle is often shorter and weaker than expected. If the target at 956.97 is wrong it may be too low. In the first instance I expect it is extremely likely that primary wave 5 will move at least below the end of primary wave 3 at 1,180.40 to avoid a truncation. When intermediate waves (1) through to (4) within primary wave 5 are complete I will recalculate the target at intermediate degree because this would have a higher accuracy. I cannot do that yet; I can only calculate it at primary degree.
I have removed the channel about minor wave 3 today and will use a more accurate channel on the hourly chart. Sometimes extended fifth waves for commodities are not contained within channels and overshoot the channel. When that happens a smaller channel on the fifth wave itself is more useful to show where and when it ends, and when it is over.
At 1,218 minor wave 3 would reach 1.618 the length of minor wave 1.
Minor wave 3 is nearing its end. When it is done the subsequent upwards correction for minor wave 4 may not move back into minor wave 1 price territory above 1,280.35.
Movement comfortably below 1,180.84 would invalidate the new alternate below and provide further confidence in this main wave count.
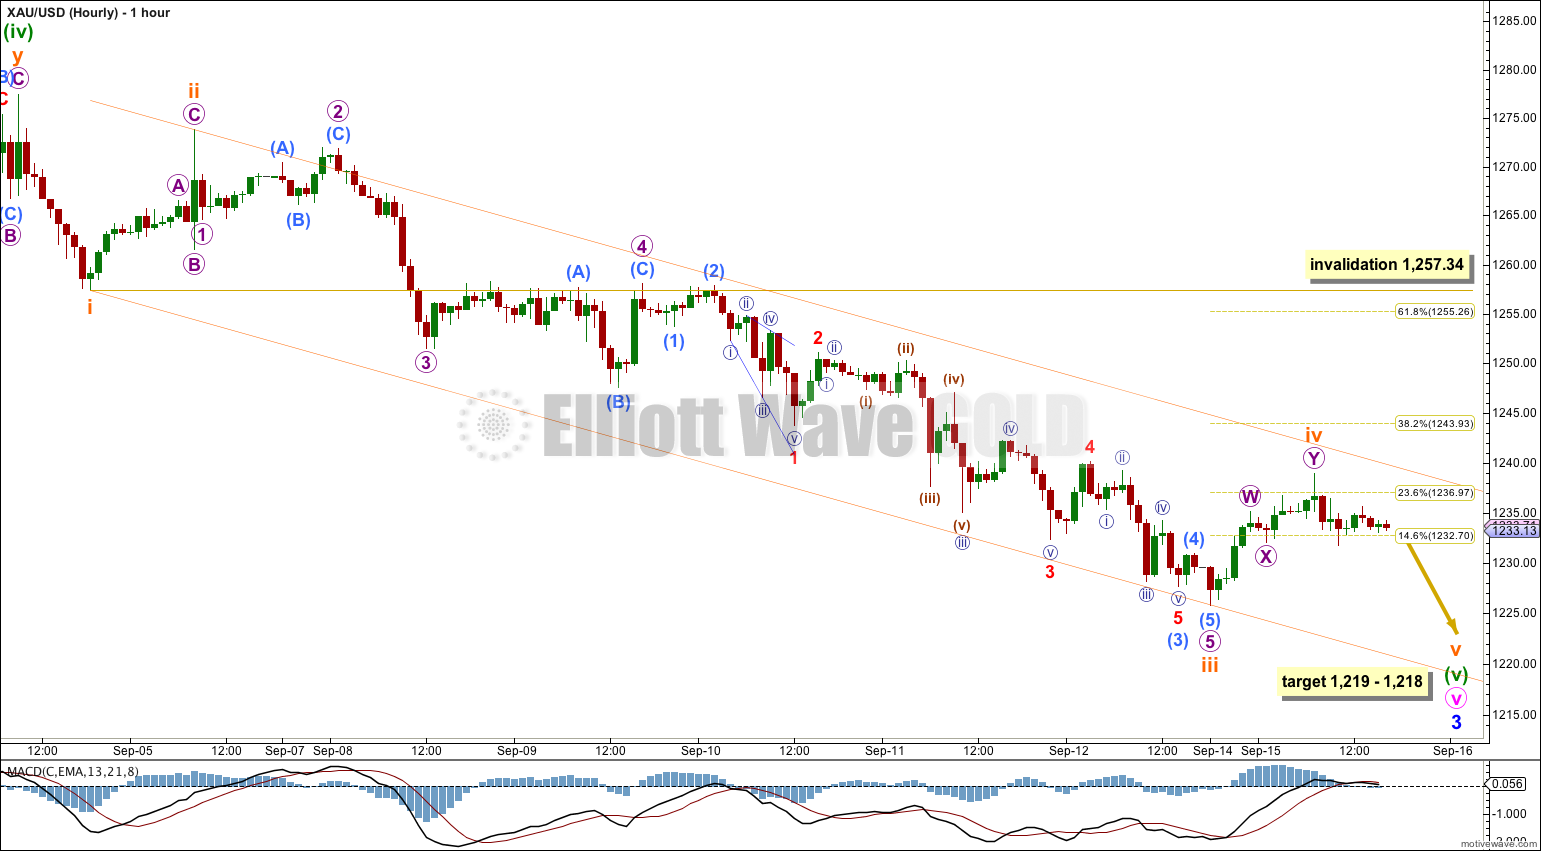
Subminuette wave iii did not reach the target at 1,221. This is a correction at subminuette wave degree because upwards movement labeled subminuette wave iv shows clearly on the daily chart as a green candlestick, counterpart to subminuette wave ii. This is not a lower degree correction.
My analysis of micro wave 4 was wrong: only one more small fourth wave correction was needed and not two as I had expected. Subminuette wave iii is 4.67 short of 2.618 the length of subminuette wave i, a variation of 9.7% which I consider to be an adequate Fibonacci ratio.
At 1,219 subminuette wave v would reach equality in length with subminuette wave i. This would be the most likely relationship for subminuette wave v (it is the most common). This gives us a $1 target zone calculated at two wave degrees.
Subminuette wave iv is most likely to be over and does have some alternation with subminuette wave ii, but it could certainly continue further. If it does move higher the upper end of the target zone must move correspondingly higher.
Draw a channel about minuette wave (v) using Elliott’s first technique: draw the first trend line from the lows labeled subminuette waves i to iii, then place a parallel copy on the high labeled subminuette wave ii. I would expect subminuette wave v to find support and likely end at the lower edge of this channel.
When there is some downwards movement which could be a complete fifth wave, whether or not the target is reached, subsequent movement above the channel would provide trend channel confirmation that minuette wave (v) and so minor wave 3 in its entirety is over and minor wave 4 has arrived.
If subminuette wave iv continues higher and breaches the upper edge of the channel then the channel will have to be redrawn using Elliott’s second technique, and the upper edge of the target zone would have to be recalculated. Subminuette wave iv may not move into subminuette wave i price territory above 1,257.34.
Alternate Wave Count
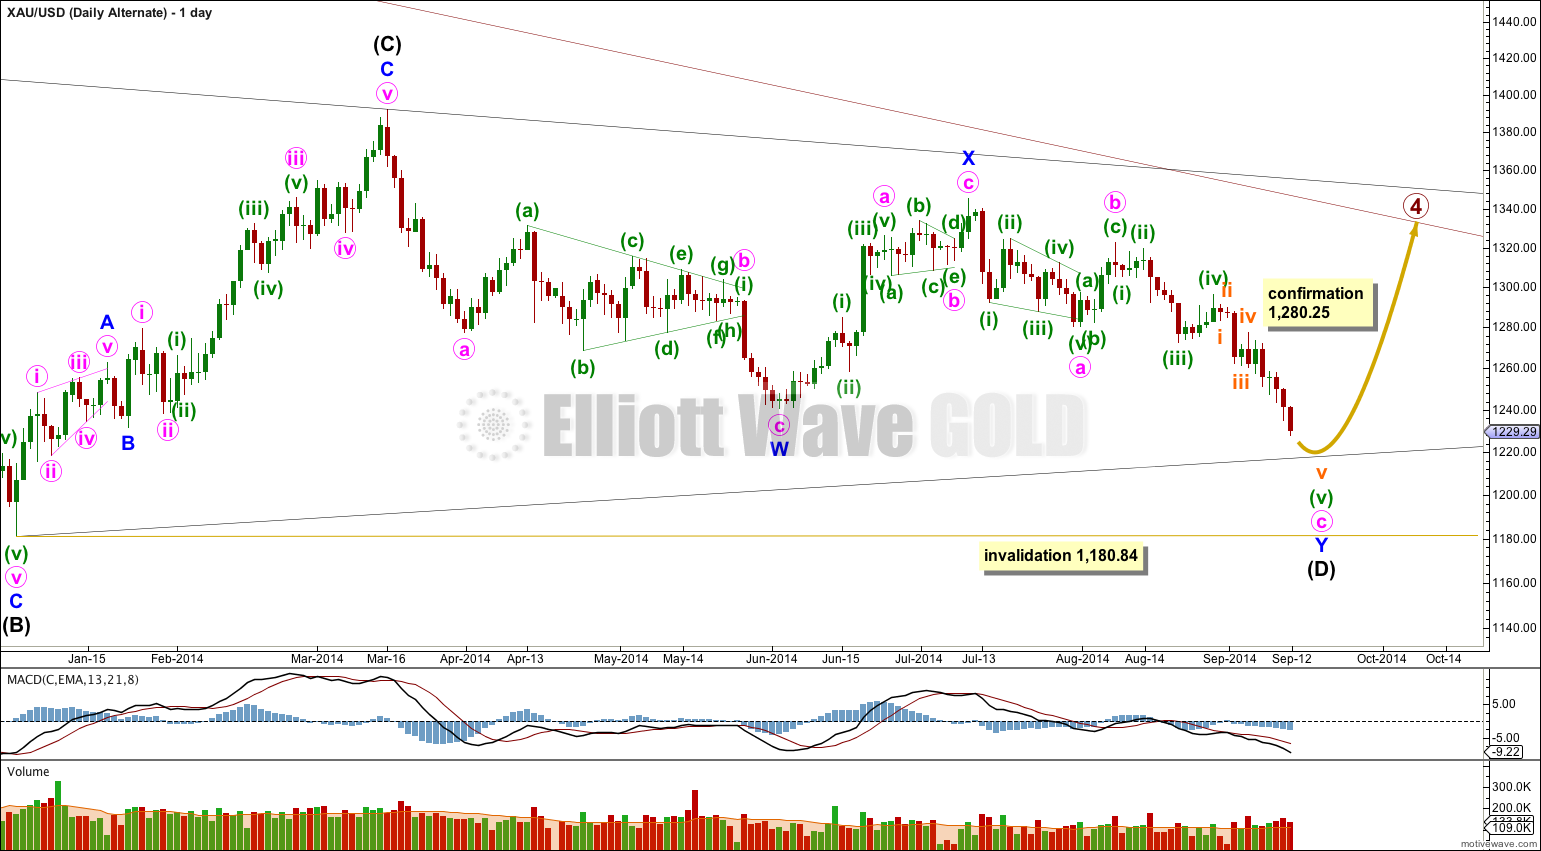
I would judge this wave count to have a very low probability only because of proportion between primary waves 2 and 4. The main wave count sees them almost exactly of the same duration, with primary wave 2 lasting 53 weeks and primary wave 4 lasting 54 weeks. This alternate would see primary wave 4 as much longer in duration than primary wave 2. It is the proportion between second and fourth waves within an impulse which gives the wave count what is called the “right look”. This alternate would still have the right look, but it would not look as good as the main wave count.
If intermediate wave (D) is continuing it can only be as a double zigzag. For a contracting triangle intermediate wave (D) may not move beyond the end of intermediate wave (B) below 1,180.84. For a barrier triangle intermediate wave (D) should end about the same level as intermediate wave (B), as long as the (B)-(D) trend line is essentially flat. In practice this means that intermediate wave (D) could end slightly below 1,180.84 and the wave count would remain valid. Unfortunately, this invalidation point is not black and white.
If intermediate wave (D) is a double zigzag, then intermediate wave (C) must be seen as a single zigzag because only one of the five subwaves of a triangle may be a double.
It is possible to see intermediate wave (C) as a zigzag, but to do so a rather obvious triangle must be ignored after the end of minor wave A. The main wave count sees a triangle in that position. I think this reduces the probability of this alternate.
Within intermediate wave (C) the subdivision within minuette wave (i) of minute wave iii of minor wave C is problematic. On the hourly chart this upwards wave subdivides as a double zigzag and does not fit well at all as a five wave structure. This is another reason why I would prefer a wave count which sees a triangle in that position because the subdivisions of those waves fit a triangle perfectly. This further reduces the probability of this alternate.
This alternate wave count does not diverge from the main wave count at this stage, and will not diverge for another one or two weeks. The main wave count expects downwards movement to complete minor wave 3 and this alternate expects downwards movement to complete minute wave c. Thereafter, the main wave count would expect upwards movement for minor wave 4 and this alternate wave count would expect upwards movement for intermediate wave (E). If at that stage price moves above 1,280.25 for that upwards movement then the main wave count would be invalidated and this alternate confirmed.
This analysis is published about 07:14 p.m. EST.