
Downwards movement continues as expected. The target has been passed. The Elliott wave count remains the same.
Summary: The structure is incomplete. I expect more downwards movement. The new target for it to end is 1,210 to 1,206 and may be met in 24 to 36 hours.
Click on charts to enlarge.
Main Wave Count
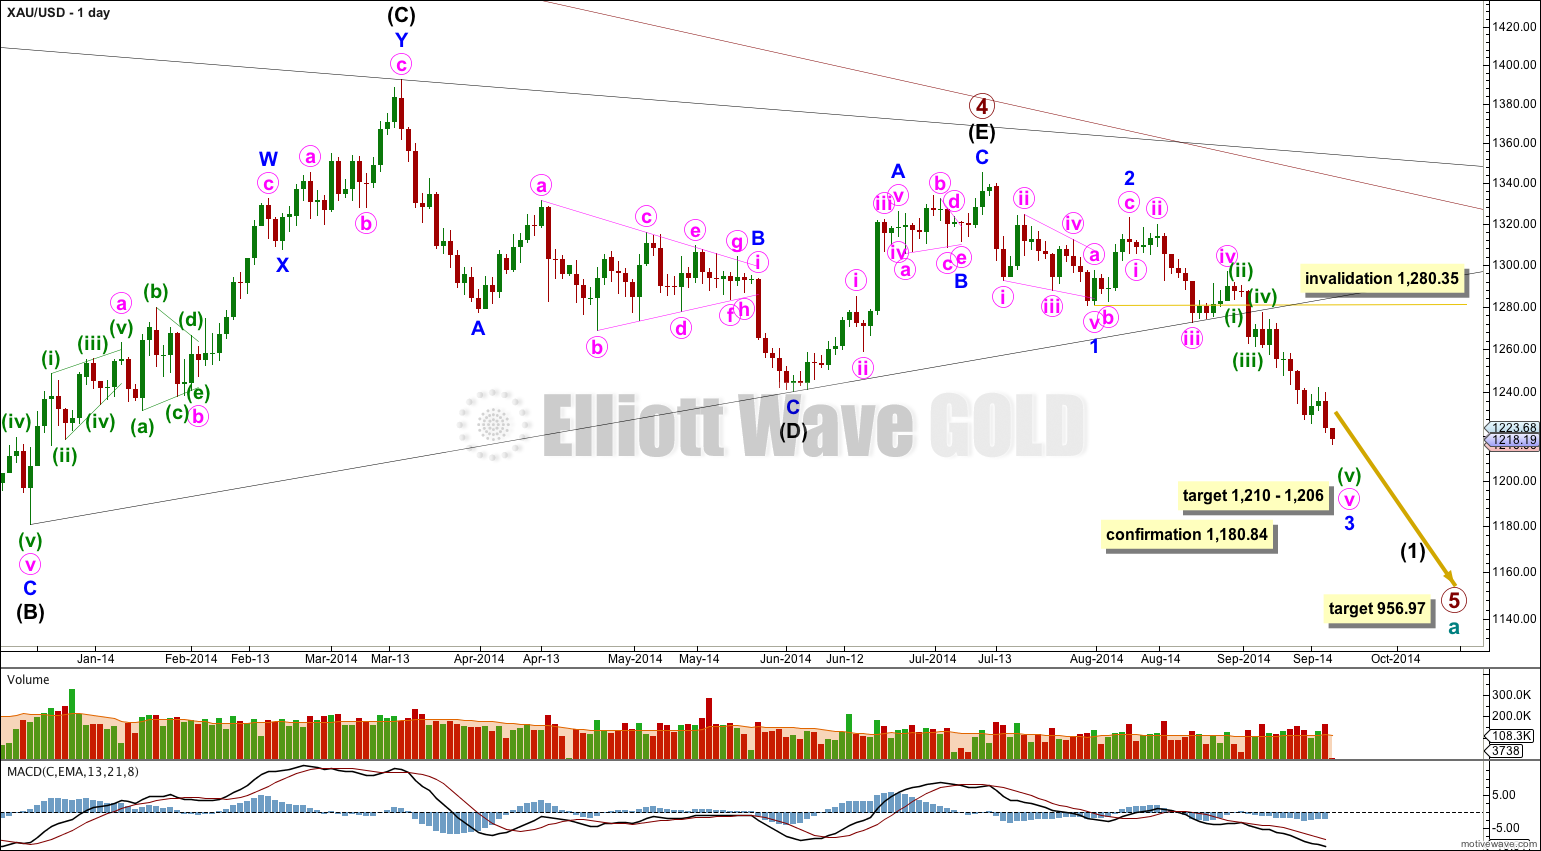
Extend the triangle trend lines of primary wave 4 outwards. The point in time at which they cross over may be the point in time at which primary wave 5 ends. This does not always work, but it works often enough to look out for. It is a rough guideline only and not definitive. A trend line placed from the end of primary wave 4 to the target of primary wave 5 at this point in time shows primary wave 5 would take a total 26 weeks to reach that point, and that is what I will expect. Primary wave 4 has just begun its 10th week.
The black (B)-(D) trend line is clearly breached. I have confidence that primary wave 5 has begun. The black (B)-(D) trend line is now also clearly breached on the weekly chart. This is significant.
In the last several trading days it is downwards days which have mostly higher volume. From a traditional technical analysis point of view this supports the main trend as down.
At 956.97 primary wave 5 would reach equality in length with primary wave 1. Primary wave 3 is $12.54 short of 1.618 the length of primary wave 1, and equality between primary waves 5 and 1 would give a perfect Elliott relationship for this downwards movement.
However, when triangles take their time and move close to the apex of the triangle, as primary wave 4 has (looking at this on a weekly chart is clearer) the movement following the triangle is often shorter and weaker than expected. If the target at 956.97 is wrong it may be too low. In the first instance I expect it is extremely likely that primary wave 5 will move at least below the end of primary wave 3 at 1,180.40 to avoid a truncation. When intermediate waves (1) through to (4) within primary wave 5 are complete I will recalculate the target at intermediate degree because this would have a higher accuracy. I cannot do that yet; I can only calculate it at primary degree.
Minor wave 3 has now passed 1.618 the length of minor wave 1. If minor wave 3 ends within the new target zone it may still exhibit an adequate Fibonacci ratio of 1.618 the length of minor wave 1. I consider any variation less than 10% to be adequate.
Movement comfortably below 1,180.84 would invalidate the alternate daily wave count below and provide further confidence in this main wave count.
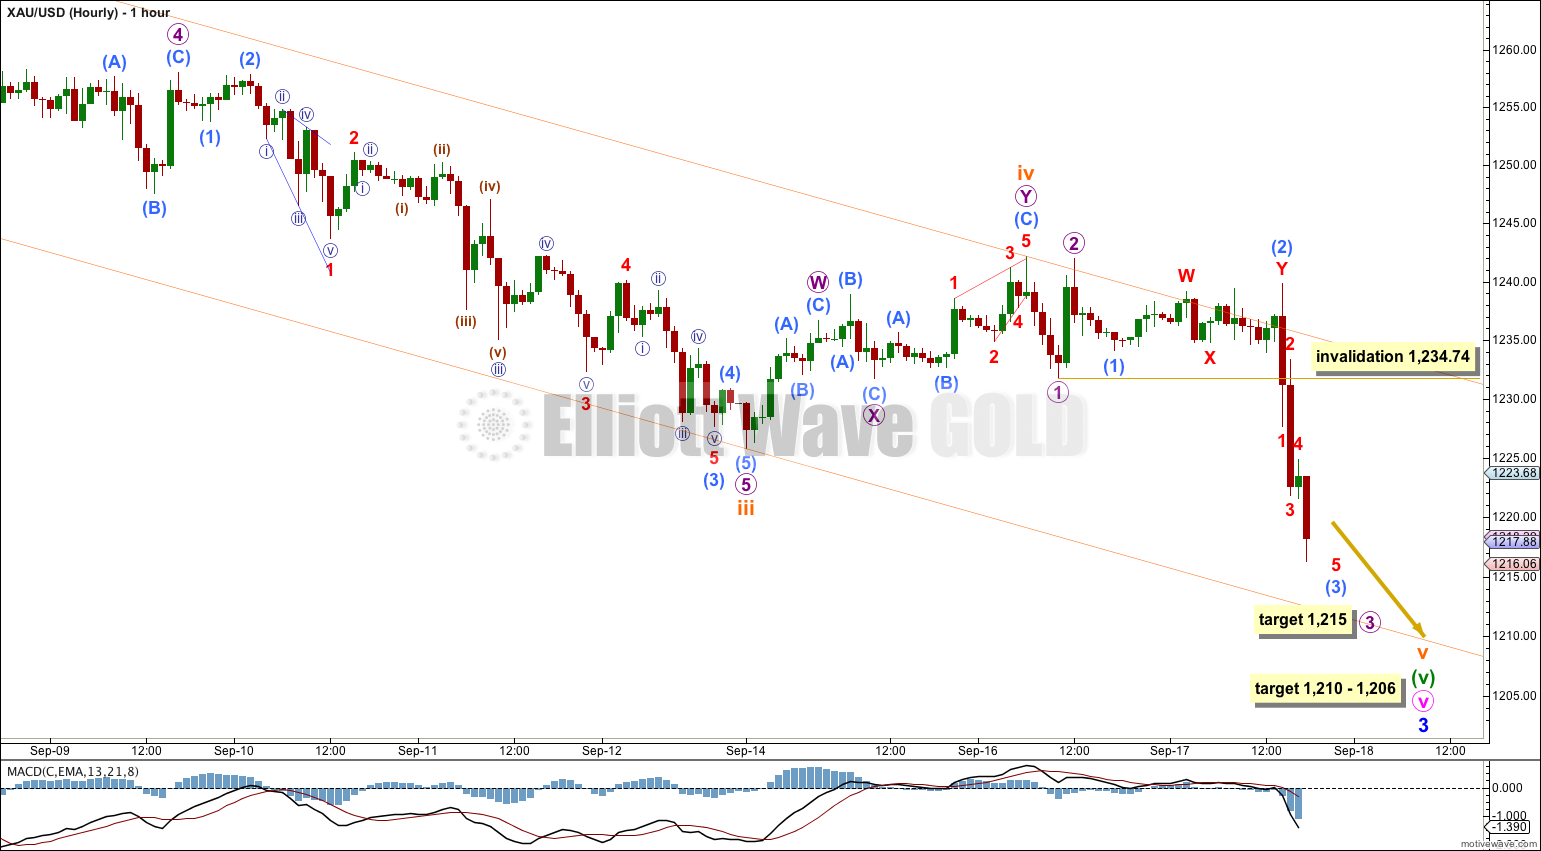
The target zone at 1,221 to 1,218 has been passed and the structure is still incomplete. I expect more downwards movement. I have calculated a new target zone for you, which may be met within 24 to 36 hours.
Subminuette wave v is incomplete, must subdivide as a five wave structure, and is unfolding as an impulse.
Within subminuette wave v at 1,215 micro wave 3 would reach 2.618 the length of micro wave 1.
At 1,210 subminuette wave v would reach 1.618 the length of subminuette wave i. Because there is no adequate Fibonacci ratio between subminuette waves iii and i I would expect it is very likely we shall see a Fibonacci ratio for subminuette wave v to either of i or iii.
At 1,206 minuette wave (v) would reach 1.618 the length of minuette wave (iii). There is no adequate Fibonacci ratio between minuette waves (i) and (iii) so I would again expect it is very likely we shall see a Fibonacci ratio between minuette wave (v) and either of (i) or (iii).
This gives a $4 target zone calculated at two wave degrees. It is not based upon seeing the most common ratio for these fifth waves, but that most common ratio of equality with their first waves has now been comfortably passed.
Micro wave 2 and sub micro wave (2) within subminuette wave v, this final fifth wave down, do not show up on the daily chart as green candlesticks or doji. This means that their counterpart fourth wave corrections which are yet to arrive should also not show on the daily chart. I expect Thursday to produce another red candlestick, and maybe Friday as well.
Draw a channel about minuette wave (v) using Elliott’s second technique: draw the first trend line from the highs of subminuette waves ii to iv, then place a parallel copy on the low of subminuette wave iii. Look for the downwards edge of this channel to provide support. This may be where this downwards movement for minor wave 3 ends.
Within subminuette wave v micro wave 4 may not move into micro wave 1 price territory above 1,234.74.
When subminuette wave v may be seen as a completed five wave impulse then subsequent movement above 1,234.74 would provide price confirmation that minor wave 3 in its entirety is over. At that stage also movement above the upper edge of the channel would provide trend channel confirmation of a trend change at minor degree also.
Alternate Wave Count
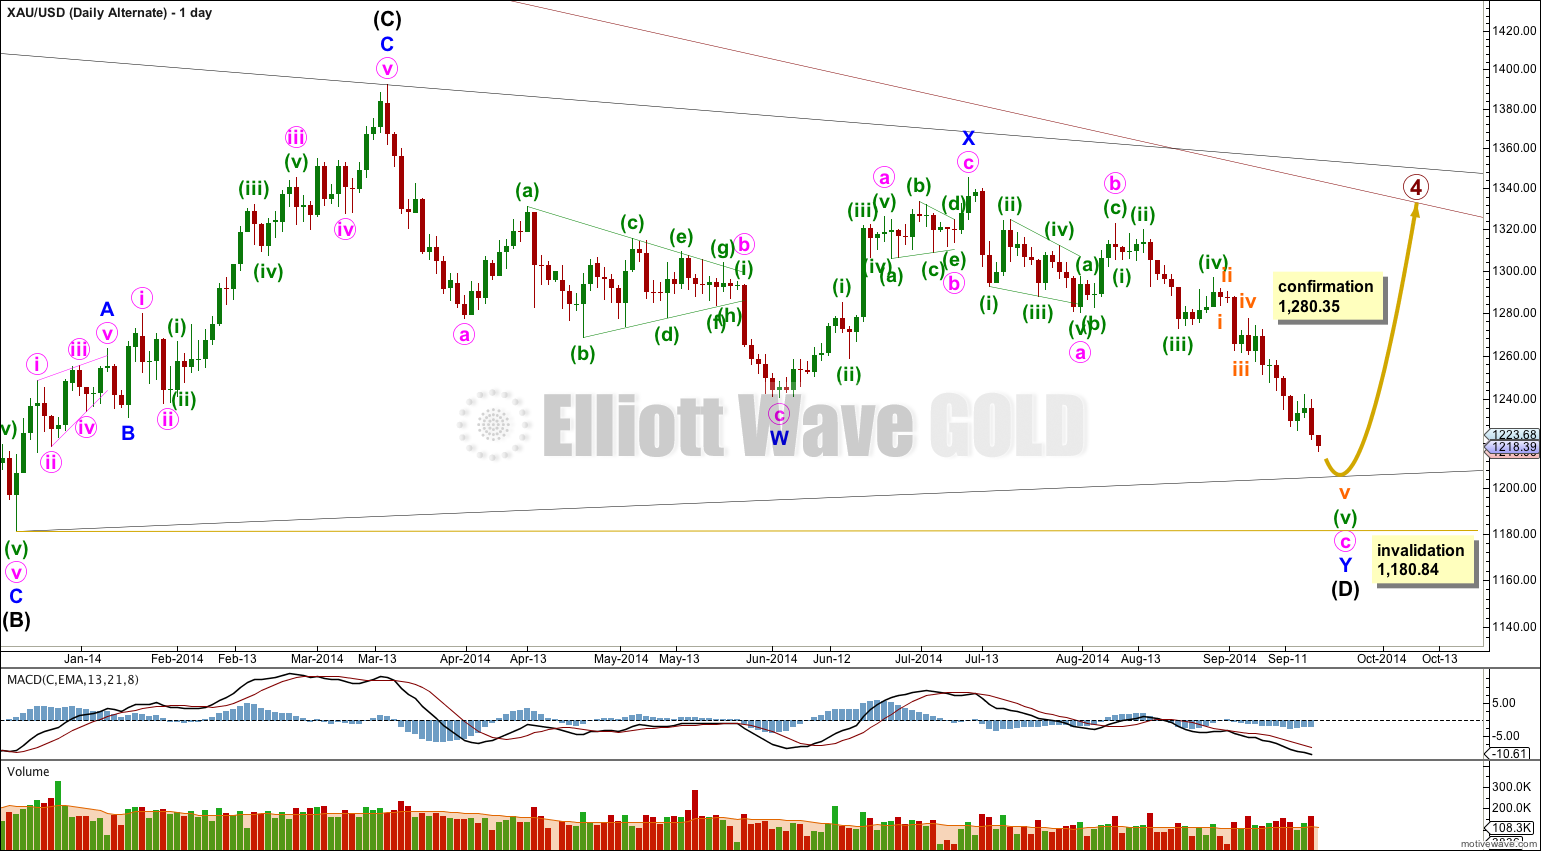
I would judge this wave count to have a very low probability only because of proportion between primary waves 2 and 4. The main wave count sees them almost exactly of the same duration, with primary wave 2 lasting 53 weeks and primary wave 4 lasting 54 weeks. This alternate would see primary wave 4 as much longer in duration than primary wave 2. It is the proportion between second and fourth waves within an impulse which gives the wave count what is called the “right look”. This alternate would still have the right look, but it would not look as good as the main wave count.
If intermediate wave (D) is continuing it can only be as a double zigzag. For a contracting triangle intermediate wave (D) may not move beyond the end of intermediate wave (B) below 1,180.84. For a barrier triangle intermediate wave (D) should end about the same level as intermediate wave (B), as long as the (B)-(D) trend line is essentially flat. In practice this means that intermediate wave (D) could end slightly below 1,180.84 and the wave count would remain valid. Unfortunately, this invalidation point is not black and white.
If intermediate wave (D) is a double zigzag, then intermediate wave (C) must be seen as a single zigzag because only one of the five subwaves of a triangle may be a double.
It is possible to see intermediate wave (C) as a zigzag, but to do so a rather obvious triangle must be ignored after the end of minor wave A. The main wave count sees a triangle in that position. I think this reduces the probability of this alternate.
Within intermediate wave (C) the subdivision within minuette wave (i) of minute wave iii of minor wave C is problematic. On the hourly chart this upwards wave subdivides as a double zigzag and does not fit well at all as a five wave structure. This is another reason why I would prefer a wave count which sees a triangle in that position because the subdivisions of those waves fit a triangle perfectly. This further reduces the probability of this alternate.
This alternate wave count does not diverge from the main wave count at this stage, and will not diverge for another one or two weeks. The main wave count expects downwards movement to complete minor wave 3 and this alternate expects downwards movement to complete minute wave c. Thereafter, the main wave count would expect upwards movement for minor wave 4 and this alternate wave count would expect upwards movement for intermediate wave (E). If at that stage price moves above 1,280.35 for that upwards movement then the main wave count would be invalidated and this alternate confirmed.
This analysis is published about 07:35 p.m. EST.
Hi Lara, can I ask you what you think about my chart ?
Thanks!
Going with the main wave count and thinking ahead, where can we realistically expect minor wave 4 to end? Of course, it is clear that you have to wait until minor wave 3 is over to make an accurate assessment. However, based on the current target zone for minor 3 to end, what is a reasonable percentage correction? So far it sounds like the window for minor 4 to end lies somewhere between 1234.74 and 1280.35. Since minor 2 was relatively deep, might minor 4 be on the shallower side? Thanks.
The information is contradictory. On the one hand we may expect minor wave 4 to be shallow because minor wave 2 was deep (65%). So I would expect minor wave 4 to reach back up to about 1,230 (0.236 Fibonacci ratio) or 1,250 (0.382 Fibonacci ratio). *this is a vague estimate, we don’t know where minor wave 3 ends yet so we don’t know where these ratios accurately are.
But on the other hand behaviour following fifth wave extensions tells us the correction to follow often ends at the end of the second wave within the fifth wave extension, which is at 1,273.87. This would be closer to the 0.618 Fibonacci ratio of minor wave 3.
I would judge the tendency of minor wave 4 to show alternation with minor wave 2 in depth may be stronger than typical behaviour following fifth wave extensions.
But we must keep both possibilities in mind.