
Downwards movement was expected for both the main and alternate hourly Elliott wave counts.
Summary: Minor wave 4 has begun. Gold has moved into a consolidation phase which should last at least one week or maybe up to two weeks in total. Minor wave 4 is most likely to end about 1,250.78 (but may include a new low below 1,208.22 within it) and should be very choppy and overlapping. The Elliott wave count for structure within minor wave 4 will have to change as the structure unfolds. In the short term I expect a little downwards movement to 1,209. It is possible that within the next 24 hours we may see a new low below 1,208.22.
Click on charts to enlarge.
Main Wave Count
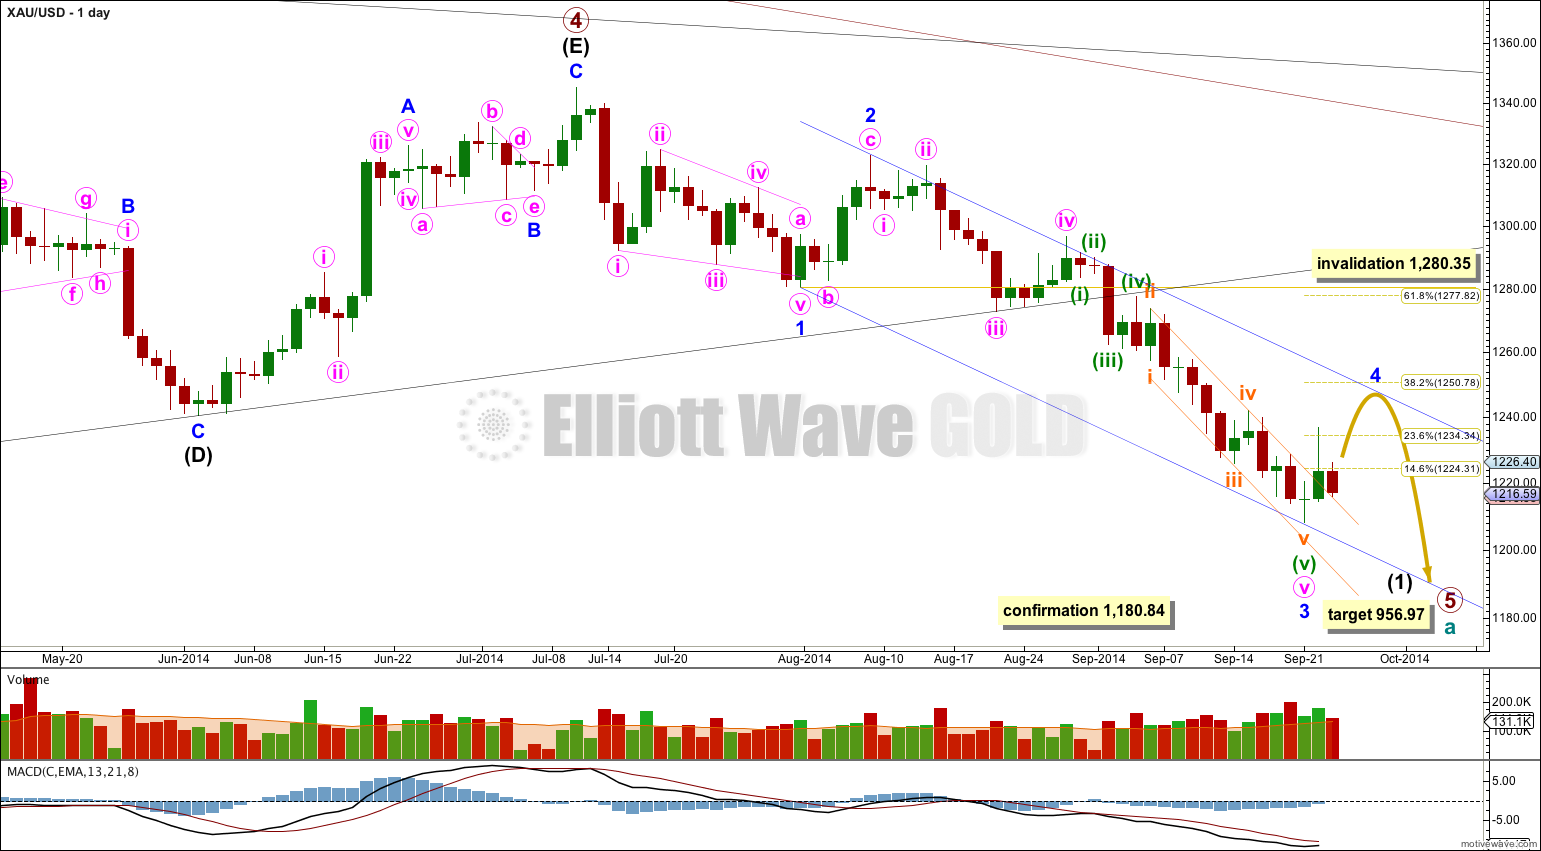
On the weekly chart extend the triangle trend lines of primary wave 4 outwards. The point in time at which they cross over may be the point in time at which primary wave 5 ends. This does not always work, but it works often enough to look out for. It is a rough guideline only and not definitive. A trend line placed from the end of primary wave 4 to the target of primary wave 5 at this point in time shows primary wave 5 would take a total 26 weeks to reach that point, and that is what I will expect. Primary wave 5 has begun its 11th week.
The black (B)-(D) trend line is now clearly breached on the daily chart, and also clearly breached on the weekly chart. This is significant.
At 956.97 primary wave 5 would reach equality in length with primary wave 1. Primary wave 3 is $12.54 short of 1.618 the length of primary wave 1, and equality between primary waves 5 and 1 would give a perfect Elliott relationship for this downwards movement.
However, when triangles take their time and move close to the apex of the triangle, as primary wave 4 has (looking at this on a weekly chart is clearer) the movement following the triangle is often shorter and weaker than expected. If the target at 956.97 is wrong it may be too low. In the first instance I expect it is extremely likely that primary wave 5 will move at least below the end of primary wave 3 at 1,180.40 to avoid a truncation. When intermediate waves (1) through to (4) within primary wave 5 are complete I will recalculate the target at intermediate degree because this would have a higher accuracy. I cannot do that yet; I can only calculate it at primary degree.
Minor wave 3 is $9.65 longer than 1.618 the length of minor wave 1. This variation is less than 10% the length of minor wave 3 and so I would consider it an acceptable Fibonacci ratio. Just.
Movement comfortably below 1,180.84 would invalidate the alternate daily wave count below and provide further confidence in this main wave count.
I have drawn a Fibonacci retracement the length of minor wave 3. Minor wave 4 has already reached up to the 0.236 at 1,234.34, and may yet move higher to the 0.382 at 1,250.78 Fibonacci ratio, so that there is alternation with the deep correction of minor wave 2. I expect this tendency to alternation may be stronger than a tendency for corrections following fifth wave extensions to reach up to the end of the second wave within the extended fifth wave.
Draw a channel about intermediate wave (1): draw the first trend line from the lows labeled minor waves 1 to 3, then place a copy on the high labeled minor wave 2. Minor wave 4 may find resistance and may end about the upper edge of this blue channel. This indicates minor wave 4 could last only one week / 5 days. Today, however, it looks like minor wave 4 may be longer lasting than just one week.
Draw a channel on the daily chart and copy it over to the hourly chart about the extended fifth wave of minuette wave (v): draw the first trend line from the highs of subminuette waves ii to iv, then place a parallel copy on the low of subminuette wave iii. The upper orange trend line is showing where price is finding support.
There is a nice morning doji star on this daily chart which supports this wave count. A morning doji star is a bottom reversal pattern, indicating the prior bear trend of minor wave 3 should change to a new trend. This new trend may be either upwards or sideways, and the wave count expects it is sideways.
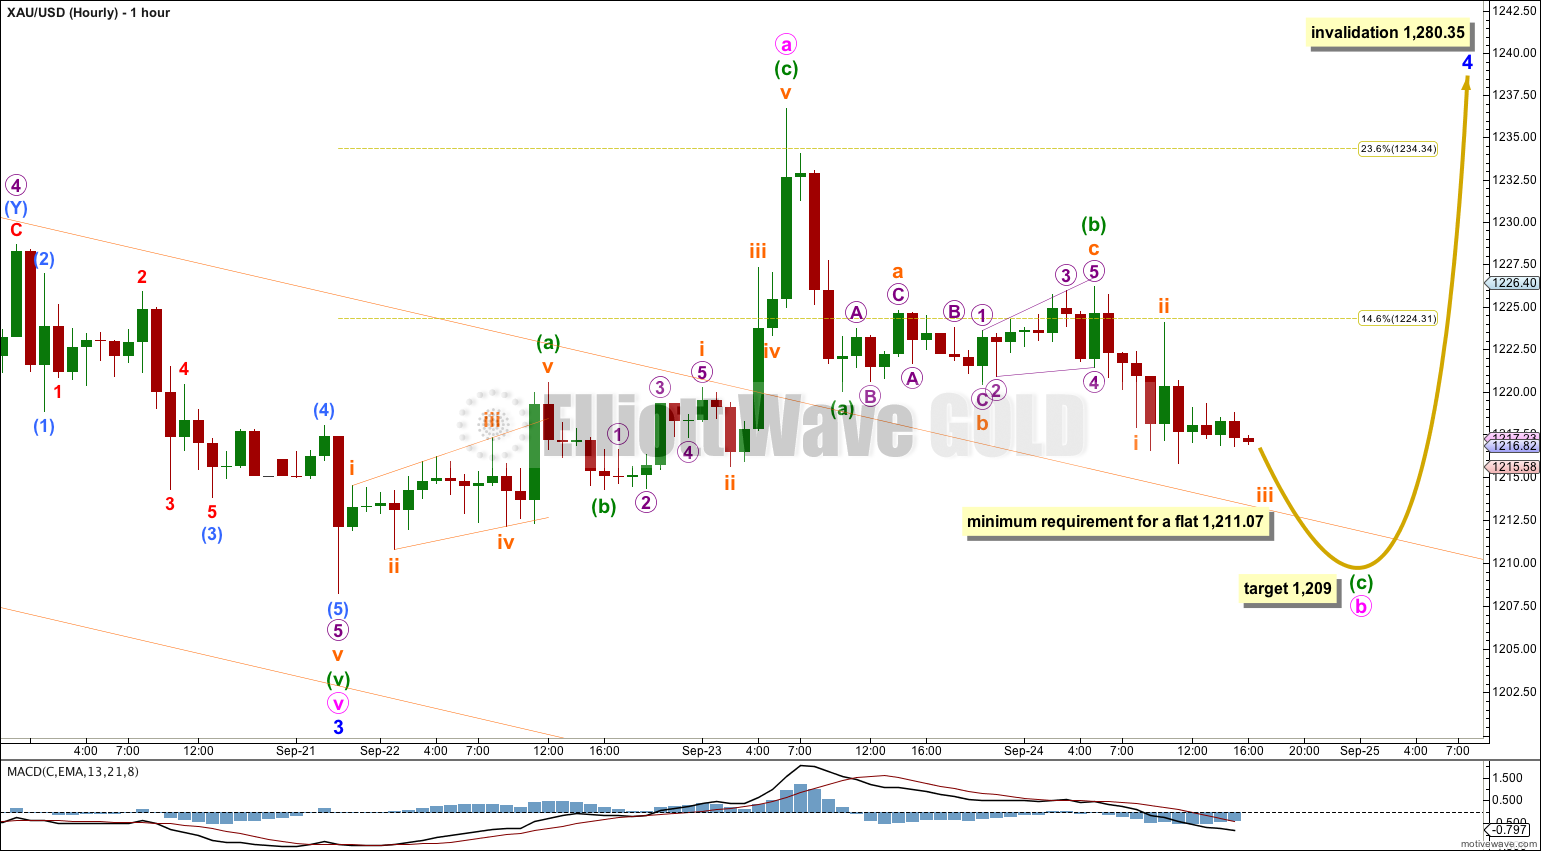
The first upwards wave so far subdivides as a three, a zigzag. This means that we may see a new low. When an A wave subdivides as a three then the possible corrective structures unfolding are a flat, triangle or combination. All of these structures may include new price extremes beyond their starts.
It is possible that minute wave a within minor wave 4 could be complete as a zigzag. Minor wave 4 may be a flat or a triangle. If minor wave 4 is a flat correction then within it minute wave b must reach a minimum 90% of minute wave a at 1,211.07.
At 1,209 minuette wave (c) would reach equality in length with minuette wave (a). Minute wave b may make a new low below the start of minute wave a at 1,208.22.
Within minuette wave (c) the structure is incomplete. On the five minute chart it looks like only subminuette waves i and ii are complete. I will expect some more downwards movement to complete minuette wave (c).
If minor wave 4 is a triangle minute wave b within it has no minimum requirement, and only needs to subdivide as a three. If minor wave 4 is a running triangle then minute wave b within it may make a new low below the start of minute wave a at 1,208.22.
Downwards movement may find support at the upper edge of the orange channel copied over here to the hourly chart. If price cannot break through support at this trend line then minuette wave (c) could turn out to be very time consuming, and may move along the trend line. We could see another small red candlestick for Thursday’s session.
When minute wave b is a completed three wave structure then this wave count would expect upwards movement for minute wave c.
Alternate Hourly Wave Count
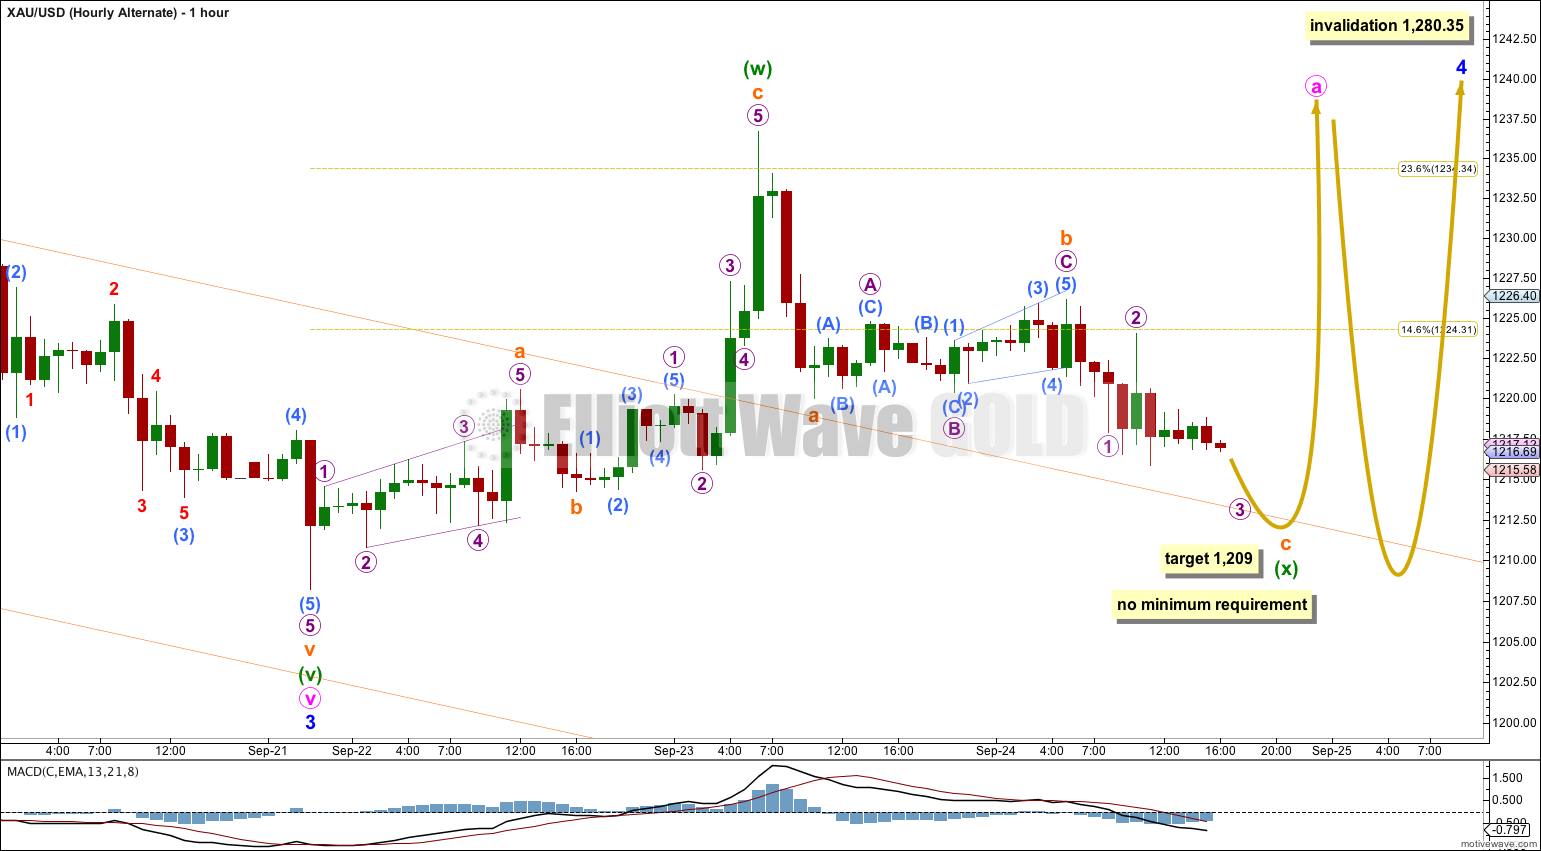
By moving the degree of labeling within this first upwards wave all down one degree minute wave a may be incomplete, and may be unfolding as a double zigzag or double combination.
Within a double zigzag or double combination there is no minimum requirement for the depth of minuette wave (x). Minuette wave (x) may subdivide as any corrective structure. At 1,209 subminuette wave c would reach equality in length with subminuette wave a. Minuette wave (x) may make a new low below 1,208.22, and if a double combination is unfolding this is entirely possible.
If minute wave a completes as a double zigzag or double combination this may be the A wave of a flat or triangle for minor wave 4.
Alternate Wave Count
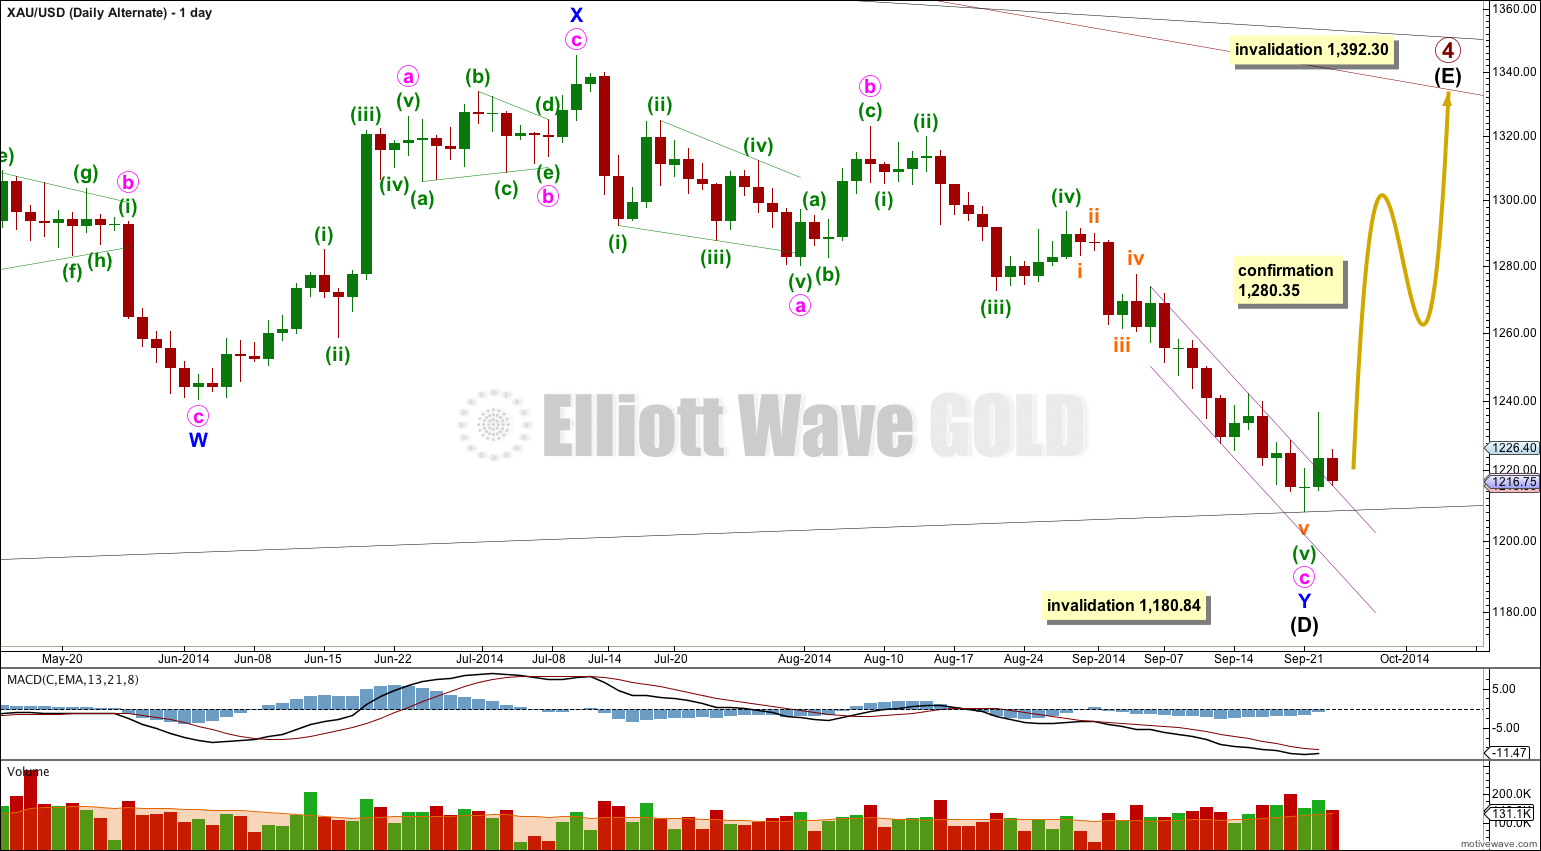
I would judge this wave count to have a very low probability mostly because of proportion between primary waves 2 and 4. The main wave count sees them almost exactly of the same duration, with primary wave 2 lasting 53 weeks and primary wave 4 lasting 54 weeks. This alternate would see primary wave 4 as much longer in duration than primary wave 2. It is the proportion between second and fourth waves within an impulse which gives the wave count what is called the “right look”. This alternate would still have the right look, but it would not look as good as the main wave count. It is also my experience over the years that of all markets I have analysed it is Gold which most often has amazingly close Fibonacci ratios in duration of its waves. It would be very typical for Gold to exhibit almost perfect proportion between primary waves 2 and 4.
If intermediate wave (D) continued further it could only be as a double zigzag. For a contracting triangle intermediate wave (D) may not move beyond the end of intermediate wave (B) below 1,180.84. For a barrier triangle intermediate wave (D) should end about the same level as intermediate wave (B), as long as the (B)-(D) trend line is essentially flat. In practice this means that intermediate wave (D) could end slightly below 1,180.84 and the wave count would remain valid. Unfortunately, this invalidation point is not black and white. This is the only Elliott wave rule which has any grey area.
If intermediate wave (D) is a double zigzag, then intermediate wave (C) must be seen as a single zigzag because only one of the five subwaves of a triangle may be a double.
There are a few problems within the subdivisions of intermediate wave (C) of this wave count which further reduce its probability.
This alternate wave count does not diverge from the main wave count at this stage, and will not diverge for another one or two weeks. The main wave count expects upwards movement for minor wave 4 and this alternate wave count expects upwards movement for intermediate wave (E). If price moves above 1,280.35 then the main wave count would be invalidated and this alternate confirmed.
Intermediate wave (E) of a contracting or barrier triangle may not move beyond the end of intermediate wave (C) at 1,392.30. This invalidation point is black and white.
This analysis is published about 06:29 p.m. EST.
Lara – the extra times of the day were added to your HOURLY charts, it is a great idea. Instead of just 12:00 previously. September 24th HOURLY chart shows 4:00 7:00 12:00 16:00 20:00. Thanks for the details.
Hi Lara, will minuette wave (c) subdivide into a 5 wave structure with i and ii being complete?