
Price has moved lower which was expected, but the short term target was not met.
The wave count remains mostly the same; targets remain the same.
Summary: The short term target at 1,241 should be met within 24 hours now. Thereafter, a small upwards correction may last a day or two. The mid term target remains the same at 1,231, with a second lower possibility at 1,221 – 1,218.
Click on charts to enlarge.
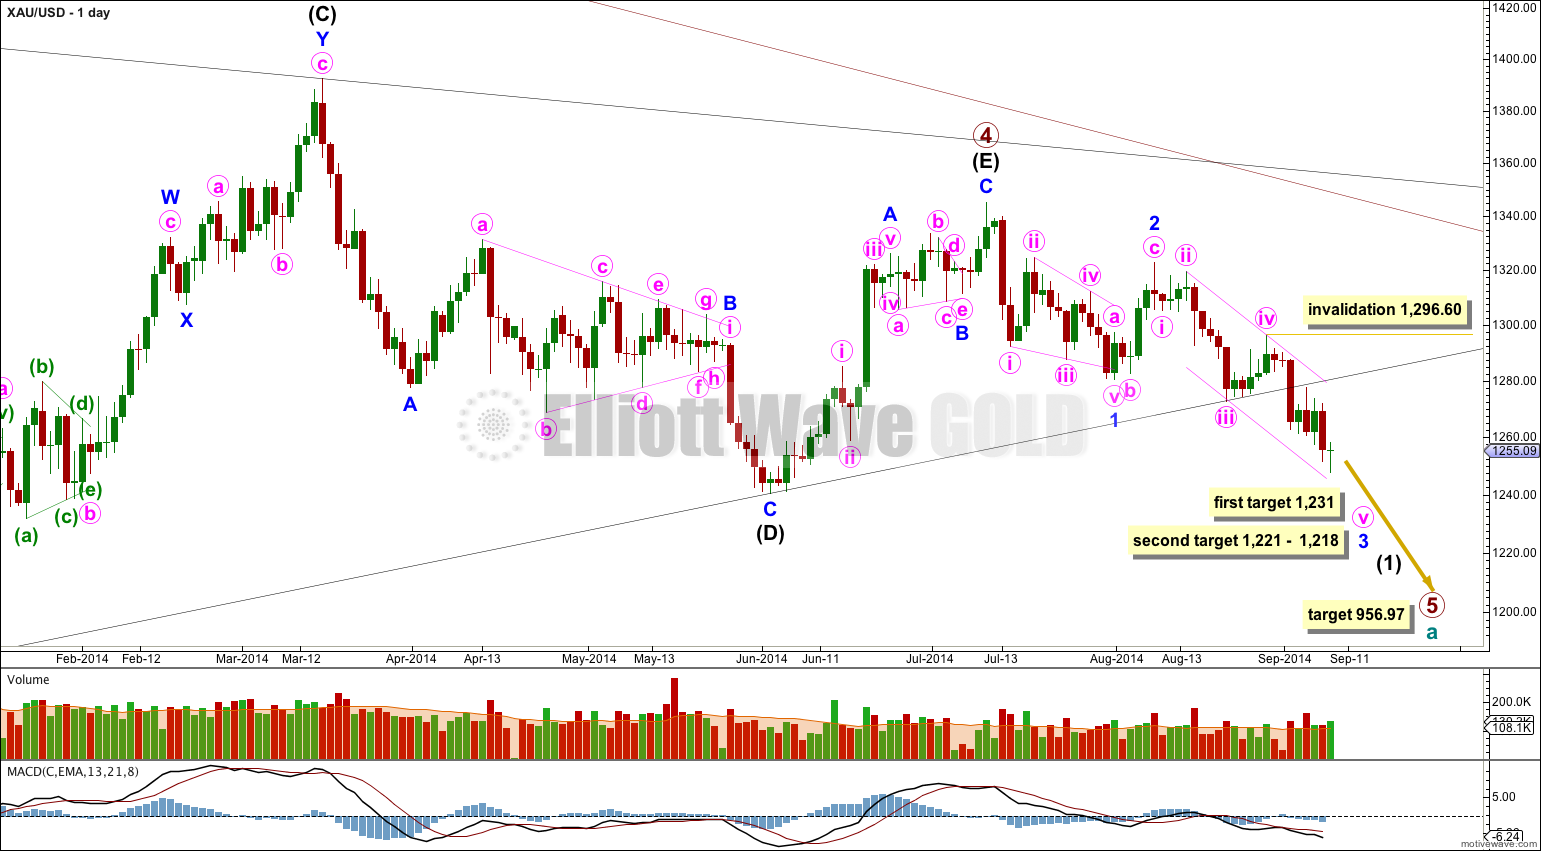
The black (B)-(D) trend line is clearly breached. There are now five clear daily candlesticks below this black trend line and so I have confidence that primary wave 5 has begun. The black (B)-(D) trend line is now also clearly breached on the weekly chart. This is significant.
In the last few trading days it is downwards days which have clearly higher volume. From a traditional technical analysis point of view this indicates the main trend is most likely down.
At 956.97 primary wave 5 would reach equality in length with primary wave 1. Primary wave 3 is $12.54 short of 1.618 the length of primary wave 1, and equality between primary waves 5 and 1 would give a perfect Elliott relationship for this downwards movement.
However, when triangles take their time and move close to the apex of the triangle, as primary wave 4 has (looking at this on a weekly chart is clearer) the movement following the triangle is often shorter and weaker than expected. If the target at 956.97 is wrong it may be too low. In the first instance I expect it is extremely likely that primary wave 5 will move at least below the end of primary wave 3 at 1,180.40 to avoid a truncation. When intermediate waves (1) through to (4) within primary wave 5 are complete I will recalculate the target at intermediate degree because this would have a higher accuracy. I cannot do that yet; I can only calculate it at primary degree.
On a weekly chart extend the triangle trend lines of primary wave 4 outwards. The point in time at which they cross over may be the point in time at which primary wave 5 ends. This does not always work, but it works often enough to look out for. It is a rough guideline only and not definitive. A trend line placed from the end of primary wave 4 to the target of primary wave 5 at this point in time shows primary wave 5 would take a total 26 weeks to reach that point, and that is what I will expect. So far it is in its ninth week.
Minor wave 1 is a leading contracting diagonal. This was followed by a somewhat deep correction, a zigzag for minor wave 2.
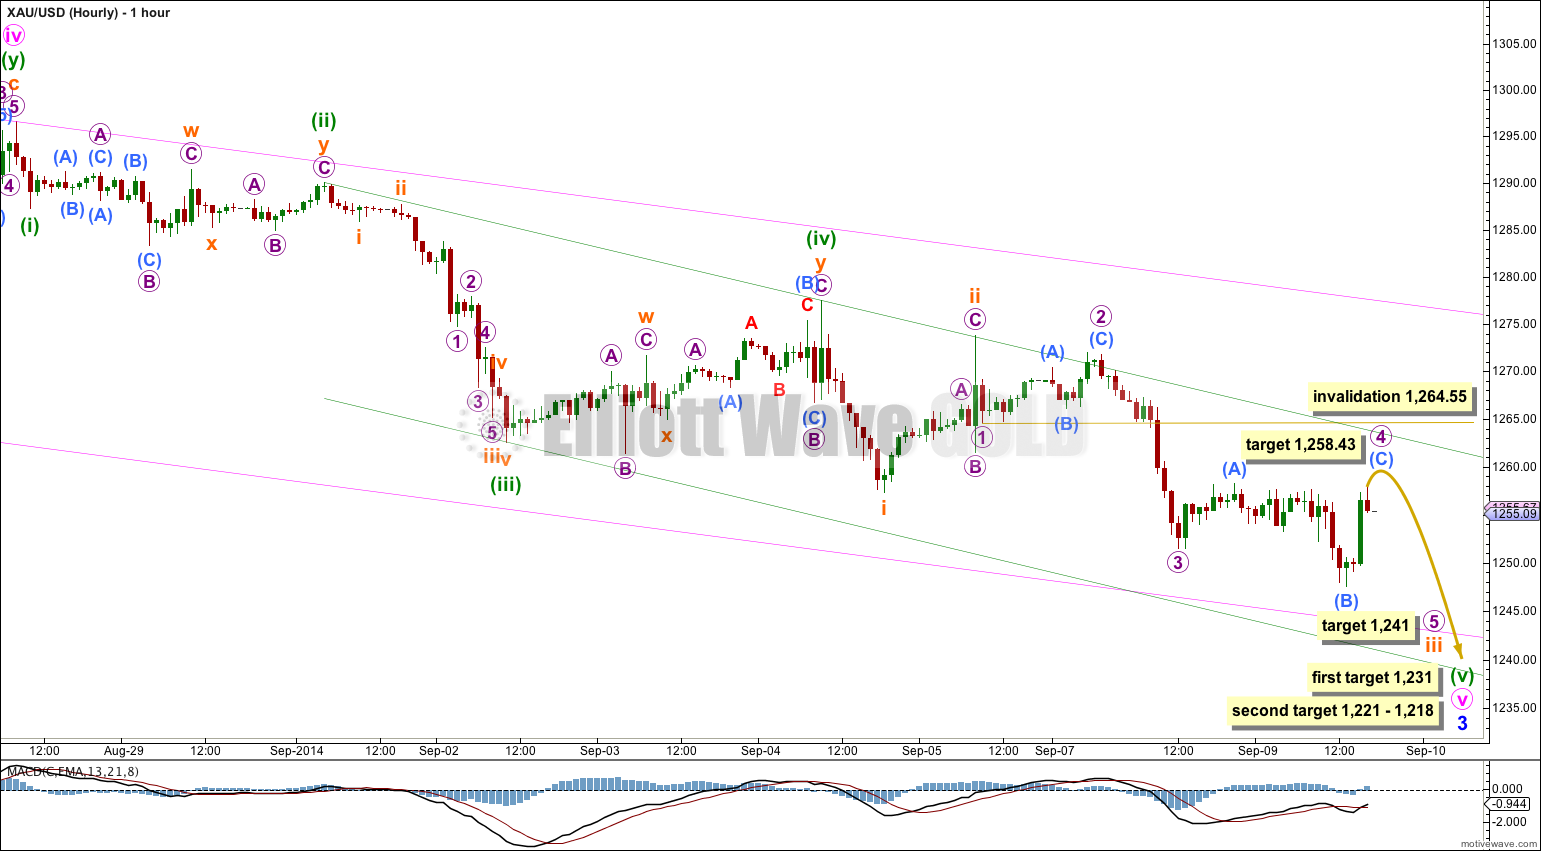
Within minute wave v no second wave correction may move beyond its start above 1,296.60.
Draw a channel about minor wave 3 on the daily chart and copy it over carefully to the hourly chart: draw the first trend line from the highs labeled minute waves ii to iv, then place a parallel copy on the low labeled minute wave iii. Expect downwards movement for minute wave v to find support, and maybe end, at this lower pink trend line.
I have adjusted the wave count slightly, but it makes no difference at this stage to target calculation or expected direction.
I expect that minuette wave (ii) lasted longer as a double flat correction. This resolves the problem of disproportion between subminuette waves ii and iv within minuette wave (iii). There is still no Fibonacci ratio between minuette waves (iii) and (i), so I will still expect to see a Fibonacci ratio for minuette wave (v).
Downwards movement continues to remain contained within the green channel drawn here about minute wave v. Draw this channel using Elliott’s second technique: draw the first trend line from the highs labeled minuette waves (ii) to (iv), then place a parallel copy on the low labeled minuette wave (iii).
I have considered alternative wave counts for this downwards movement. It is clearly an impulse, and one or two of the actionary waves are extending. Because there is an overlap between current upwards movement for micro wave 4 and the end of subminuette wave i at 1,257.34 this upwards movement cannot be subminuette wave iv, and so subminuette wave iii must be incomplete.
I have considered an extending third wave (rather than the fifth) but it does not work due to the overlap outlined above. I have considered an extending first wave and it does not work for the same reason. At this stage it looks most likely that it is the fifth wave extending, which is typical for commodities.
Micro wave 4 may be an incomplete expanded flat correction. At 1,258.43 submicro wave (C) would reach 1.618 the length of submicro wave (A) and would move beyond the end of submicro wave (A) at 1,258.24 avoiding a truncation and a very rare running flat correction.
At 1,241 subminuette wave iii would reach 1.618 the length of subminuette wave i.
When subminuette wave iii is over then subminuette wave iv should last more than one day, and is likely to show on the daily chart as a green candlestick or doji. The invalidation point for subminuette wave iv is the end of subminuette wave i at 1,257.34. Subminuette wave iv may not move back into subminuette wave i price territory.
The targets for minor wave 3 to end remain the same. At 1,231 minuette wave (v) would be extended and 1.618 the length of minuette wave (iii).
If price keeps dropping through the first target, or if when price gets there the structure is incomplete then I would use the second less likely target.
At 1,221 minute wave v would reach 1.618 the length of minute wave iii, and at 1,218 minor wave 3 would reach 1.618 the length of minor wave 1. Because there is already a close Fibonacci ratio between minute waves iii and i within minor wave 3 we may not see a Fibonacci ratio for minute wave v as well. For this reason this lower target has a lower probability.
While subminuette wave iii is incomplete micro wave 4 may not move into micro wave 1 price territory above 1,264.55.
This analysis is published about 05:57 p.m. EST.