
Upwards movement continues as expected. The double zigzag structure is even more likely and has the best fit.
Summary: The target for upwards movement to end is a small zone: 1,277 – 1,281. It looks like the target may now be met in either two or five more trading days.
Click on charts to enlarge.
Main Wave Count
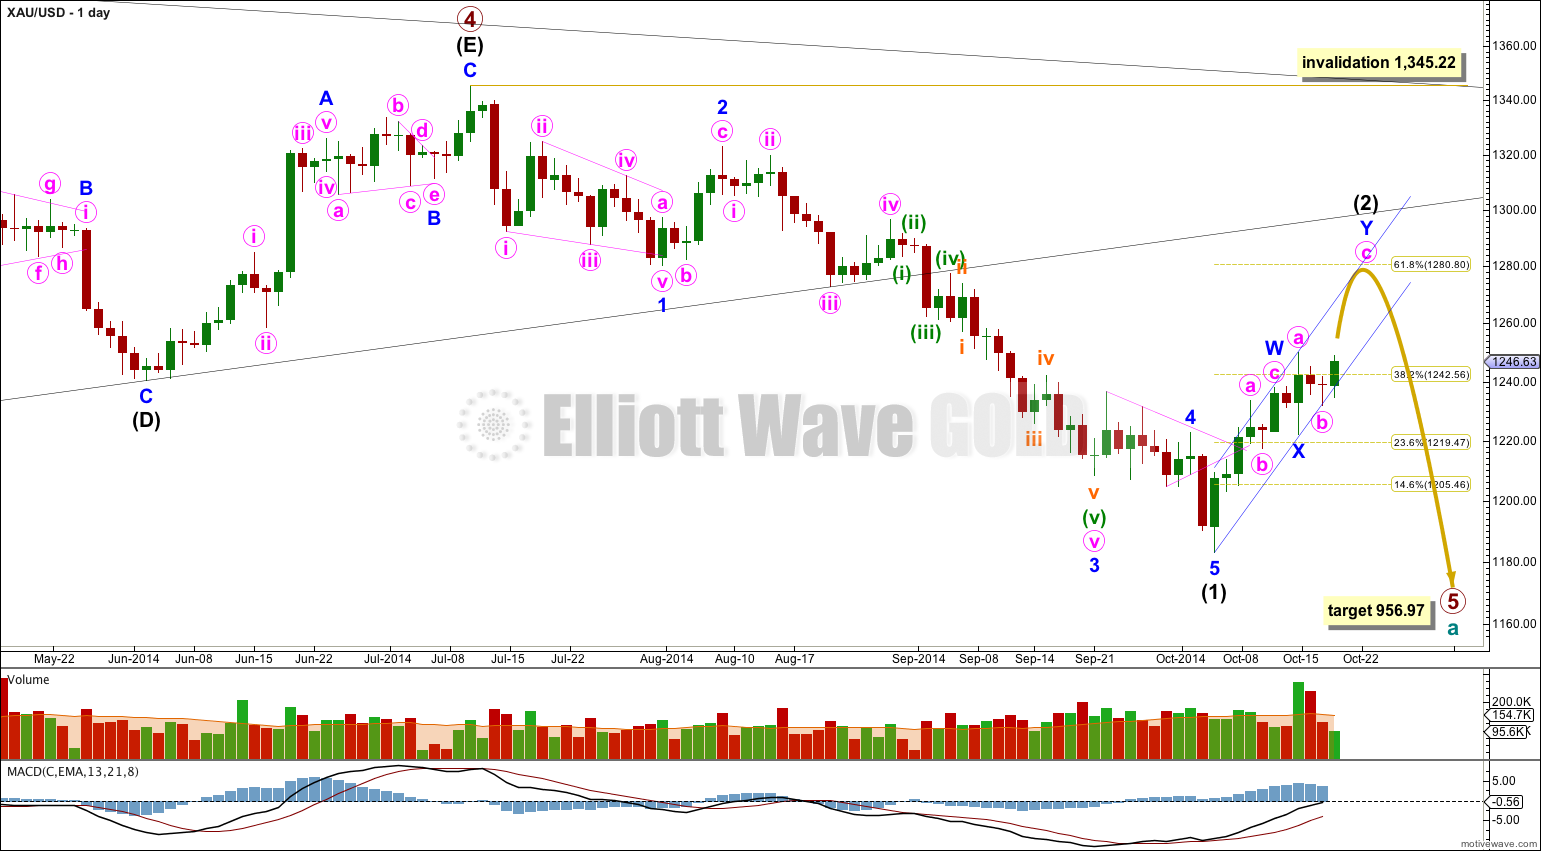
On the weekly chart extend the triangle trend lines of primary wave 4 outwards. The point in time at which they cross over may be the point in time at which primary wave 5 ends. This does not always work, but it works often enough to look out for. It is a rough guideline only and not definitive. A trend line placed from the end of primary wave 4 to the target of primary wave 5 at this point in time shows primary wave 5 would take a total 26 weeks to reach that point, and that is what I will expect. Primary wave 5 has just begun its 15th week.
At 956.97 primary wave 5 would reach equality in length with primary wave 1. Primary wave 3 is $12.54 short of 1.618 the length of primary wave 1, and equality between primary waves 5 and 1 would give a perfect Elliott relationship for this downwards movement.
However, when triangles take their time and move close to the apex of the triangle, as primary wave 4 has, the movement following the triangle is often shorter and weaker than expected, and this is my main reason for presenting the alternate wave count to you. If the target at 956.97 is wrong it may be too low. In the first instance I expect it is extremely likely that primary wave 5 will move at least below the end of primary wave 3 at 1,180.40 to avoid a truncation. When intermediate waves (1) through to (4) within primary wave 5 are complete I will recalculate the target at intermediate degree because this would have a higher accuracy, and the target may move higher. I cannot do that yet; I can only calculate it at primary degree.
Movement comfortably below 1,180.84 would provide further confidence in this main wave count as at that stage an alternate idea which sees primary wave 4 as continuing as a barrier triangle would be invalidated. I am not publishing this alternate idea as a chart because it has an extremely low probability.
Draw a best fit channel about intermediate wave (2) on daily and hourly charts: draw the first trend line from the start of intermediate wave (2) to the low labeled minor wave X, then place a parallel copy on the high of minor wave W. I would expect intermediate wave (2) to remain within this channel. When this small channel is clearly breached by downwards movement with a full daily candlestick below it and not touching the lower trend line that shall provide trend channel confirmation that intermediate wave (2) is over and intermediate wave (3) should be underway.
Within intermediate wave (2) minor wave W lasted a Fibonacci 5 days. So far minor wave Y has lasted 3 days. If it completes in a further 2 days it will equal the duration of minor wave W. Alternatively, it may complete in a further 5 days totaling a Fibonacci 8 days, and having a 1.618 duration of minor wave W.
Intermediate wave (2) may end close to a Fibonacci ratio of intermediate wave (1). Only because second waves are more commonly deep than shallow is the 0.618 ratio at 1,280.80 slightly favoured. But it does not have to be this deep.
At this stage I still have three hourly wave counts for you which look at three different corrective structures for intermediate wave (2). I present them in order of probability: a double zigzag is most likely, followed by a single zigzag, and last a flat correction as very unlikely.
Double Zigzag
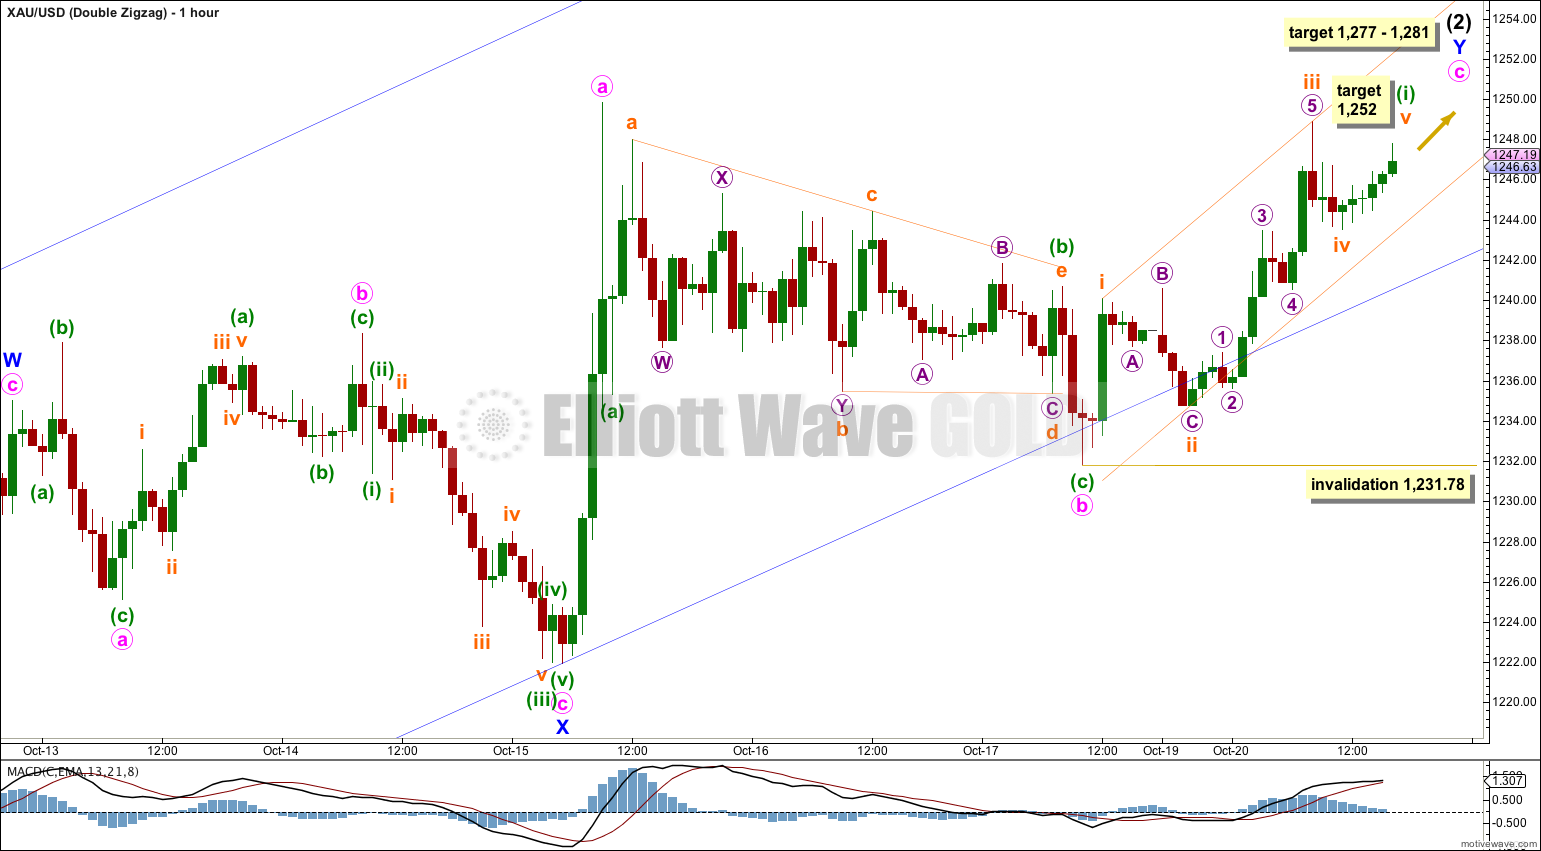
Minute wave c is unfolding upwards. It must subdivide as a five wave structure, most likely a simple impulse and less likely and ending diagonal. At 1,277 minute wave c would reach 1.618 the length of minute wave a. This is just below the 0.618 Fibonacci ratio of intermediate wave (1) at 1,281.
So far within minute wave c I do not think that minuette wave (i) is complete. Within minuette wave (i) subminuette wave iii is 0.79 longer than 1.618 the length of subminuette wave i. At 1,252 subminuette wave v would reach equality in length with subminuette wave i.
When minuette wave (i) is complete then minuette wave (ii) should move price lower but not below the start of minuette wave (i) at 1,231.78. I would expect minuette wave (ii) to most likely be quick and to not show on the daily chart as a red candlestick, although it could. Minuette wave (ii) should end about the lower edge of the best fit channel with only small overshoots.
When minuette wave (ii) is complete then upwards movement should increase in momentum beyond that seen for minuette wave (i) as a third wave up unfolds.
Overall this double zigzag wave count expects a green candlestick for Tuesday’s session, and continuing upwards movement with corrections along the way to find support about the lower blue trend line.
Single Zigzag
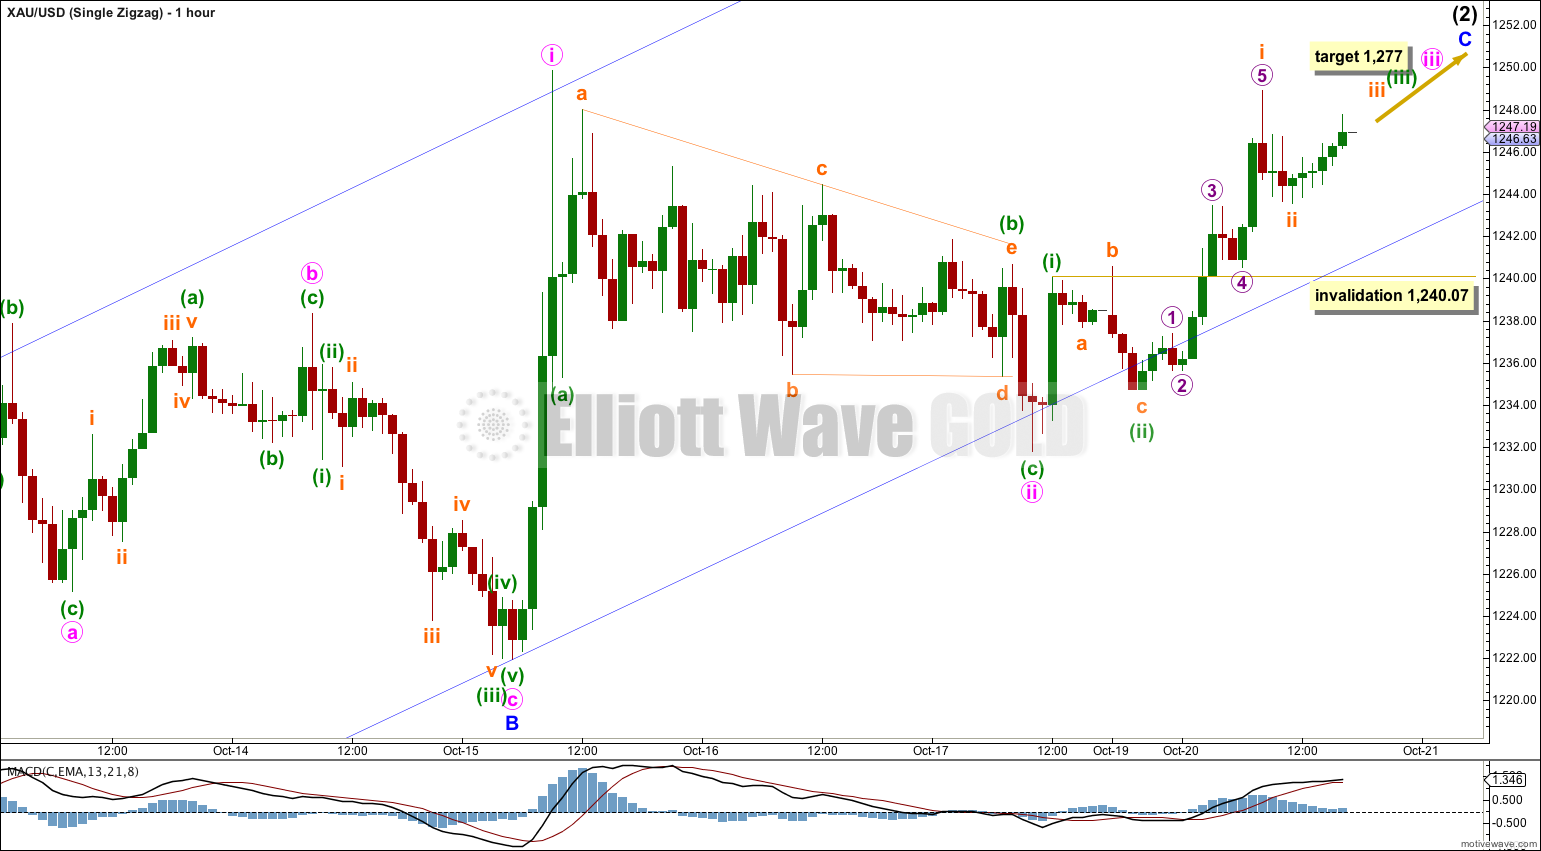
If intermediate wave (2) is unfolding as a single zigzag then this next wave up for minor wave C must subdivide as a five wave structure, most likely an impulse.
At 1,277 minute wave iii would reach 1.618 the length of minute wave i.
Within minute wave iii it does not look like minuette wave (iii) is complete because it has not shown an increase in upwards momentum beyond that seen for minute wave i. The middle of a third wave has not yet passed.
This wave count expects that minuette wave (iii) should end shortly, probably about the same target as the first hourly wave count at 1,252, and then be followed by a fourth wave correction. Minuette wave (iv) may not move back into minuette wave (i) price territory below 1,240.07. Downwards movement should stop before the invalidation point though as it finds support about the lower blue trend line.
When minute wave iii is a complete five wave structure then this wave count diverges from the double zigzag idea. This wave count would expect downwards movement for minute wave iv which may not move back into minute wave i price territory below 1,249.84. At that stage movement below that price point would invalidate this wave count and so provide some confidence in the first double zigzag wave count, which would expect the double zigzag to be complete.
Flat
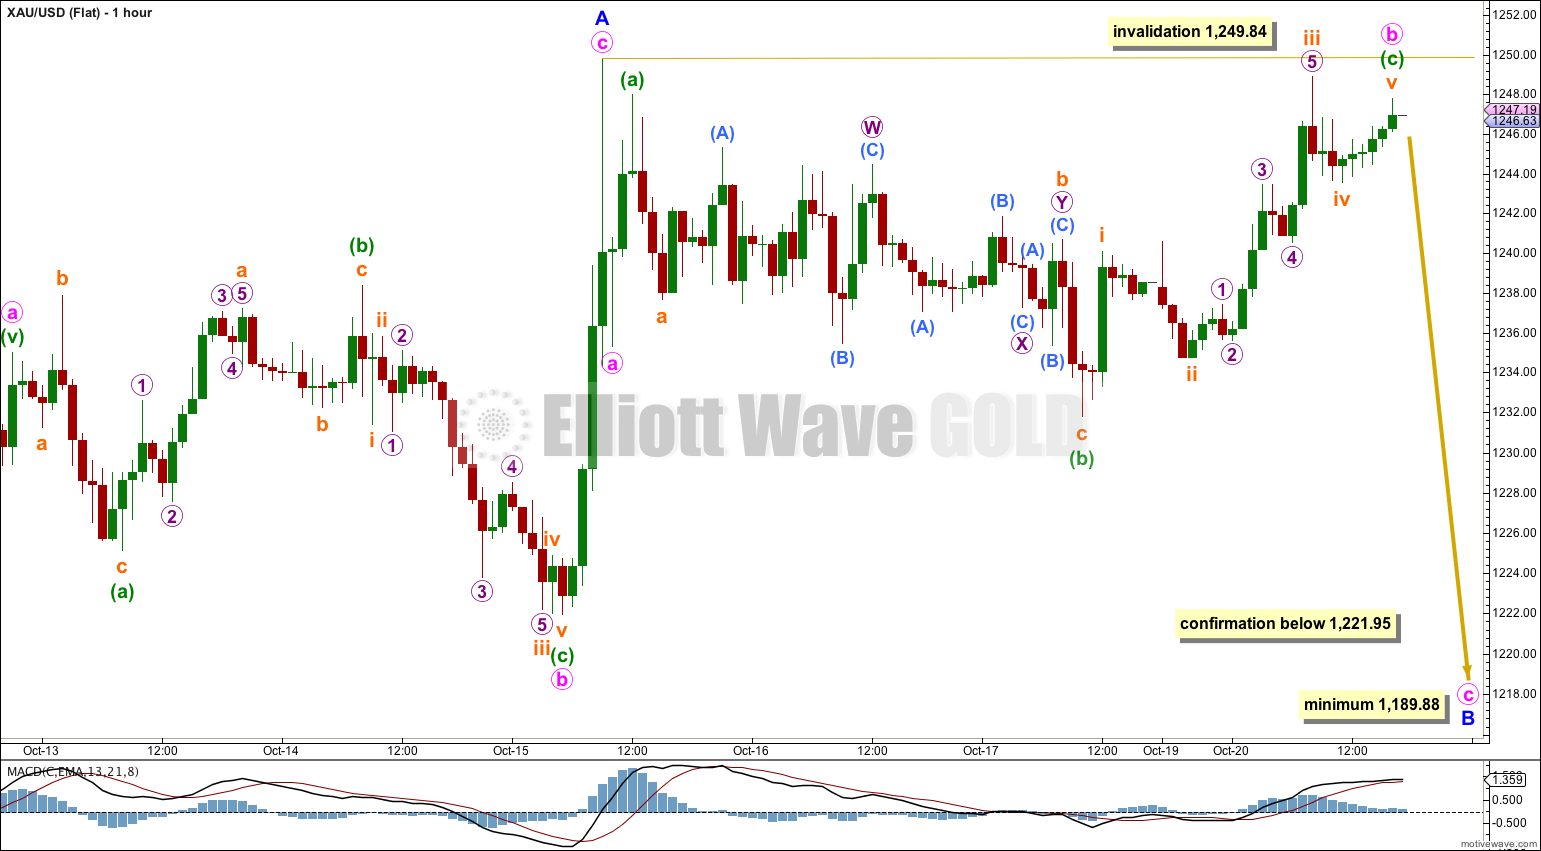
This wave count does not look right. Only if we see a new low below 1,221.95 would I use this wave count.
If intermediate wave (2) is unfolding as a flat correction then within it minor wave A subdivides as a three wave zigzag. Minor wave B within a flat must reach back down to a minimum 90% length of minor wave A at 1,189.88.
Minor wave B would be unfolding as a zigzag because minute wave a within it fits best as a five. Within the zigzag minute wave b may not move beyond the start of minute wave a above 1,249.84.
This wave count is reduced in probability by the running flat of micro wave W within minuette wave (b), and now the truncation of subminuette wave v within minuette wave (c), although that could be fixed by a slight new high.
Alternate Wave Count
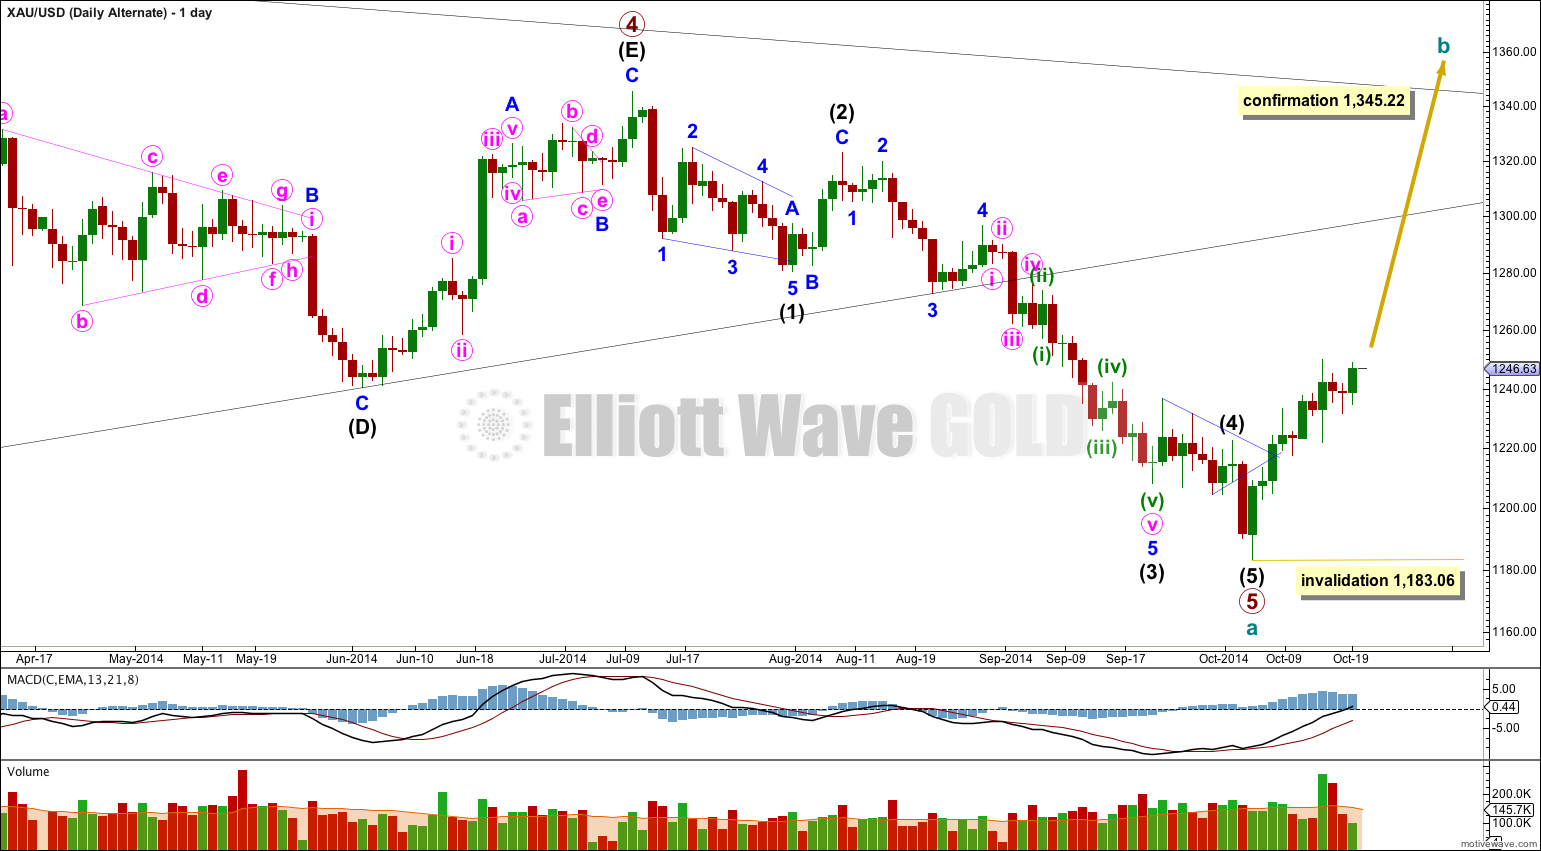
By simply moving the degree of labeling within primary wave 5 downwards all up one degree it is possible that primary wave 5 and so cycle wave a are over.
This wave count is reduced in probability by a small truncation. Primary wave 5 would be truncated by $2.66. The truncation is small though, so this wave count must be considered.
Movements out of triangles are often more brief and weak than expected, sometimes they are surprisingly brief. There is a nice example of what I mean by this here on the daily chart: after the triangle of intermediate wave (4) we saw a surprisingly quick short intermediate wave (5) down afterwards.
If price breaks out of the upper edge of the parallel channel about cycle wave a (look to the weekly chart for this channel) this would be first indication that this wave count is correct. This trend channel confirmation would come before price confirmation above 1,345.22.
The first movement upwards for cycle wave b should be a five wave structure. Within it no second wave correction may move beyond the start of its first wave below 1,183.06.
Movement above 1,345.22 would invalidate the main wave count and confirm this alternate.
At this stage upwards movement is not looking like an unfolding impulse because it is too choppy and overlapping, and so this alternate wave count is further reduced in probability.
This analysis is published about 06:21 p.m. EST.