
Downwards movement continued as expected. I have a new alternate Elliott wave count for you to consider today.
Summary: Downwards movement is incomplete. The target for it to end is at 1,182. It could be over sooner than expected.
Click on charts to enlarge.
Main Wave Count
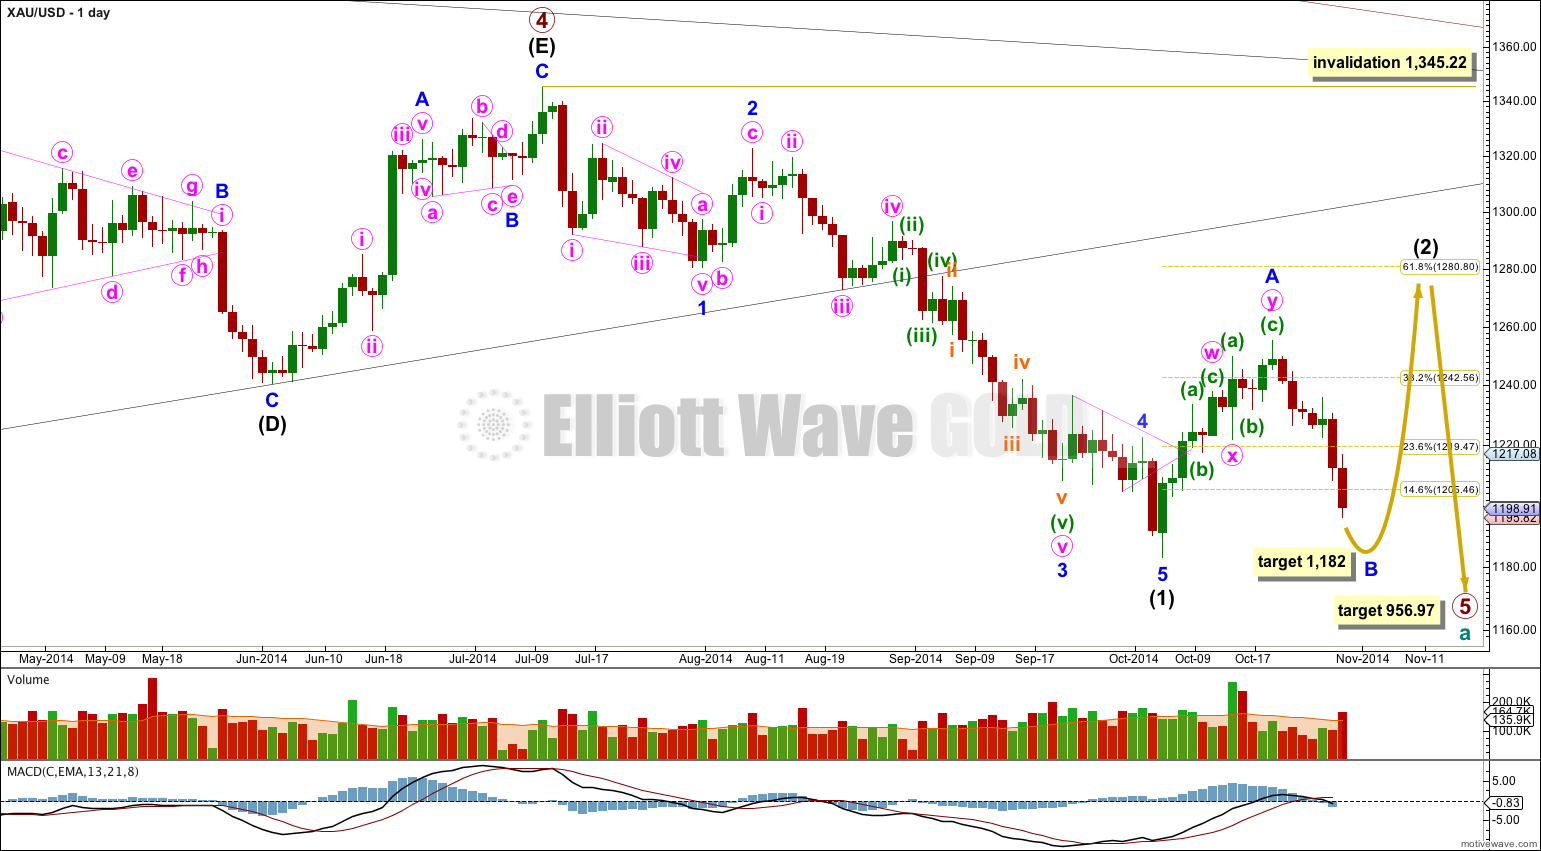
On the weekly chart extend the triangle trend lines of primary wave 4 outwards. The point in time at which they cross over may be the point in time at which primary wave 5 ends. This does not always work, but it works often enough to look out for. It is a rough guideline only and not definitive. A trend line placed from the end of primary wave 4 to the target of primary wave 5 at this point in time shows primary wave 5 would take a total 26 weeks to reach that point, and that is what I will expect. Primary wave 5 is in its 16th week.
At 956.97 primary wave 5 would reach equality in length with primary wave 1. Primary wave 3 is $12.54 short of 1.618 the length of primary wave 1, and equality between primary waves 5 and 1 would give a perfect Elliott relationship for this downwards movement.
However, when triangles take their time and move close to the apex of the triangle, as primary wave 4 has, the movement following the triangle is often shorter and weaker than expected, and this is my main reason for presenting the alternate wave count to you. If the target at 956.97 is wrong it may be too low. In the first instance I expect it is extremely likely that primary wave 5 will move at least below the end of primary wave 3 at 1,180.40 to avoid a truncation. When intermediate waves (1) through to (4) within primary wave 5 are complete I will recalculate the target at intermediate degree because this would have a higher accuracy, and the target may move higher. I cannot do that yet; I can only calculate it at primary degree.
Movement comfortably below 1,180.84 would provide further confidence in this main wave count as at that stage an alternate idea which sees primary wave 4 as continuing as a barrier triangle would be invalidated. I am not publishing this alternate idea as a chart because it has an extremely low probability.
Intermediate wave (2) may end close to a Fibonacci ratio of intermediate wave (1). Only because second waves are more commonly deep than shallow is the 0.618 ratio at 1,280.80 slightly favoured. But it does not have to be this deep. When we know where minor wave B has ended then I can calculate a target for intermediate wave (2) to end.
Intermediate wave (1) lasted 62 days. For the wave count to have the right look intermediate wave (2) should continue for longer than it has so far. Intermediate wave (2) is unfolding as a flat correction, subdividing 3-3-5. Within it minor wave B downwards must subdivide as a three, and may make a new low below the start of minor wave A at 1,183.06 as in an expanded flat. Minor wave A lasted 11 days, and I would expect minor wave B to be at least 11 days and maybe longer as B waves tend to be more time consuming structures.
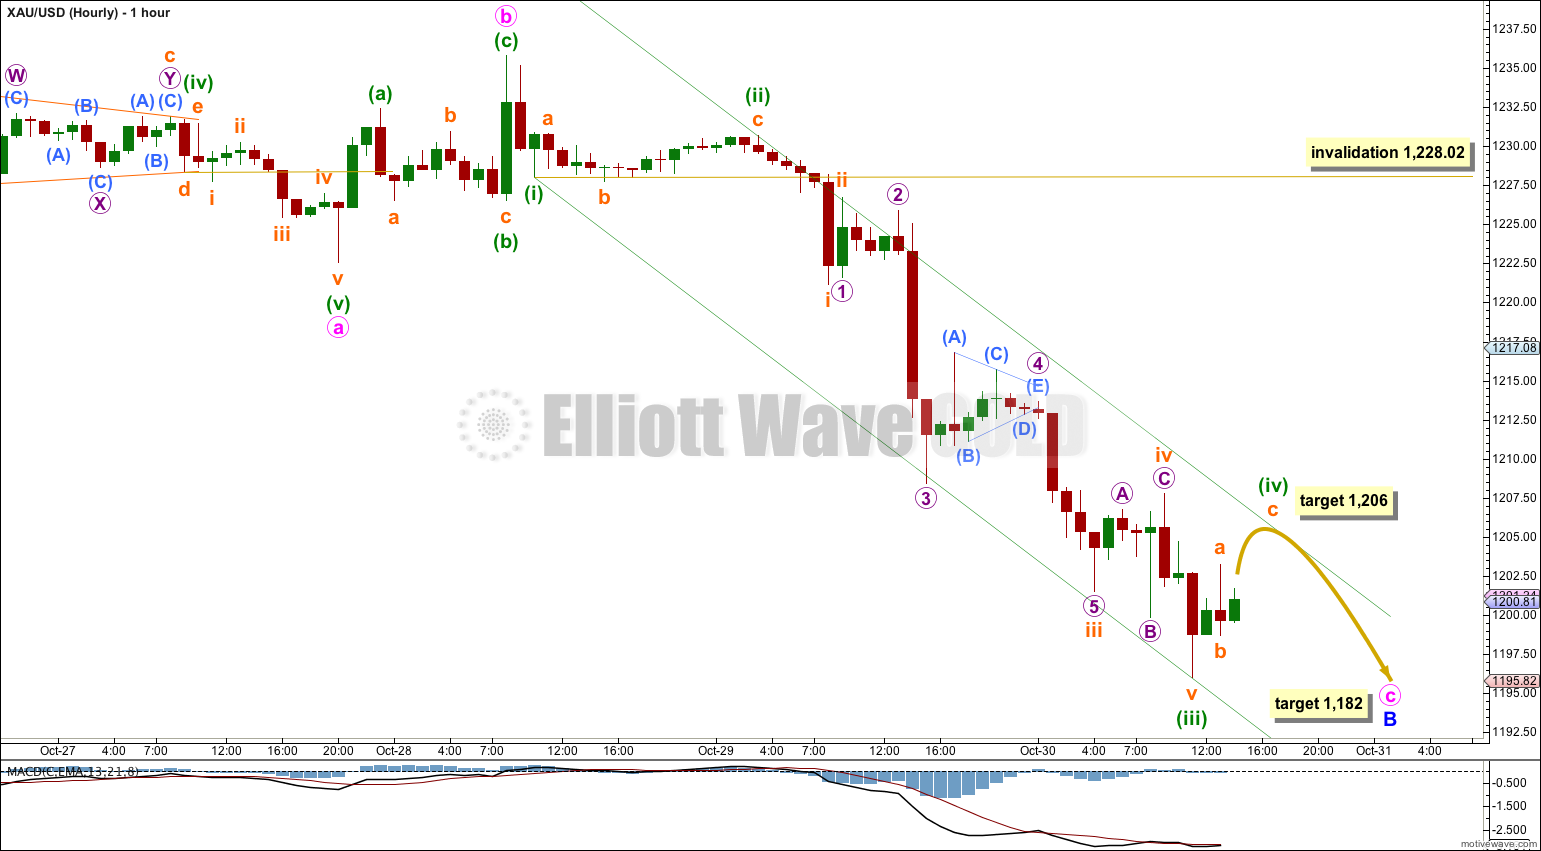
Downwards movement continues with only small corrections. The proximity to the final target has meant I have moved the degree of labelling within the early downwards movement all up one degree.
This movement fits nicely into a channel drawn using Elliott’s first technique: draw the first trend line from the lows labeled minuette waves (i) to (iii), then place a parallel copy on the high labeled minuette wave (ii). I would expect minuette wave (iv) to find resistance at the upper edge of the channel. When minuette wave (iv) is done I would expect minuette wave (v) downwards to find support at the lower edge of the channel. Look out for the possibility of a strong fifth wave, typical of commodities. Minuette wave (v) could break through support to overshoot the lower edge of the channel.
Minuette wave (iii) is 1.79 longer than 4.236 the length of minuette wave (i).
Ratios within minuette wave (iii) are: subminuette wave iii is 0.45 longer then 2.618 the length of subminuette wave iii, and subminuette wave v has no Fibonacci ratio to either of subminuette waves iii or i.
Within subminuette wave iii there are no adequate Fibonacci ratios between micro waves 1, 3 and 5.
Minuette wave (iv) may not move into minuette wave (i) price territory above 1,228.02. It is most likely to end within the price territory of the fourth wave of one lesser degree, between 1,199.87 and 1,207.77. At 1,206 subminuette wave c would reach equality in length with subminuette wave a.
Minuette wave (ii) is a rare running flat correction. The subdivisions fit, particularly for subminuette wave b within it. Minuette wave (iv) is showing structural alternation as a zigzag.
Overall I do not expect this fourth wave correction to be time consuming. I expect to see another red candlestick for Friday’s session. If downwards movement for minor wave B ends in one more trading day it would last a total Fibonacci 8 sessions. Minor wave B must reach down to 1,190.04 or below.
Alternate Wave Count I
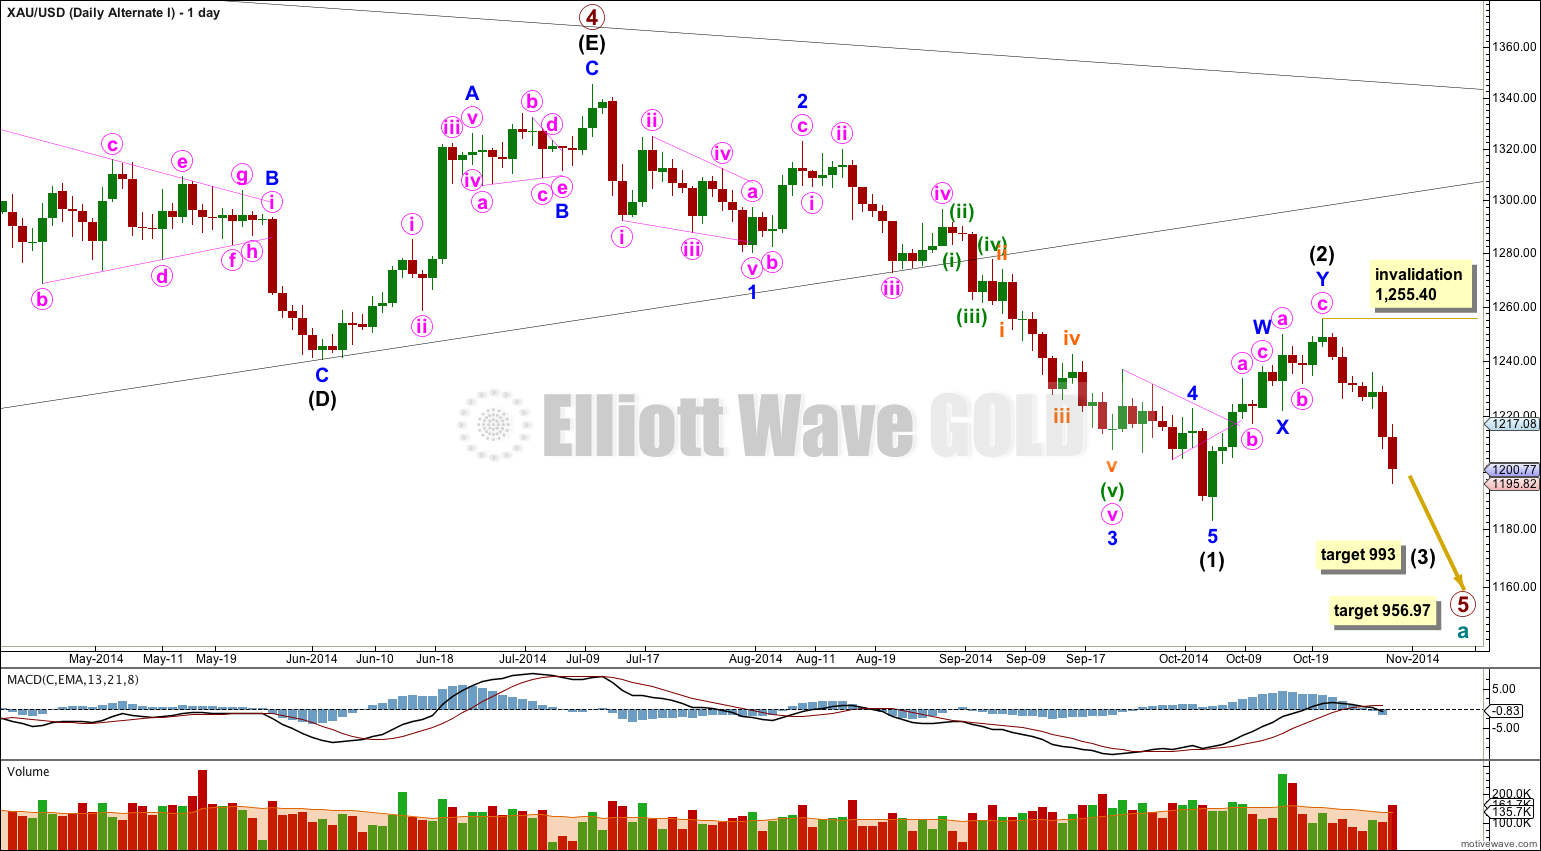
It is possible that the double zigzag is a completion of intermediate wave (2), but this idea has a very low probability.
This would see intermediate wave (2) only 45% of intermediate wave (1), but more importantly it would have lasted only 11 days in comparison to the 62 days for intermediate wave (1). This is too brief to give the wave count the “right look” on the daily chart.
This alternate also expects downwards movement. If price moves below 1,231.78 then only careful attention to structure (is it a three or a five?) of the next wave down would tell if this alternate is correct or if intermediate wave (2) is continuing as a flat correction. At this stage downwards movement is too slow and lacking in momentum to look like a third wave. It looks more like a B wave.
At 993 intermediate wave (3) would reach 1.618 the length of intermediate wave (1).
Alternate Wave Count II
Note: I am not going to publish the prior alternate wave count II which sees primary wave 5 over. I want to keep the number of charts manageable, and I consider that alternate to have the lowest probability of all three alternates I am considering. If it shows itself to be true I will again publish it.
Alternate Wave Count III
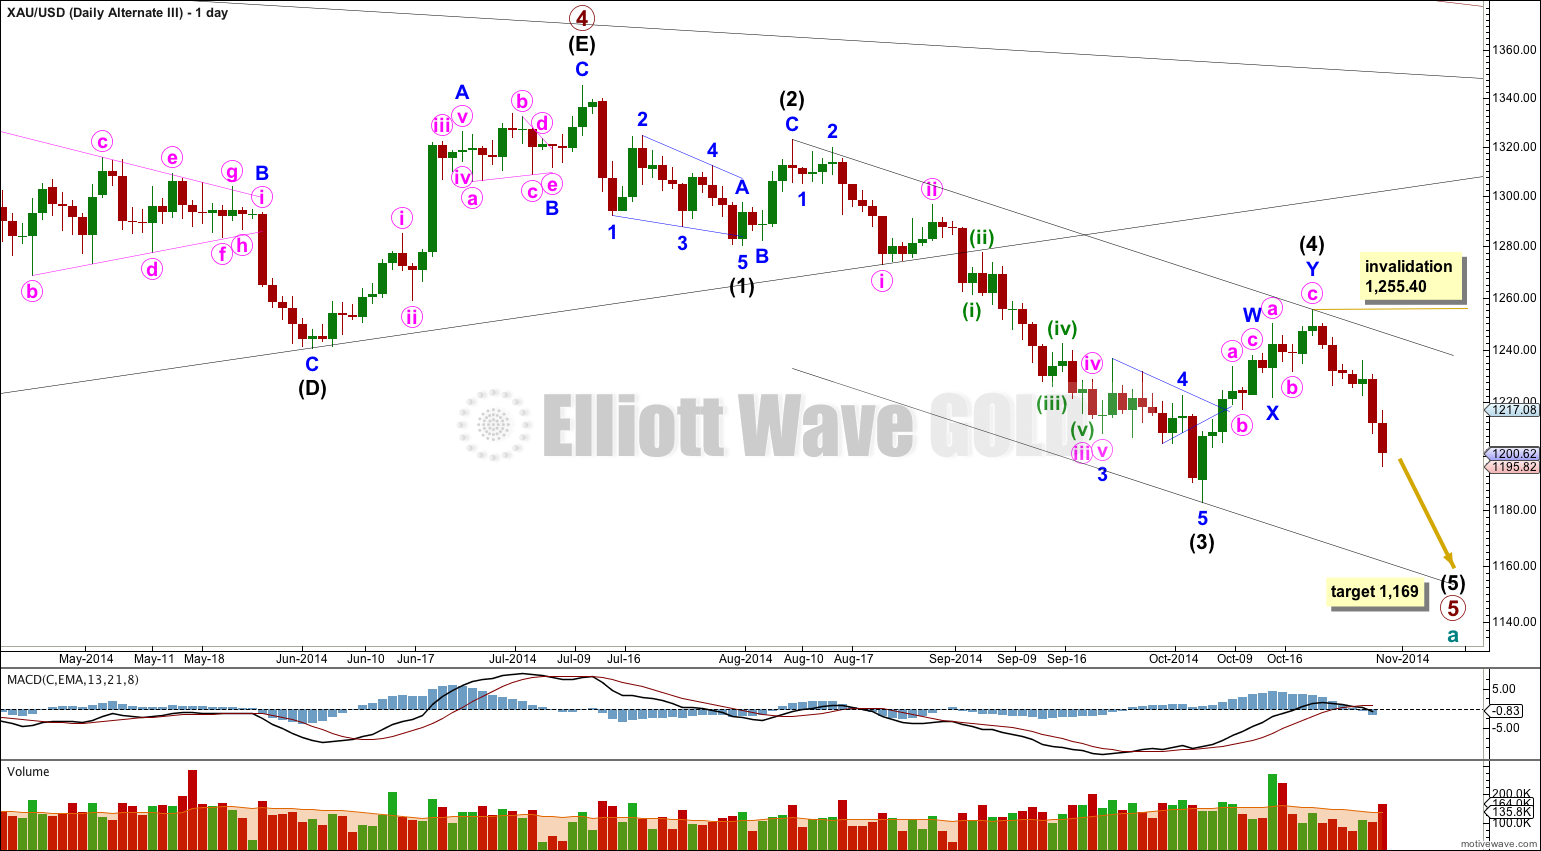
I have checked the subdivisions for this wave count which was suggested by one of our members, Bob. The subdivisions fit for intermediate wave (3) on the hourly chart.
It is possible that primary wave 5 is nearing its end, but this idea still has a rather low probability.
This wave count moves the degree of labelling within primary wave 5 all up one degree. There is no divergence in expected direction. The divergence will only come after this current downward wave is done.
The biggest problem with this wave count is the lack of alternation between intermediate waves (2) and (4): intermediate wave (2) is a deep 65% single zigzag lasting a Fibonacci 5 days and intermediate wave (4) is a somewhat deep 52% double zigzag lasting 11 days. Single and double zigzags are different structures, but they are very similar and belong to the same family. It is not common to see one in a second wave position and the other in a corresponding fourth wave position, especially when both are close to similar depth.
There is no Fibonacci ratio between intermediate waves (3) and (1) so this wave count would expect to see a Fibonacci ratio between intermediate wave (5) and either of (1) or (3). If intermediate wave (5) were to reach equality in length with intermediate wave (1) it would be truncated. The next likely ratio is 0.618 the length of intermediate wave (3) at 1,169.
Within intermediate wave (5) no second wave correction may move beyond the start of its first wave above 1,255.40.
This analysis is published about 03:48 p.m. EST.
Next analysis answers all questions.
My opinion is that : if main wave count is still valid, the low at 1.161,13 is the end of minor wave B. For the alternate count III, the low at 1.161,13 is the end of primary wave 3. So, in both cases I expect up movements from there. Attention guys, this is just my opinion and I am learning……is better to wait for Lara !!
5 minutes until the US markets open. I would like to buy at these prices however I will hold until clarification because some analysts suggest that.
“Very important longer-term chart support lies around the $1,183 price level. If that critical technical price point is breached on the downside, more serious technical damage would be inflicted, including opening the door to a potential major leg down in prices.”
I have heard it could be a big drop below 1,183. I think Lara can save the day with clarification or perhaps an invalidation point, please or else I just play it safe and wait for tonight.
Yes at important times like this a special alert would be a very good idea
The problem with that though is my time zone. I’m fast asleep while the market made its big move.
I’m +13GMT (or +12? not sure with daylight savings)
I am expecting it will go up from here, but we need to pass that confirmation point (I forget exactly right now, 1,192? its in the new analysis) before I have confidence in this trend change.
So its up to you how you wish to manage that risk.
anyone buying here?
Lara what do u say about todays movement plz elaborate: waiting for ur comment
Alternate Wave Count III appears to be the chart of the day because gold dropped to 1,167.06 at 3:07 EST , which now shows up as (5) 5 circle a.
The end of the 3 year gold bear market and start of a new multi-year Gold Bull Rally. A special thanks goes out to BOB B, who suggested Alternate Wave Count III on October 29th.
“Bob B • a day ago
Lara, Is there any chance that the subdivisions would support a count that we are in Intermediate Wave 5 down?”
Lara now that Primary wave 5 has ended, please let us know what is in store for us in this new Bull Rally.
I loaded up on my gold investments on Friday. This new Bull Rally comes as a sudden surprise. I hope it is all terrific news with sky high targets and no downward corrections in the near future. Pretty please. LOL
is it the last wave count alternate 3 or any other wave count plz update thanks
Lara, how do you explain wave v of (iii) as an impulse? It looks like as clear a ‘three’ as you can get. It looks like a perfect zigzag. I checked 5 min chart as well.
No, I did not check that on the 5 minute chart. Yes, it looks so much like a three, I can’t see how that could be a five at all actually.
And that changes the wave count somewhat…. but now there is a problem of proportion.
Lara can we get your input about the current situation?
Is this not behaving like a third wave down? Both gdx and gold?
Yeah, it looks like it could be an extended wave 3 in the final 5th wave down.
I think thats exactly what it was.
Heres a trick though, it took me a while (after analysing mostly Forex and Indicies for years) to get used to fifth waves in commodities. They can look remarkably like third waves, they can be really strong and fast, breach channels and have stronger momentum. For a long time when I saw that I expected it was a third wave, and so I was expecting price to keep moving in the same direction for the final fifth wave. And so a fair few times I got caught out.
Now I’m a bit more confident with them, and I know that I have to pay very careful attention to structure to see if it is a fifth or third wave.
The really annoying thing though is that commodities can behave like that in BOTH their fifth and third waves!