
The correction is over and the breakout was downwards as expected.
Summary: The target for minor wave 5 to end is at 1,154. If this target is wrong it may be too low.
Update: It has occurred to me that often movements following the completion of a triangle are surprisingly short and brief. We must consider the possibility that minor wave 5 is very close to completion and could be over on Monday. This idea would move the degree of labeling within minor wave 5 on the hourly chart up one degree. I will publish this as an alternate after Monday’s session. If it is correct it would be confirmed with a new high above 1,219.14.
Click on charts to enlarge.
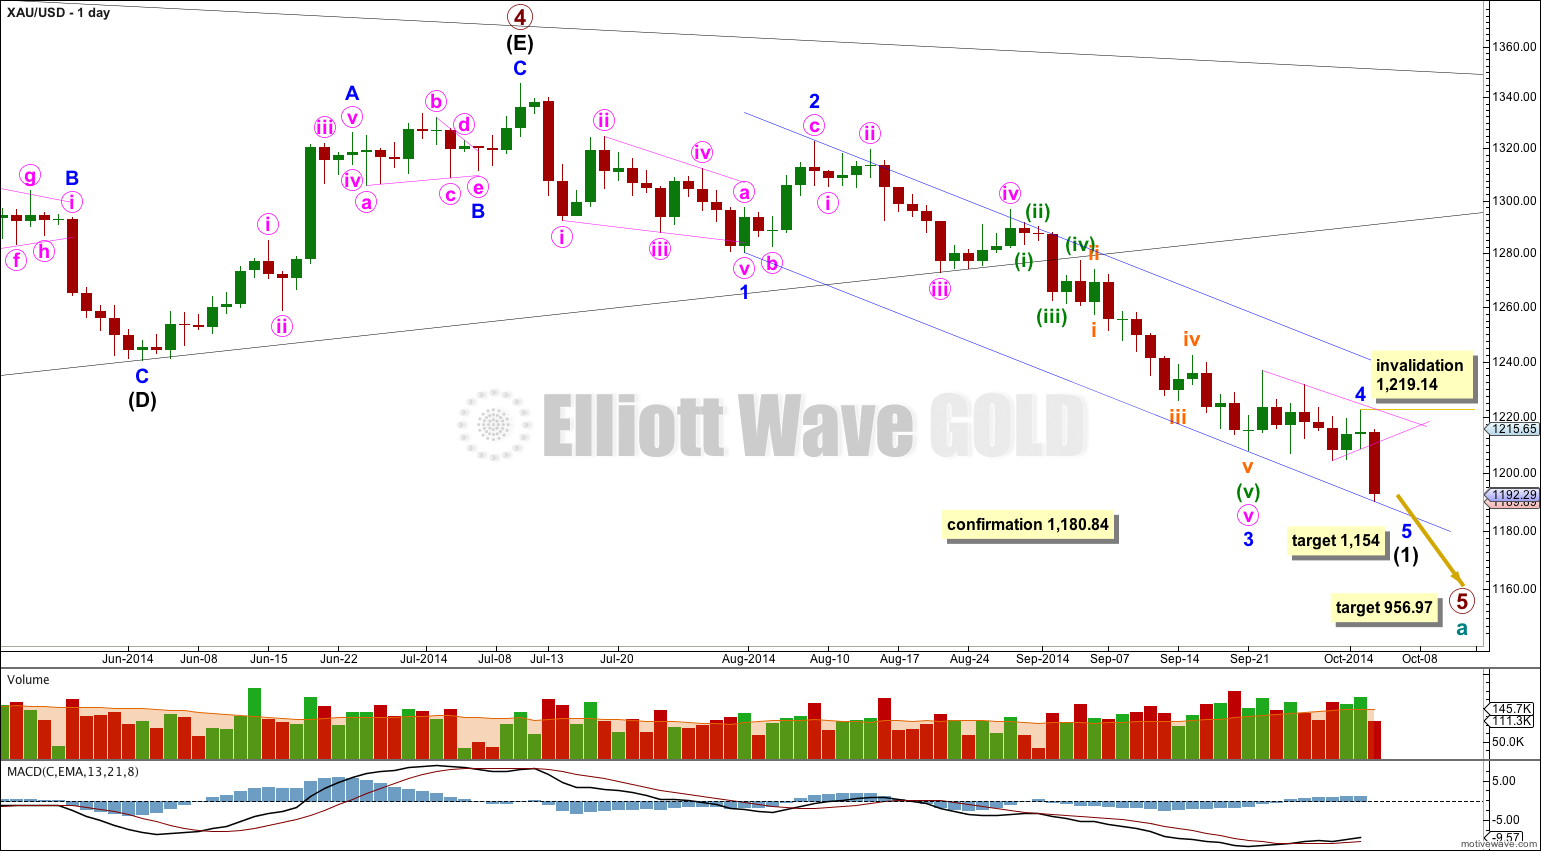
On the weekly chart extend the triangle trend lines of primary wave 4 outwards. The point in time at which they cross over may be the point in time at which primary wave 5 ends. This does not always work, but it works often enough to look out for. It is a rough guideline only and not definitive. A trend line placed from the end of primary wave 4 to the target of primary wave 5 at this point in time shows primary wave 5 would take a total 26 weeks to reach that point, and that is what I will expect. Primary wave 5 is ending its 12th week.
At 956.97 primary wave 5 would reach equality in length with primary wave 1. Primary wave 3 is $12.54 short of 1.618 the length of primary wave 1, and equality between primary waves 5 and 1 would give a perfect Elliott relationship for this downwards movement.
However, when triangles take their time and move close to the apex of the triangle, as primary wave 4 has (looking at this on a weekly chart is clearer) the movement following the triangle is often shorter and weaker than expected. If the target at 956.97 is wrong it may be too low. In the first instance I expect it is extremely likely that primary wave 5 will move at least below the end of primary wave 3 at 1,180.40 to avoid a truncation. When intermediate waves (1) through to (4) within primary wave 5 are complete I will recalculate the target at intermediate degree because this would have a higher accuracy. I cannot do that yet; I can only calculate it at primary degree.
Minor wave 3 is $9.65 longer than 1.618 the length of minor wave 1. This variation is less than 10% the length of minor wave 3 and so I would consider it an acceptable Fibonacci ratio. Just. At 1,154 minor wave 5 would reach equality in length with minor wave 1. When I can add to the target calculation at minute degree this target may change, and if it changes it may move higher.
Movement comfortably below 1,180.84 would provide further confidence in this main wave count as at that stage an alternate idea which sees primary wave 4 as continuing would be invalidated.
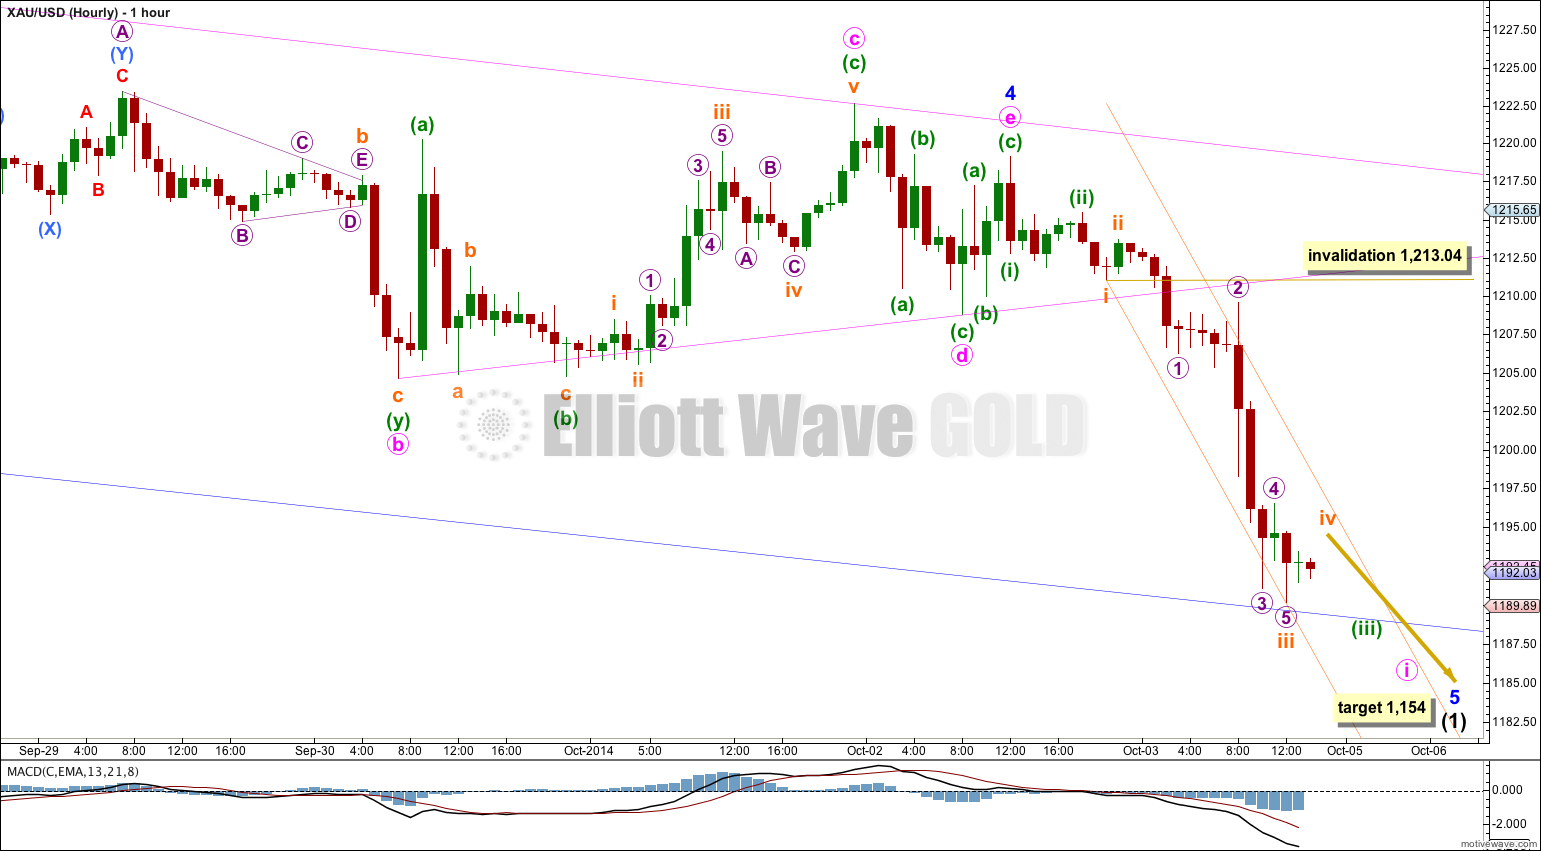
Draw a channel about intermediate wave (1): draw the first trend line from the lows labeled minor waves 1 to 3, then place a copy on the high labeled minor wave 2. Minor wave 5 down has so far found support at the lower edge of this channel. This may be where minute wave i within minor wave 5 ends.
Minor wave 4 completed as a triangle, and it was actually over at the time of last analysis. I had thought minute waves d and e looked too brief, and they don’t show clearly on the daily chart. But subsequent price action proves minor wave 4 is over.
Draw the triangle trend lines about minor wave 4 carefully and extend them out to the right. The point in time at which they cross over may see a trend change, and this may be when minor wave 5 ends. This does not always work, but it works often enough to look out for it. If this works then minor wave 5 may end in three more days. If this expectation is wrong minor wave 5 may last another four or seven days to total a Fibonacci 5 or 8.
Within minor wave 5 minute wave i is incomplete.
Within minute wave i minuette wave (iii) is close to completion. Because it is very long in comparison to minuette wave (i) we may not see a Fibonacci ratio between minuette waves (i) and (iii). The best way to see where minuette waves (iii) and (v) may end will probably be the lower blue trend line copied over here from the daily chart.
While minute wave i is incomplete subminuette wave iv may not move into subminuette wave i price territory above 1,213.04.
When minute wave i is complete I would expect minute wave ii to probably find resistance at the lower b-d pink trend line of the minor wave 4 triangle, although it does not have to be that deep.
When minute wave i is complete the invalidation point must move up to its start. Therefore, minute wave ii may not move beyond the start of minute wave i above 1,219.14.
This analysis is published about 03:33 p.m. EST.
Hello Lara,
When do you expect wave 5 to end, January?
In 13 weeks time.
And yes, that takes it up to early January.