
The main hourly wave count was correct. Price did not move as low as the target at 1,137, but it did reach the minimum at 1,148.96. Thereafter, strong upwards movement was expected for the first two hourly wave counts, although the target at 1,179 – 1,183 was met and passed by $10.71.
Summary: Minor wave 2 is now most likely over. A new low below 1,180.37 would provide confidence. The target for minor wave 3 to end is at 1,004.
Click on charts to enlarge.
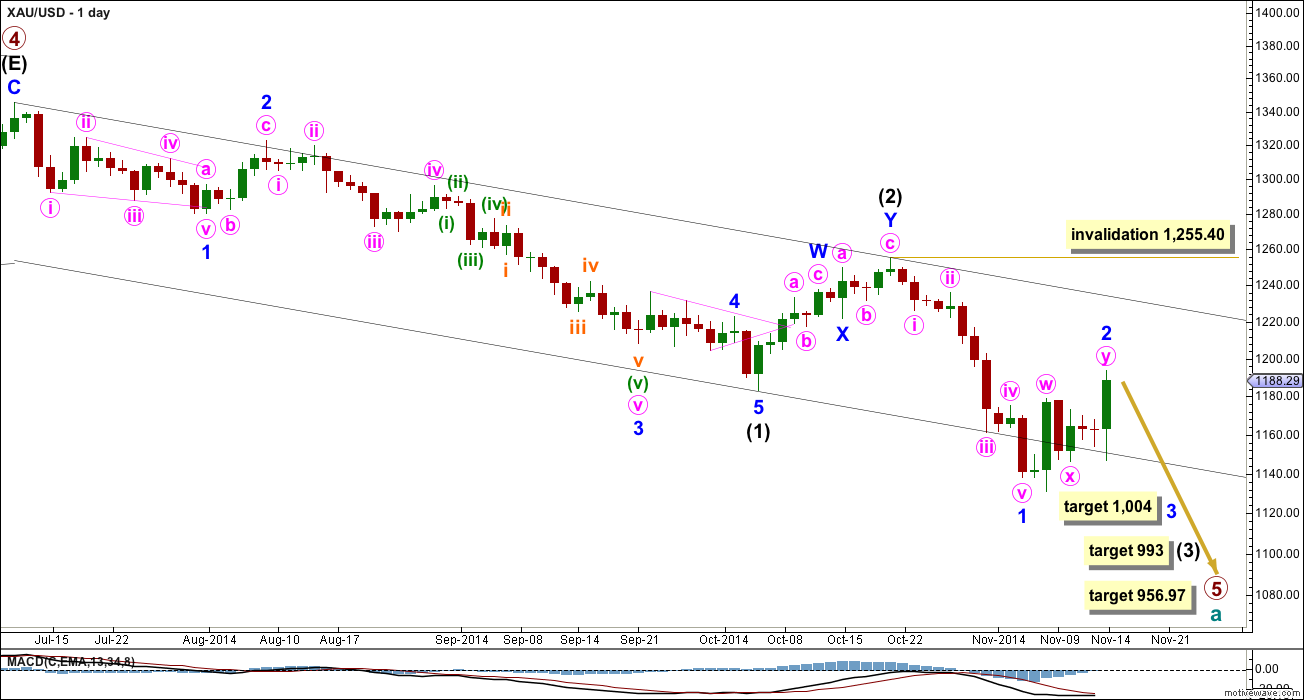
Primary wave 4 is complete and primary wave 5 is unfolding. Primary wave 5 may only subdivide as an impulse or an ending diagonal. So far it looks most likely to be an impulse.
Within primary wave 5 intermediate wave (1) fits perfectly as an impulse. Intermediate wave (2) is a relatively shallow 45% double zigzag correction.
Intermediate wave (1) lasted a Fibonacci 13 weeks. I would expect intermediate wave (3) to be extended in both price and duration. If it lasts a Fibonacci 21 weeks it would be 1.618 the duration of intermediate wave (1). So far intermediate wave (3) is in its third week.
Intermediate wave (3) may only subdivide as an impulse, and at 993 it would reach 1.618 the length of intermediate wave (1).
The target for primary wave 5 at this stage remains the same. At 956.97 it would reach equality in length with primary wave 1. However, if this target is wrong it may be too low. When intermediate waves (1) through to (4) within it are complete I will calculate the target at intermediate degree and if it changes it may move upwards. This is because waves following triangles tend to be more brief and weak than otherwise expected. A perfect example is on this chart: minor wave 5 to end intermediate wave (1) was particularly short and brief after the triangle of minor wave 4.
Intermediate wave (3) must move far enough below the end of intermediate wave (1) to allow room for upwards movement for intermediate wave (4) which may not move into intermediate wave (1) price territory.
Minor wave 2 may not move beyond the start of minor wave 1 above 1,255.40.
The black channel is a base channel about intermediate waves (1) and (2): draw the first trend line from the start of intermediate wave (1) to the end of intermediate wave (2), then place a parallel copy on the end of intermediate wave (1). Intermediate wave (3) has breached the lower edge of the base channel which is expected.
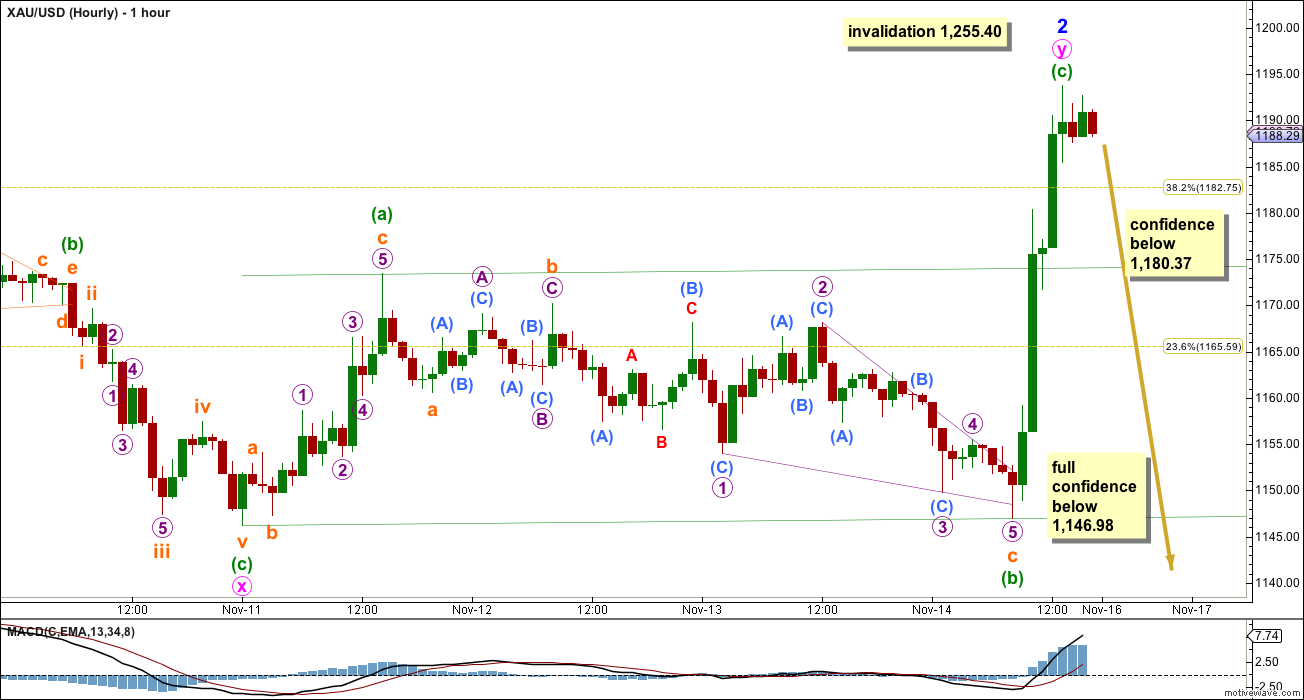
Minor wave 2 subdivides perfectly now as a double flat correction. The first structure is an expanded flat labelled minute wave w. The double is joined by a three in the opposite direction, a zigzag labelled minute wave x. The second structure in the double is a regular flat correction labelled minute wave y.
Within minute wave y minuette wave (b) is a 97% correction of minuette wave (a). Minuette wave (c) $2.82 longer than 1.618 the length of minuette wave (a).
Minor wave 2 may have been over in 7 days, about 0.618 the duration of minor wave 1 which lasted 11 days.
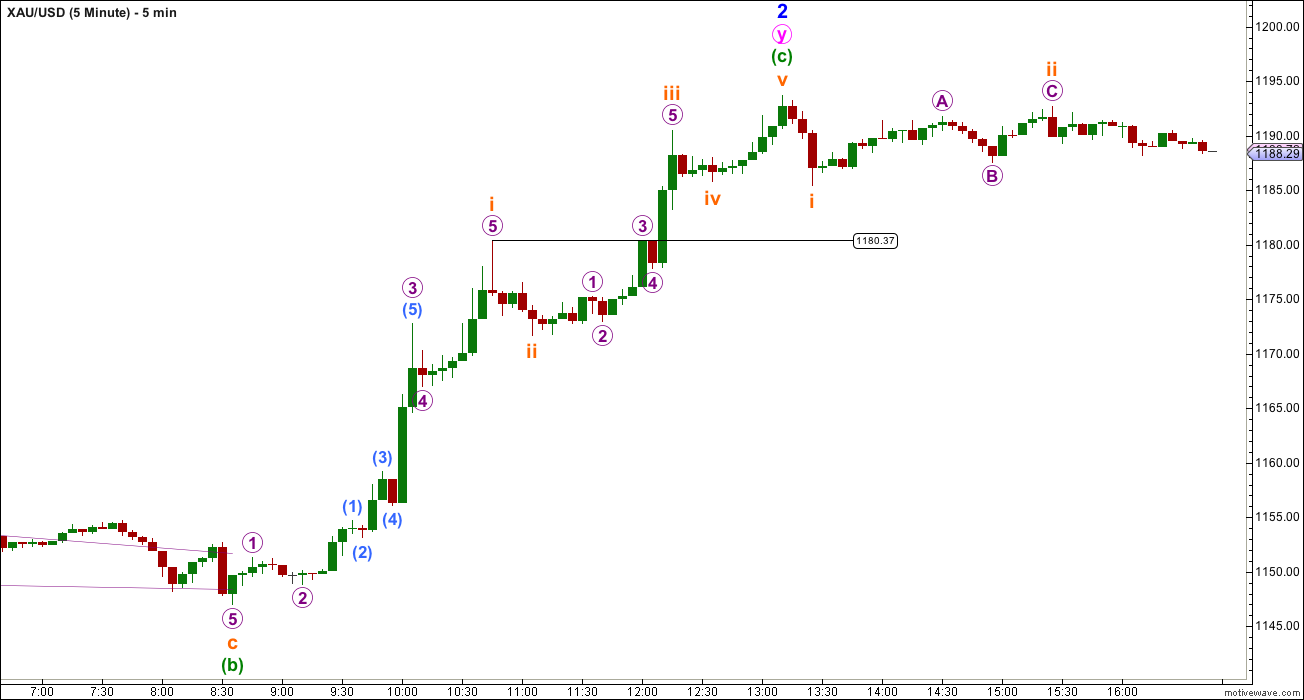
On the five minute chart the structure for minuette wave (c) is a perfectly complete five wave impulse. However, there is not enough downwards movement at the end of Friday’s session to confirm this movement is over. I have provided the five minute chart for this structure below.
Movement below 1,180.37 may not be a fourth wave correction within minuette wave (c) and so at that stage minuette wave (c) would most likely be over. I will have some confidence that minor wave 2 is over when price moves below 1,180.37. I would have full confidence below 1,146.98 as at that point downwards movement could not be a second wave correction within minuette wave (c) and so minuette wave (c) must be over.
This analysis is published about 06:52 p.m. EST.
? I’m not sure.
An alternate wave count which made sense of that idea would need to be considered.
Gold reenter the consolidation downward flag with huge volume. Plus volume for the day was high. Such action are turning point and could it be that PM sector has bottomed here. Gold still within this wave 2 can go higher and touch the upper trend line at $1220????
Yes, of course it can go higher. That’s why I’m providing confidence points which must be passed before I’m confident that this second wave correction is over.
How is the possibility that gold take support and move upward? How would the wave count change?
I have to be honest Lara, I would be absolutely flabbergasted if this turns right around and heads south!! good luck all!
me too only because USD looks to have put in a key reversal day and the gold breakout was on strong volume. Long overdue pullback in the dollar should see gold rally for another couple weeks towards $1250-$1270 until the Swiss Gold Referendum on 11/30. Thanks Lara!
not to mention this is coming in on some cycle turn dates….time will tell
Yeah, I have the same feeling, I admit Lara analytical prediction is very precise, but every time in the big turn, the gold will run ahead of Lara prediction, it will not come at that low and already turned the big trend. So be careful this time happen also.
Your comment is factually incorrect. I am not wrong every time when gold makes big moves.
I was right back in April 2013 in predicting a strong downwards movement: http://elliottwavegold.com/2013/04/gold-elliott-wave-technical-analysis-10th-april-2013/
And I was right in picking a low for a third wave on 26th June, 2013 with a target for the fourth wave at 1,425.37. That target was only $8.49 below where the fourth wave reached it’s price extreme: http://elliottwavegold.com/2013/06/gold-elliott-wave-technical-analysis-26th-june-2013/
So no, I’m not always wrong. Sometimes I’m actually right.
Lara,
Don’t misunderstand me. I am really admire your techniques and analysis. I just learn lesson from myself, everytime I do not take your advice, the wave comes as what you predicted, and then when i take your advice,(most of the time the situation is you announced the trend is going to have a big turn, but before of the turn, the price will continue a little further on the trend to the target before the big turn change), the turn will come earlier than expects. Just like the case this time, you predict the Primary 5 is going to end at about 950, I still believes follows your advice that price will go further down to near 1000 before the trend turn. But I think I prefer to bet earlier this time on the mining stock, even the price of gold go lower, it has only a little downward further, but it have a lots of advance on the other way around.
You are nearly always right! I admitted that 🙂