
A new low below 1,181.56 confirmed the alternate hourly Elliott wave count. At that stage downwards movement to 1,173 was expected. Price reached 2.18 short of this target before turning up.
Summary: Over the next few days I would expect to see an increase in upwards momentum. The target is at 1,251 for the short term, which may be met in two or three days.
Click on charts to enlarge
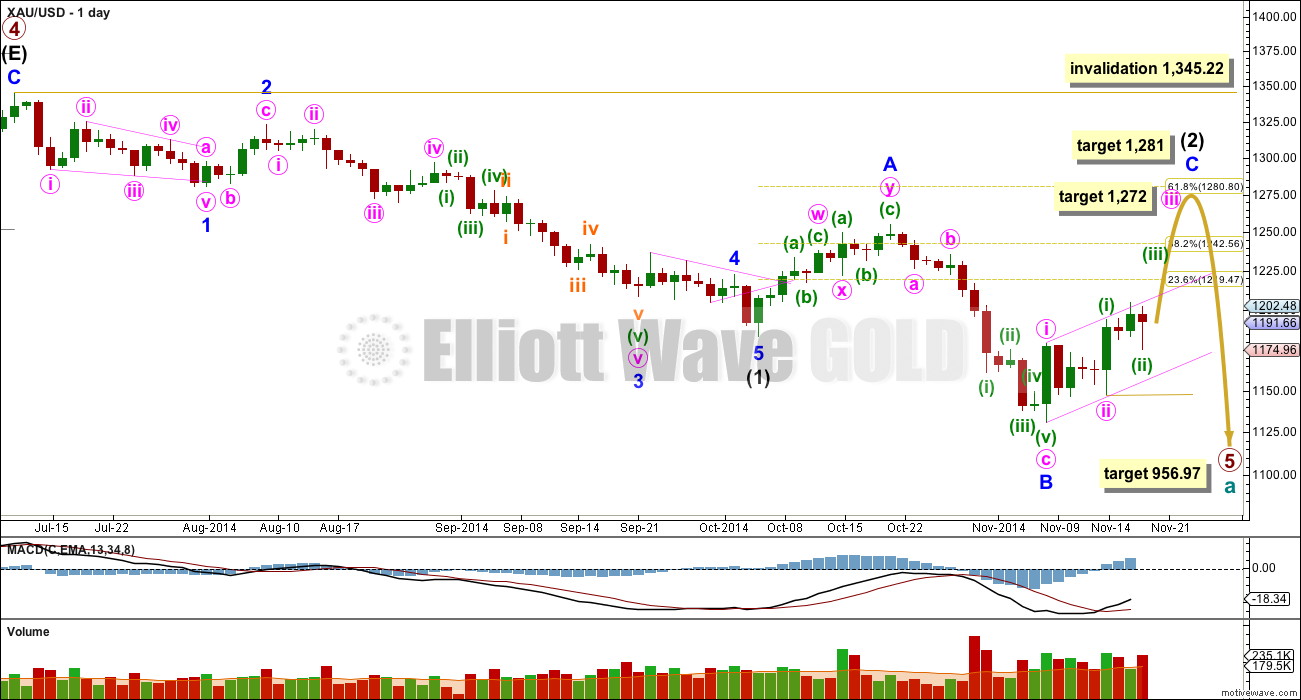
Primary wave 4 is complete and primary wave 5 is unfolding. Primary wave 5 may only subdivide as an impulse or an ending diagonal. So far it looks most likely to be an impulse.
Within primary wave 5 intermediate wave (1) fits perfectly as an impulse. There is perfect alternation within intermediate wave (1): minor wave 2 is a deep zigzag lasting a Fibonacci five days and minor wave 4 is a shallow triangle lasting a Fibonacci eight days, 1.618 the duration of minor wave 2. Minor wave 3 is 9.65 longer than 1.618 the length of minor wave 1, and minor wave 5 is just 0.51 short of 0.618 the length of minor wave 1. I am confident this movement is one complete impulse.
Intermediate wave (2) is an incomplete expanded flat correction. Within it minor wave A is a double zigzag. The downwards wave labelled minor wave B has a corrective count of seven and subdivides perfectly as a zigzag. Minor wave B is a 172% correction of minor wave A. This is longer than the maximum common length for minor wave B at 138%, but within the allowable range of less than twice the length of minor wave A. Minor wave C may not exhibit a Fibonacci ratio to minor wave A, and I think the target for it to end would best be calculated at minute degree. At this stage I would expect intermediate wave (2) to end close to the 0.618 Fibonacci ratio of intermediate wave (1) just below 1,281.
Within minor wave C minute wave iii would reach 2.618 the length of minute wave i at 1,272. I am using this ratio now to calculate this target because of the length of minuette wave (i), and the target for minuette wave (iii).
Intermediate wave (1) lasted a Fibonacci 13 weeks. So far intermediate wave (2) is in its sixth week. I will expect it may continue for another two weeks at least to total a Fibonacci eight, and be 0.618 the duration of intermediate wave (1).
The target for primary wave 5 at this stage remains the same. At 956.97 it would reach equality in length with primary wave 1. However, if this target is wrong it may be too low. When intermediate waves (1) through to (4) within it are complete I will calculate the target at intermediate degree and if it changes it may move upwards. This is because waves following triangles tend to be more brief and weak than otherwise expected. A perfect example is on this chart: minor wave 5 to end intermediate wave (1) was particularly short and brief after the triangle of minor wave 4.
Intermediate wave (2) may not move beyond the start of intermediate wave (1) above 1,345.22. I have confidence this price point will not be passed because the structure of primary wave 5 is incomplete because downwards movement from the end of the triangle of primary wave 4 does not fit as either a complete impulse nor an ending diagonal.
Draw a base channel about minor wave C: draw the first trend line from the start of minute wave i to the end of minute wave ii, then place a parallel copy on the end of minute wave i. Copy this pink channel over carefully to hourly charts. Minute wave iii should have the power to break above the upper edge of this channel. Along the way up downwards corrections should find support and not break below the lower edge of this channel.
To see a prior example of an expanded flat correction for Gold on the daily chart, and an explanation of this structure, go here.
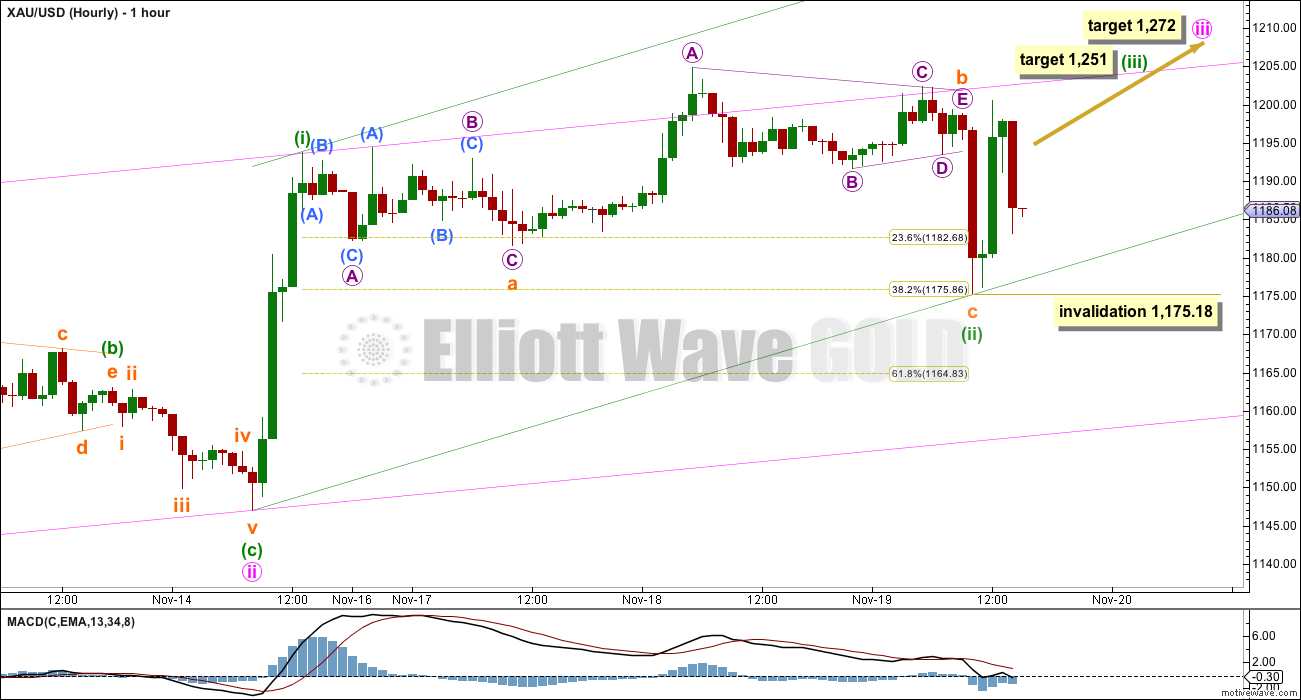
Sideways and then downwards movement confirmed this hourly wave count. Minuette wave (ii) continued further as an expanded flat correction, and managed to reach back down to the 0.382 Fibonacci ratio of minuette wave (i). Within minuette wave (ii) subminuette wave b moved sideways as a regular contracting triangle, and brings the length back down to 142% the length of subminuette wave a. This is now only a little longer than the maximum common length of 138% the length of subminuette wave a. There is no Fibonacci ratio between subminuette waves a and c.
Because minuette wave (ii) is now lasting three days I would expect it is extremely likely it should be over here. Within minuette wave (iii) no second wave correction should move beyond the start of its first wave below 1,175.18. If this price point is breached in the next 24 hours I would expect initially that minuette wave (ii) is continuing further sideways as a double flat correction, but with the duration already at three days I expect this possibility has such a low probability I do not want to publish a chart for it to give it undue weight.
Minuette wave (iii) would reach 1.618 the length of minuette wave (i) at 1,251. Minuette wave (iii) within minute wave iii is the middle of a third wave, and so it should show a clear strong increase in upwards momentum.
At 1,272 minute wave iii would reach 2.618 the length of minute wave i. This higher target fits with the expectation of minuette wave (iii).
Because minuette wave (ii) shows so clearly on the daily chart I will expect its corresponding fourth wave to also show on the daily chart. When minuette wave (iii) is a completed five wave impulse structure then I will expect Gold to enter another consolidation phase for one to five days for a fourth wave correction.
Draw a base channel also about minuette waves (i) and (ii). Look for downwards corrections to find support at the lower green trend line. If this lower green trend line is breached that may be the earliest indication the wave count at the hourly chart is wrong and instead minuette wave (ii) may be continuing sideways as a double flat. The invalidation point for this idea is at 1,146.98.
This analysis is published about 03:24 p.m. EST.
Of course.
I take the very unpopular view that each market is separate. When I look at weekly charts of EUR/USD next to Gold I notice they do not turn together. So I’m not seeing why anyone would expect them to now move together.
Lara is it possible that gold has a big up wave and euro/usd
has a big down wave at the same time?
wave count is officially a mess with gold and that’s unusual.
Only if you’re the one who gets to officially decide if its a mess, or not.
A more helpful comment would be one which addresses specifically which aspect of the wave count you think is wrong / unlikely. Saying it’s a mess is too vague for me to reply to.
Chapstick_jr
I though the wave count with gold was great and made thousands today with it.
I believe if you think it is a mess it may be because you don’t understand it. I did and it worked for me. Good luck.
Lara and Richard, I was making a real-time comment when wave 2 nearly retraced more than 100%. All is good and I’ve been long for a week. No need to panic!
No worries.
Its a shame that third waves don’t always begin cleanly. It would be so much easier for my analysis and your trading if they did!
Next price points to watch are 1175 and upper rail point.
From price and volume analysis gold had false break out yesterday and got back inside the upward bearish flag (pink channel). Today on COMEX contract daily price did not breach the upper rail despite 60% higher volume than previous day.
Yes gold needs to breach bottom rail at 1175. I will be watching tomorrow if gold moves towards upper or lower rails. On day chart your day candle looks like a hammer but on COMEX daily chart it is a long red body with long tail below.
Once again a great analysis and good learning. Thanks.