
Downwards movement continued as expected, but reached well below the target which was at 1,182. A red candlestick was expected for Friday.
Summary: It is now likely that downwards movement is complete for now. The target for the next wave up is at 1,278 – 1,281. It may be met in a Fibonacci 8 or 13 days. Movement above 1,196.03 would provide confidence in this trend change at minor degree.
Click on charts to enlarge.
Main Wave Count
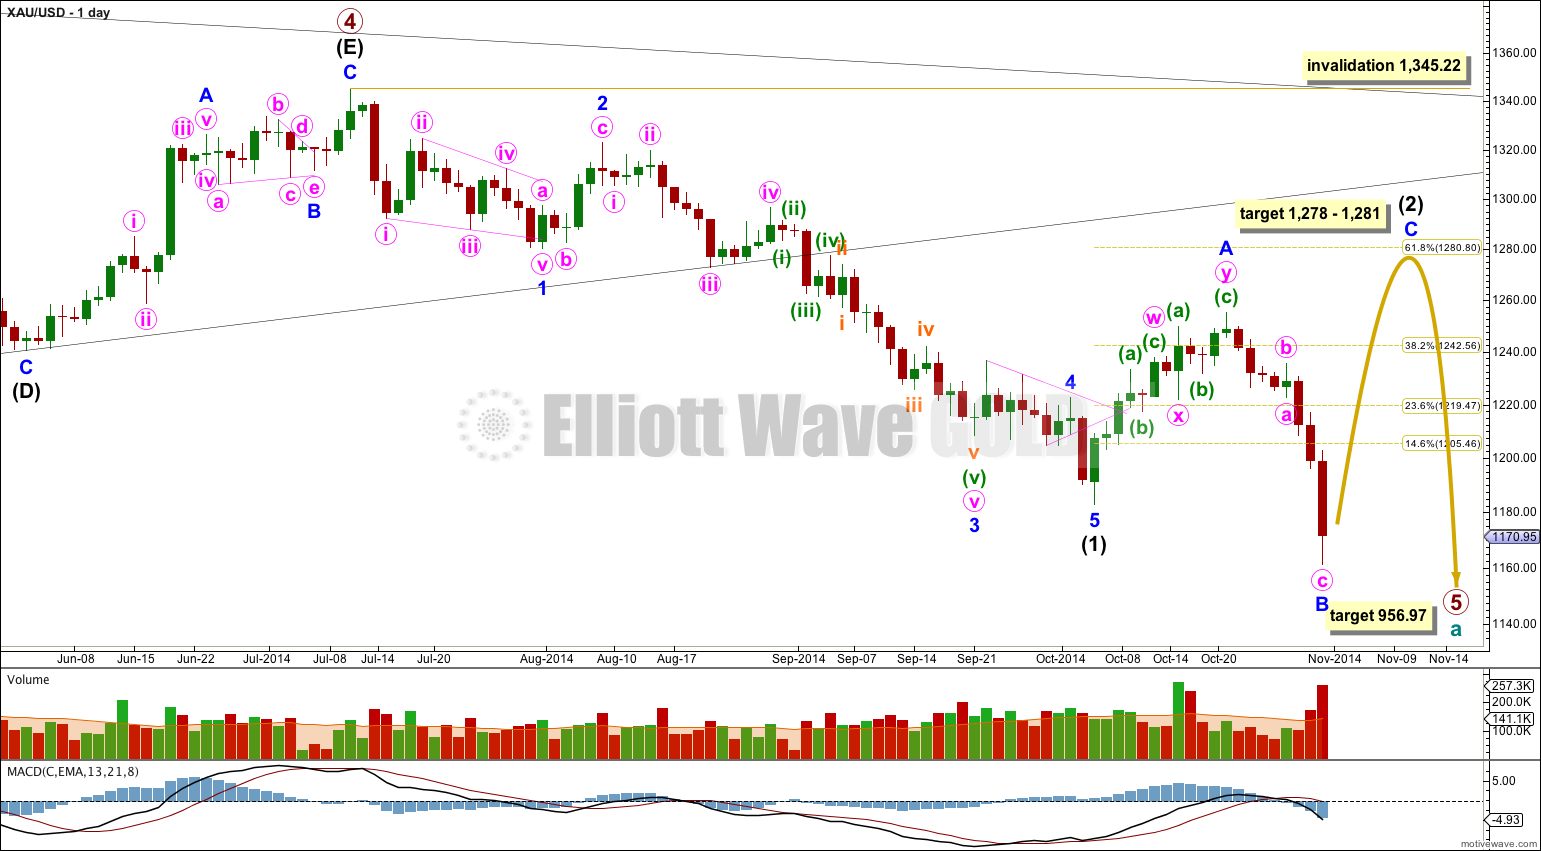
On the weekly chart extend the triangle trend lines of primary wave 4 outwards. The point in time at which they cross over may be the point in time at which primary wave 5 ends. This does not always work, but it works often enough to look out for. It is a rough guideline only and not definitive. A trend line placed from the end of primary wave 4 to the target of primary wave 5 at this point in time shows primary wave 5 would take a total 26 weeks to reach that point, and that is what I will expect. Primary wave 5 is in its 16th week.
At 956.97 primary wave 5 would reach equality in length with primary wave 1. Primary wave 3 is $12.54 short of 1.618 the length of primary wave 1, and equality between primary waves 5 and 1 would give a perfect Elliott relationship for this downwards movement.
However, when triangles take their time and move close to the apex of the triangle, as primary wave 4 has, the movement following the triangle is often shorter and weaker than expected, and this is my main reason for presenting the alternate wave count to you. If the target at 956.97 is wrong it may be too low. In the first instance I expect it is extremely likely that primary wave 5 will move at least below the end of primary wave 3 at 1,180.40 to avoid a truncation. When intermediate waves (1) through to (4) within primary wave 5 are complete I will recalculate the target at intermediate degree because this would have a higher accuracy, and the target may move higher. I cannot do that yet; I can only calculate it at primary degree.
Movement comfortably below 1,180.84 provides confidence in this main wave count. Primary wave 4 is now confirmed as over, as the only remaining possibility for it to continue as a barrier triangle is invalidated.
Intermediate wave (2) is an incomplete expanded flat correction. Expanded flats are the most common type of flat. Minor wave B is a 130% correction of minor wave A, nicely within the normal range of 100% to 138%. At 1,278 minor wave C would reach 1.618 the length of minor wave A. At 1,281 intermediate wave (2) would reach the 0.618 Fibonacci ratio of intermediate wave (1). This gives a small $2 target zone with a high probability.
I would expect minor wave C to last about a Fibonacci 8 or 13 days, with 13 more likely. It may only subdivide as an impulse or ending diagonal, and an impulse is much more likely.
Main Hourly Wave Count
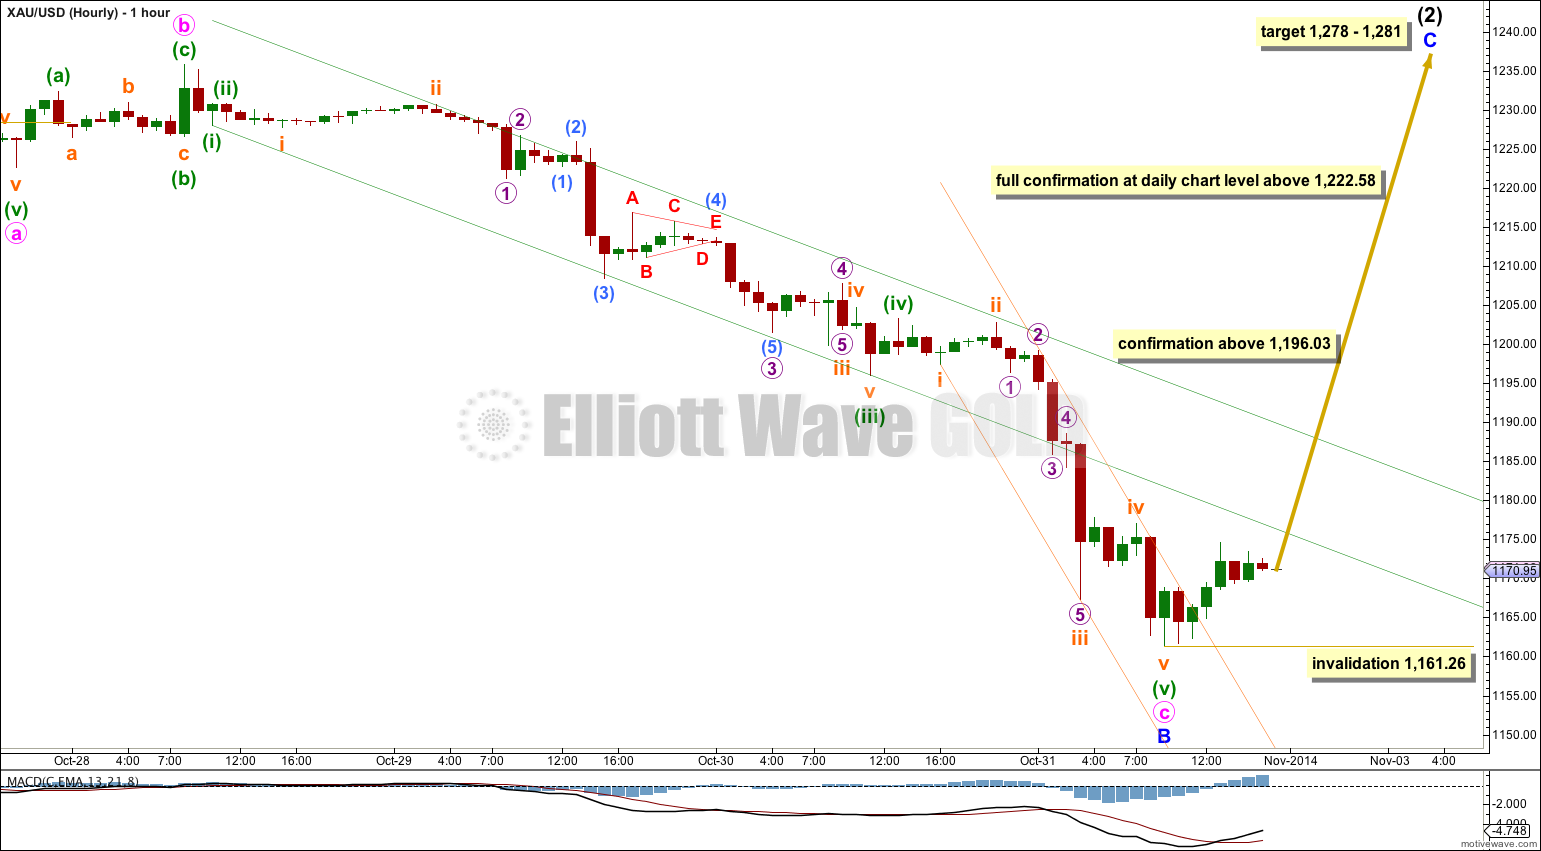
The structure within minute wave c is now complete. I have adjusted the labelling within it to better fit the subdivisions on the five minute chart, specifically the end of subminuette wave iii within minuette wave (iii) as that piece of movement is a three and not a five (thanks Chapstick).
There is no Fibonacci ratio between minute waves a and c.
Ratios within minute wave c are: minuette wave (iii) is 1.93 longer than 4.236 the length of minuette wave (i), and there is no Fibonacci ratio between minuette wave (v) and either of (i) or (iii). Both minuette waves (iii) and (v) are extended, with minuette wave (v) a typically strong extension often seen in commodity markets.
Ratios within minuette wave (iii) are: there is no Fibonacci ratio between subminuette waves iii and i, and subminuette wave v is 0.70 longer than 2.618 the length of subminuette wave i. Subminuette wave iii ends with a slightly truncated fifth wave for micro wave 5, but the subdivisions are a perfect fit on the five minute chart.
Ratios within minuette wave (v) are: there is no Fibonacci ratio between subminuette waves iii and i, and subminuette wave v is 0.55 longer than 2.618 the length of subminuette wave i.
Minuette wave (v) breaches the lower edge of the channel drawn using Elliott’s first technique about minute wave c. Strong fifth waves for commodities often do this.
A channel drawn using the same technique about minuette wave (v) is clearly breached by upwards movement. This is earliest indication that minuette wave (v) should be over.
Movement above 1,196.03 would invalidate the alternate hourly wave count below and so provide confidence in this trend change at minor degree.
Movement above 1,222.58 would invalidate both alternate daily wave counts and so provide full and final confirmation of this main wave count at the daily chart level and at intermediate wave degree.
Alternate Hourly Wave Count
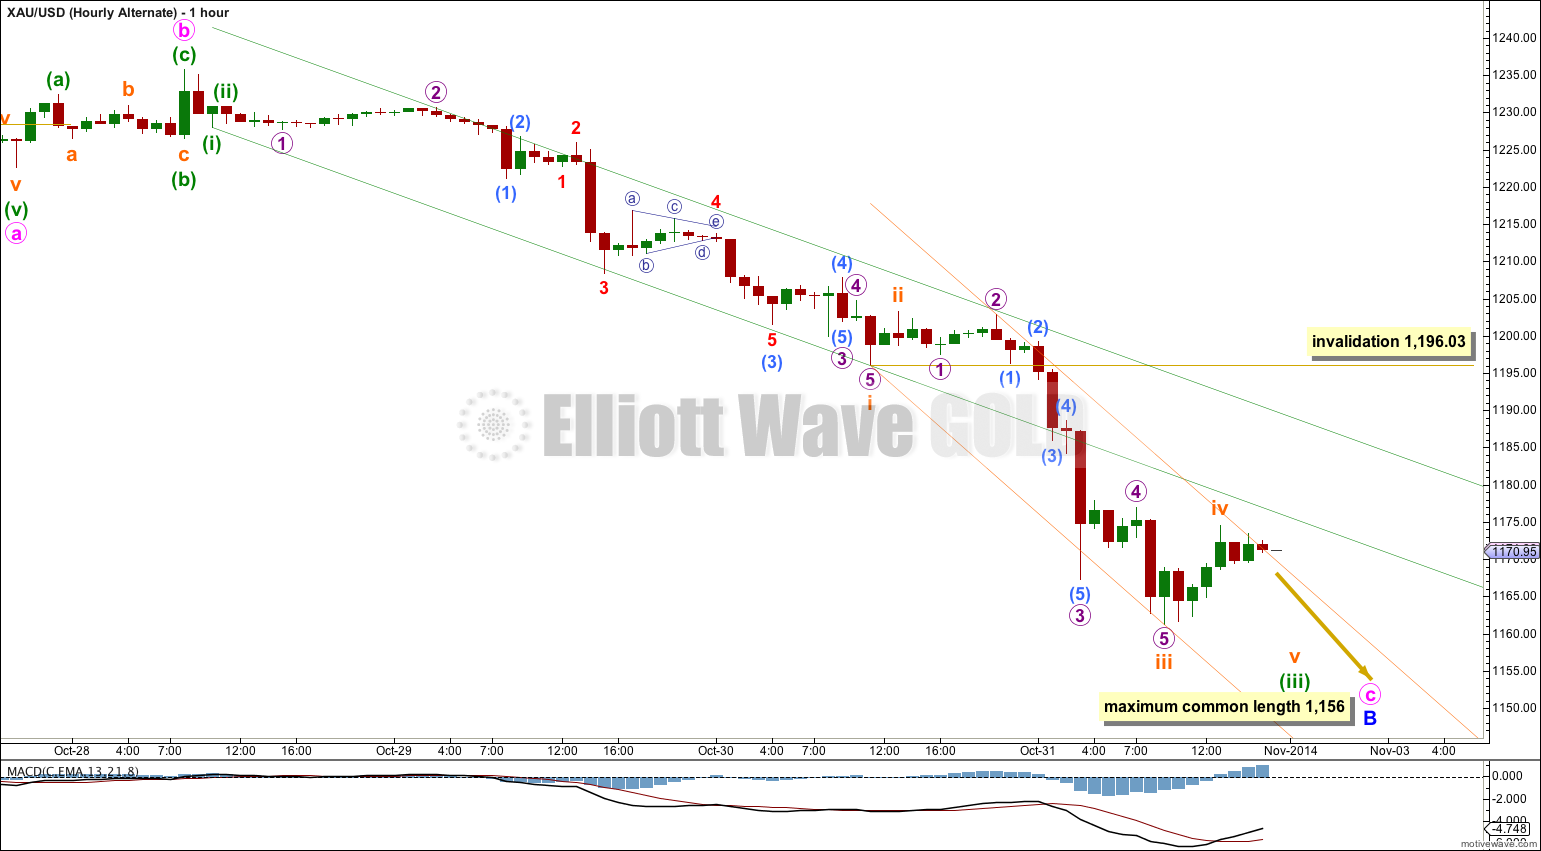
Here I have simply moved the degree of labelling within most of minute wave c all down one degree. It is possible (but unlikely) that minute wave c is not over, and that Friday’s strong downwards movement was the middle of its third wave.
For this alternate idea I would expect not much more downwards movement with one more fourth wave correction along the way down. The maximum common length for minor wave B within this expanded flat correction is up to 138% the length of minor wave A at 1,156.
Subminuette wave iv may not move into subminuette wave i price territory above 1,196.03.
Alternate Daily Wave Count I
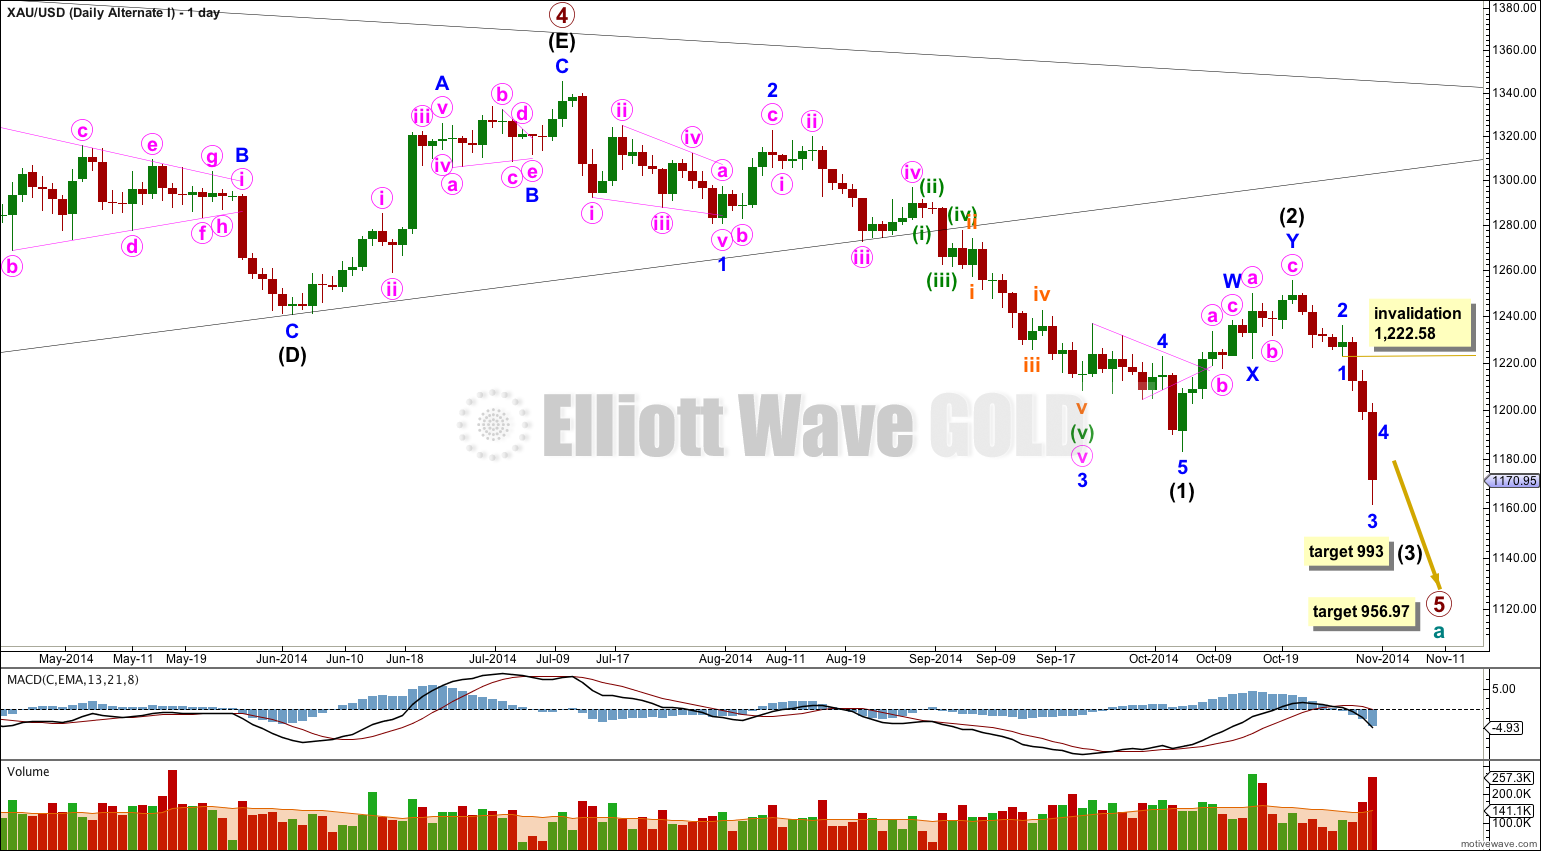
It is possible that the double zigzag is a completion of intermediate wave (2), but this idea has a very low probability.
This would see intermediate wave (2) only 45% of intermediate wave (1), but more importantly it would have lasted only 11 days in comparison to the 62 days for intermediate wave (1). This is too brief to give the wave count the “right look” on the daily chart.
So far intermediate wave (3) is incomplete (and the degree of labelling within it may yet be moved down one degree). So far only a 1-2-3 down is complete. A following fourth wave may not move into first wave price territory above 1,222.58.
At 993 intermediate wave (3) would reach 1.618 the length of intermediate wave (1).
Alternate Daily Wave Count II
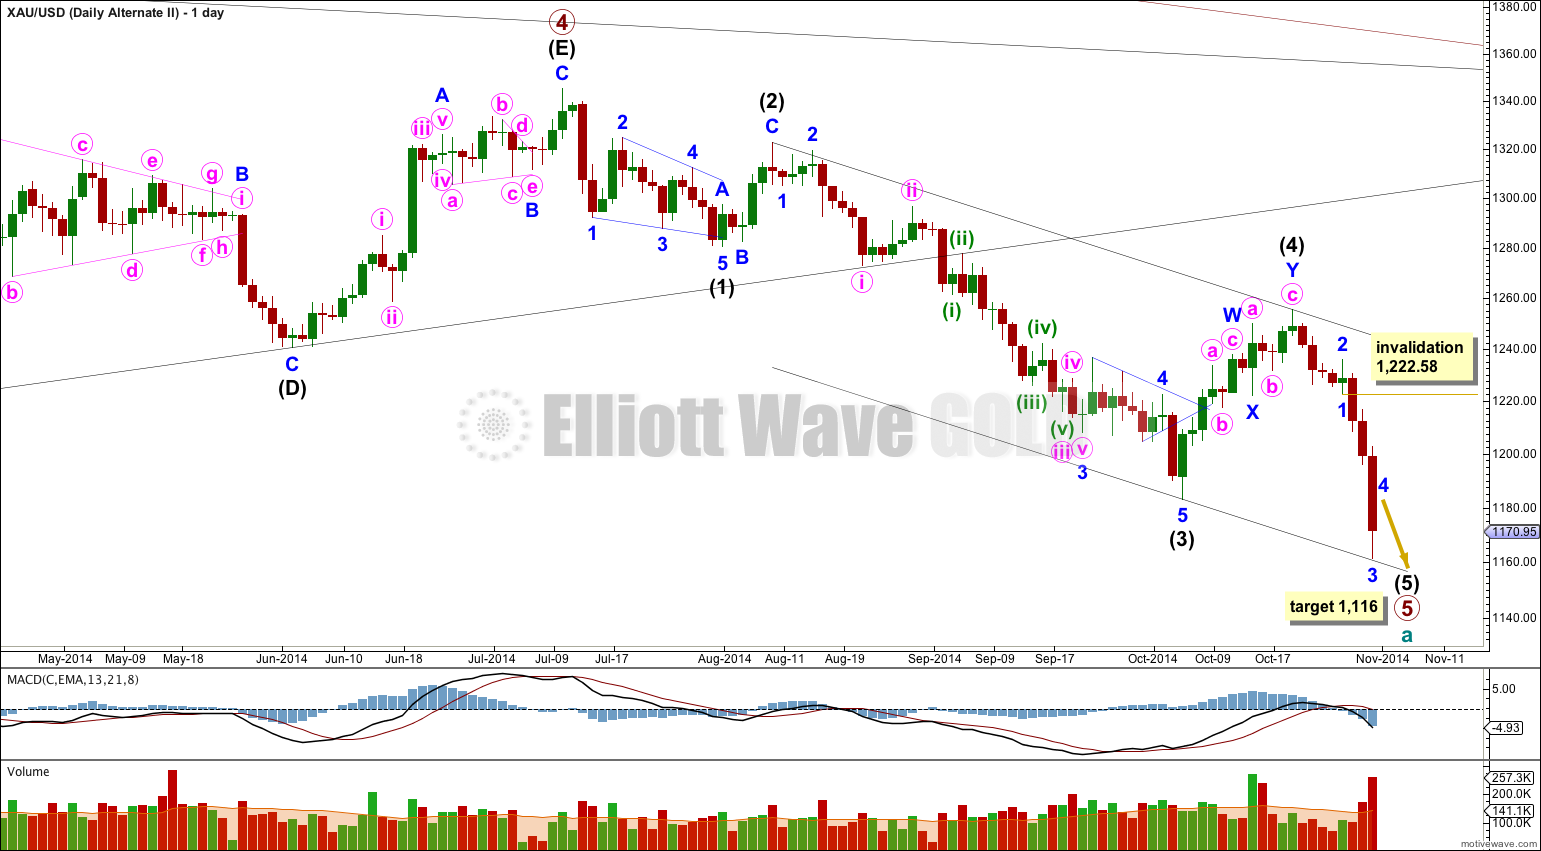
It is possible that primary wave 5 is nearing its end, but this idea has a rather low probability.
This wave count moves the degree of labelling within primary wave 5 all up one degree. There is no divergence in expected direction. The divergence will only come after this current downward wave is done.
The biggest problem with this wave count is the lack of alternation between intermediate waves (2) and (4): intermediate wave (2) is a deep 65% single zigzag lasting a Fibonacci 5 days and intermediate wave (4) is a somewhat deep 52% double zigzag lasting 11 days. Single and double zigzags are different structures, but they are very similar and belong to the same family. It is not common to see one in a second wave position and the other in a corresponding fourth wave position, especially when both are close to similar depth.
There is no Fibonacci ratio between intermediate waves (3) and (1) so this wave count would expect to see a Fibonacci ratio between intermediate wave (5) and either of (1) or (3). If intermediate wave (5) were to reach equality in length with intermediate wave (1) it would be truncated. At 1,116 intermediate wave (5) would reach equality in length with intermediate wave (3).
Within intermediate wave (5) minor wave 4 may not move into minor wave 1 price territory above 1,222.58.
This analysis is published about 08:18 p.m. EST.
GDX also had a wave 4 triangle. Current GDX count would support the main count in gold also. GDX goes up for Minor wave 2 and Gold completes wave c of Intermediate wave 2 flat.
Newmont Mining… that’s not a market I’ve looked at. I would only take that structure as indicative of a wave count for Gold IF it regularly turns at the same times as Gold. Does it?
What is the symbol for Newmont in Yahoo Finance Bob?
NEM is the 3rd largest component of GDX and they track each other very close. I think your GDX analysis is sufficient.
That’s good. Doing yet another market weekly… probably not going to happen at this time.
Either 8 or 13 days to 1,278 – 1,281.
But thats only if minor wave C exhibits a Fibonacci duration. Gold does this quite a lot, but not always.
8-13 days for the tgt 1178-81??
Newmont mining, NEM, has a triangle for the October correction. Alternation is present. Shifts probability a little toward Alt II. Commodity type five of five liquidation spike?
CORN is impulsing nicely off what may be a major low. Quite beautiful. I only have daily charts.
While not always, gold often has an inverse relationship with the U.S. Dollar. The attached chart from Kimble Charting shows that the USD is up against a 10 year trend line. If the USD breaks to the upside, gold may continue down. Something to keep an eye on.
A very interesting chart of USD, thanks!
The data I have on my FXCM feed for US dollar only goes back to Nov, 2011. Its most annoying. I’ve not updated my USD wave count for a while now.
Lara, tonight’s analysis is very reassuring. Your have presented an extremely informative and helpful combination of charts, written explanation and video and audio explanation that is in one word, SUPERLATIVE, expresses the extreme or highest degree of quality.
Now I’ll relax and enjoy the weekend and have a plan of action for profiting in gold next week. A sincere Thank You!
Thank you Richard.
I sure hope I’m right!
Silver looks like it’s done too, but GDX looks like it needs one final small fifth wave down.