
Movement below 1,161.26 invalidated the main Elliott wave count and confirmed the two alternates.
Summary: I expect a green candlestick or a small doji for Thursday’s session as a second wave unfolds. Expect any surprises from here on to be to the downside as the middle of an intermediate degree third wave is approaching.
Click on charts to enlarge.
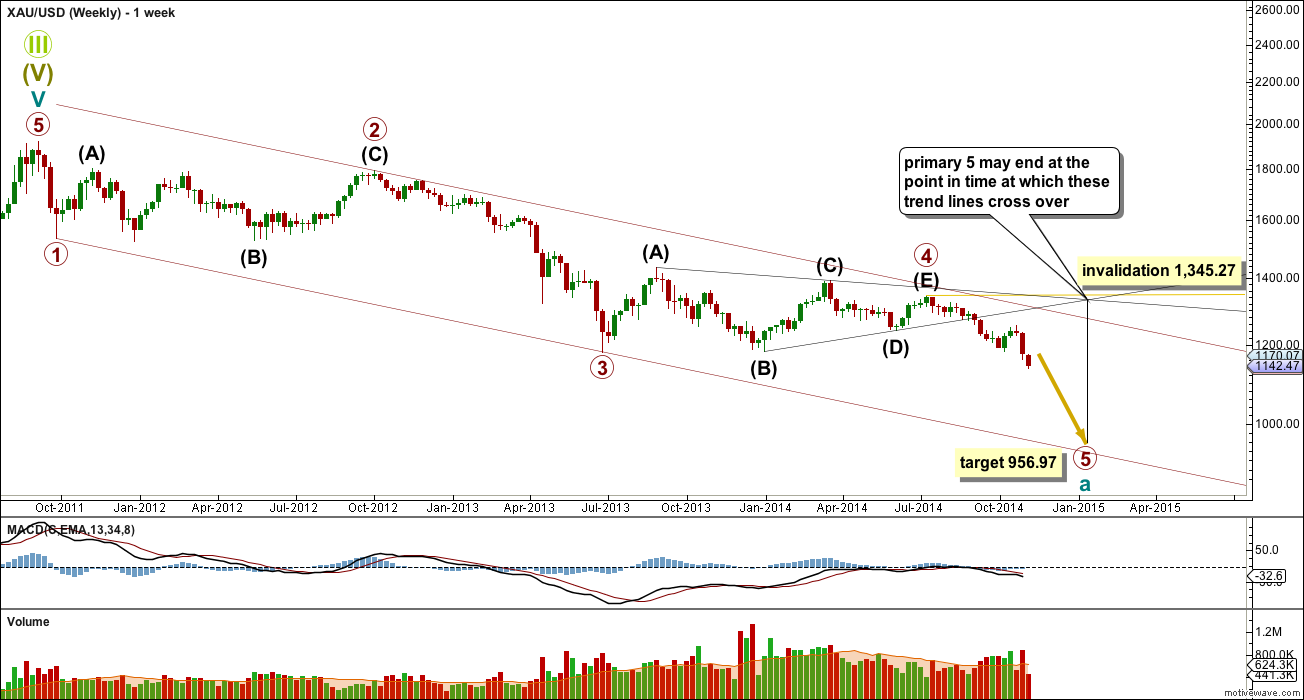
At the weekly chart level this wave count has a textbook perfect look, typical for Gold. Primary wave 2 is a rare running flat lasting 53 weeks, and is a deep 68% correction. Primary wave 4 is a regular contracting triangle lasting 54 weeks, and is a shallow 27% correction. The perfect proportion and the almost perfect alternation is what gives this wave count such a typical look.
If primary wave 5 ends at the lower edge of the channel, at the target of 956.97 where it is equal in length with primary wave 1, and at the point in time at which the triangle trend lines cross over, it would last a total 26 weeks. The cross over point of the triangle trend lines extension does not always reflect that’s when a trend change will occur, but sometimes it does. This time expectation cannot be definitive and is a rough guideline only.
Within primary wave 5 no second wave correction may move beyond the start of its first wave above 1,345.27.
Main Wave Count
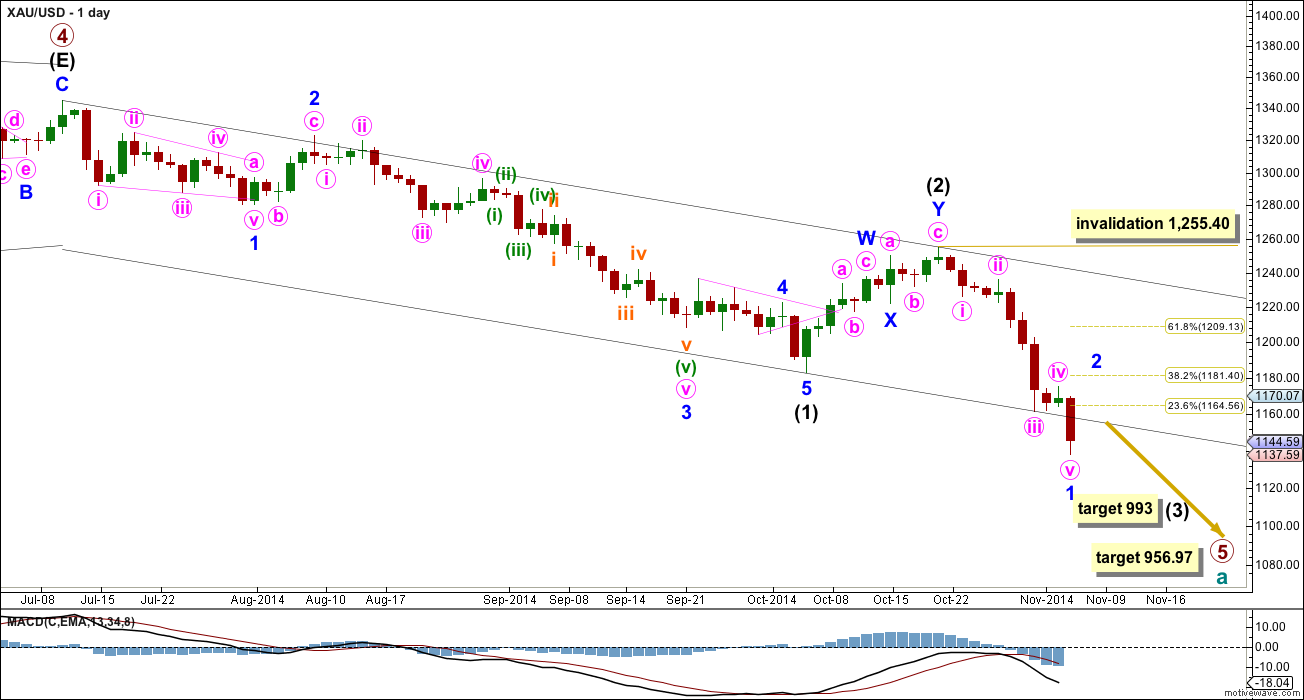
This is the new main wave count (previously it was the first alternate). Primary wave 4 is complete and primary wave 5 is unfolding.
Primary wave 5 may only subdivide as an impulse or an ending diagonal. So far it looks most likely to be an impulse.
Within primary wave 5 intermediate wave (1) fits perfectly as an impulse. Intermediate wave (2) is a relatively shallow 45% double zigzag correction.
Intermediate wave (3) may only subdivide as an impulse, and at 993 it would reach 1.618 the length of intermediate wave (1).
The target for primary wave 5 at this stage remains the same. At 956.97 it would reach equality in length with primary wave 1. However, if this target is wrong it may be too low. When intermediate waves (1) through to (4) within it are complete I will calculate the target at intermediate degree and if it changes it may move upwards. This is because waves following triangles tend to be more brief and weak than otherwise expected. A perfect example is on this chart: minor wave 5 to end intermediate wave (1) was particularly short and brief after the triangle of minor wave 4.
Intermediate wave (3) must move far enough below the end of intermediate wave (1) to allow room for upwards movement for intermediate wave (4) which may not move into intermediate wave (1) price territory. Although a five wave structure downwards can now be seen complete within intermediate wave (3) it has not moved low enough. I will therefore move the degree of labelling within intermediate wave (3) all up one degree and see only minor wave 1 within it complete.
Minor wave 2 may not move beyond the start of minor wave 1 above 1,255.40.
Because this is a second wave correction within a third wave one degree higher it may be more quick and shallow than second waves normally are. I will look initially to only the 0.236 or 0.382 Fibonacci ratios as most likely points for it to end.
The black channel is a base channel about intermediate waves (1) and (2): draw the first trend line from the start of intermediate wave (1) to the end of intermediate wave (2), then place a parallel copy on the end of intermediate wave (1). Intermediate wave (3) should breach the lower edge of the base channel, as it has today, and along the way down upwards corrections should find resistance at the upper end of the base channel and should not breach that upper black trend line.
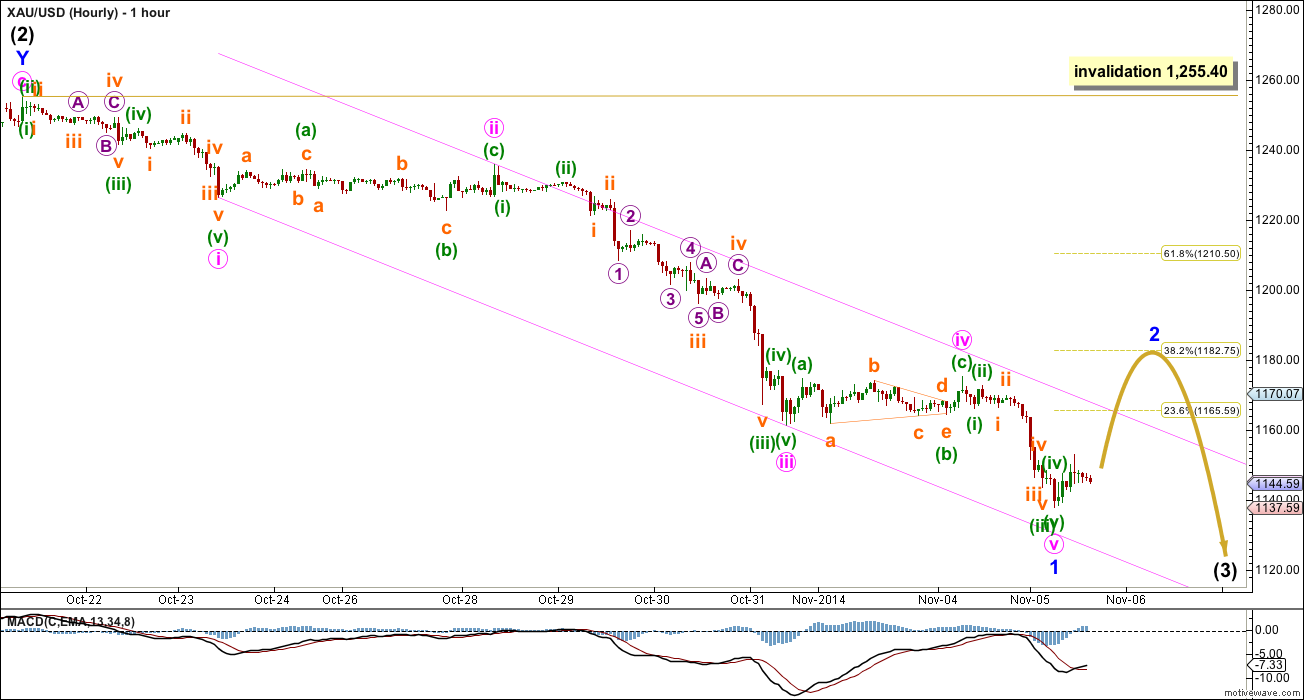
I am zooming out to show all of minor wave 1 today.
Ratios within minor wave 1 are: minute wave iii is just 1.46 short of 2.618 the length of minute wave i, and minute wave v has no Fibonacci ratio to either of minute waves i or iii.
Minute wave iii has the strongest downwards momentum, and there is divergence between price and momentum at the end of this movement. This wave count is supported by MACD.
The subdivisions within minute wave v fit perfectly, and minute wave v is a complete five wave impulse. This piece of the wave count gives me some confidence today that we shall see a green candlestick or doji for Thursday’s session.
Draw a parallel channel about minor wave 1 using Elliott’s first technique: draw the first trend line from the ends of minute waves i to iii, then place a parallel copy on the end of minute wave ii. This almost perfectly contains all this movement. When this channel is very clearly breached by upwards movement that shall be confirmation that minor wave 1 is over and minor wave 2 is underway.
I would expect minor wave 2 to show clearly on the daily chart, as at least one green candlestick or doji. It may last one to three days. Unfortunately, there is no lower invalidation point for minor wave 2. If it is an expanded flat or combination then it may include a new low for its B or X wave. Minor wave 2 is most likely to be a zigzag though, but there are several different structural options.
When minor wave 2 is complete then the next movement should be minor wave 3 within intermediate wave (3) down, which should show a strong increase in downwards momentum.
Alternate Daily Wave Count
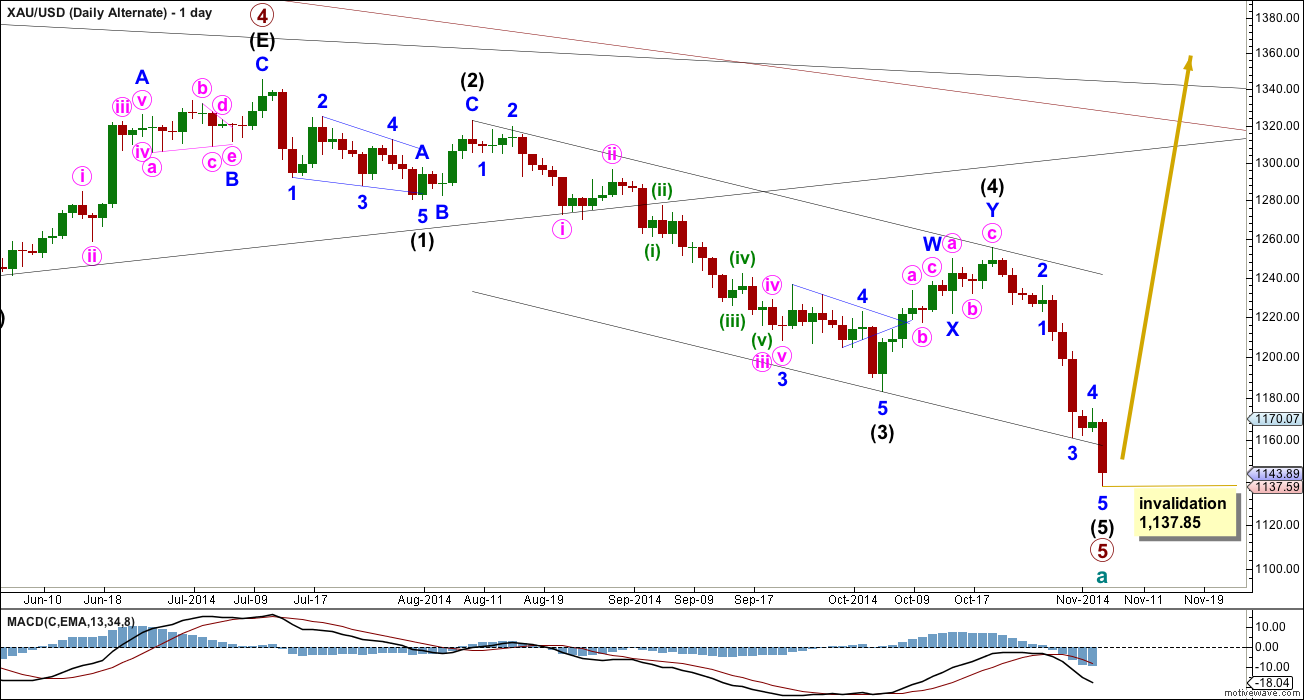
It is possible that primary wave 5 is now over, but this idea has a rather low probability.
For this idea today I am labelling primary wave 5 as complete because the structure within intermediate wave (5) is such a perfect complete impulse and it slightly overshoots the channel drawn about primary wave 5 using Elliott’s second technique. However, with this idea there are no Fibonacci ratios between intermediate waves (1), (3) and (5). This is highly unusual for Gold and further reduces the probability of this wave count.
The biggest problem with this wave count is still the lack of alternation between intermediate waves (2) and (4): intermediate wave (2) is a deep 65% single zigzag lasting a Fibonacci 5 days and intermediate wave (4) is a somewhat deep 52% double zigzag lasting 11 days. Single and double zigzags are different structures, but they are very similar and belong to the same family. It is not common to see one in a second wave position and the other in a corresponding fourth wave position, especially when both are close to similar depth.
If primary wave 5 is over then there has just been a trend change at cycle degree. Within the new upwards trend no second wave correction may move beyond the start of its first wave at 1,137.85.
This analysis is published about 04:54 p.m. EST.