
A new low below 1,221.34 invalidated the alternate hourly Elliott wave count and confirmed the main Elliott wave count.
Summary: Gold should be entering a third wave, of a third wave, of a third wave up. Upwards momentum should increase strongly. The short term target is at 1,248. The mid term target remains the same at 1,262.
Click on charts to enlarge
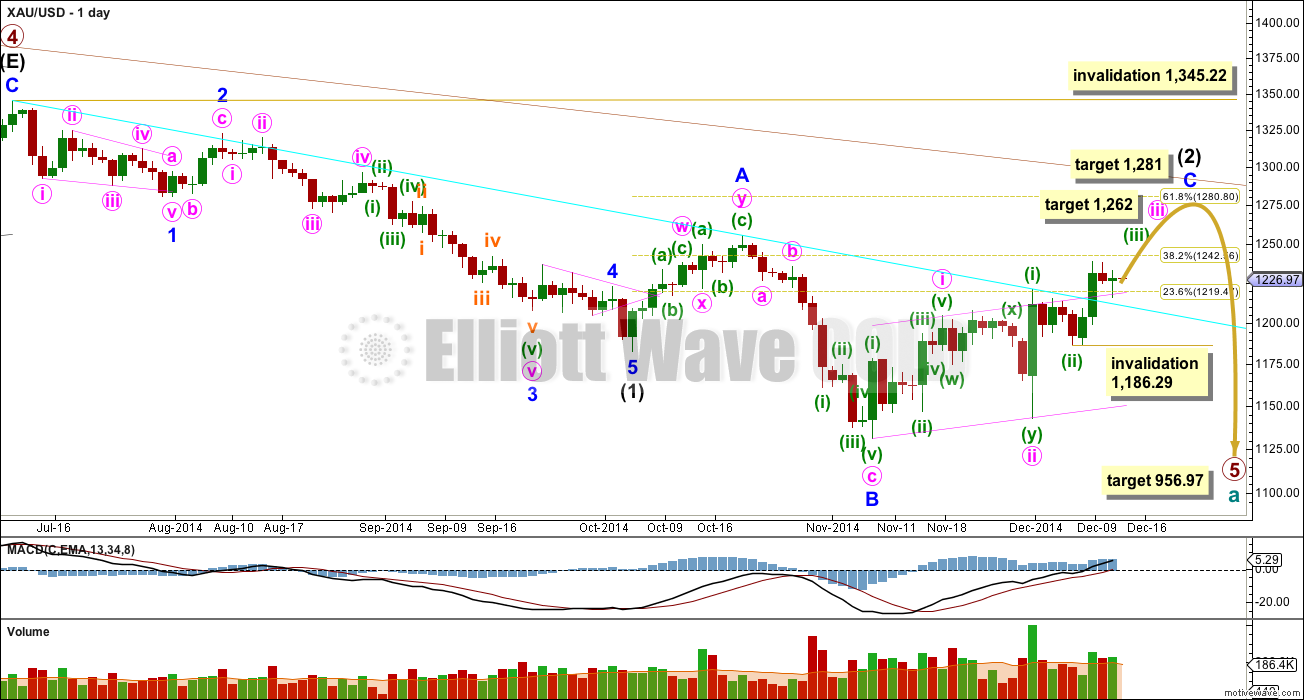
Primary wave 4 is complete and primary wave 5 is unfolding. Primary wave 5 may only subdivide as an impulse or an ending diagonal. So far it looks most likely to be an impulse.
Within primary wave 5 intermediate wave (1) fits perfectly as an impulse. There is perfect alternation within intermediate wave (1): minor wave 2 is a deep zigzag lasting a Fibonacci five days and minor wave 4 is a shallow triangle lasting a Fibonacci eight days, 1.618 the duration of minor wave 2. Minor wave 3 is 9.65 longer than 1.618 the length of minor wave 1, and minor wave 5 is just 0.51 short of 0.618 the length of minor wave 1. I am confident this movement is one complete impulse.
Intermediate wave (2) is an incomplete expanded flat correction. Within it minor wave A is a double zigzag. The downwards wave labelled minor wave B has a corrective count of seven and subdivides perfectly as a zigzag. Minor wave B is a 172% correction of minor wave A. This is longer than the maximum common length for a B wave within a flat correction at 138%, but within the allowable range of twice the length of minor wave A. Minor wave C may not exhibit a Fibonacci ratio to minor wave A, and I think the target for it to end would best be calculated at minute degree. At this stage I would expect intermediate wave (2) to end close to the 0.618 Fibonacci ratio of intermediate wave (1) just below 1,281.
Intermediate wave (1) lasted a Fibonacci 13 weeks. If intermediate wave (2) exhibits a Fibonacci duration it may be 13 weeks to be even with intermediate wave (1). Intermediate wave (2) is now in its ninth week, and so it may continue now for another five weeks in total.
So far within minor wave C the highest volume is on an up day. This supports the idea that at this stage the trend is up.
The upper maroon trend line is the upper edge of the Elliott channel drawn about this impulse on the weekly chart, and copied over here to the daily chart. See the most recent Gold Historic Analysis to see how this trend line is drawn on the weekly chart. If minor wave C lasts long enough it should find extremely strong resistance at that trend line, I would not expect that trend line to be broken while primary wave 5 is incomplete.
The aqua blue trend line is a simple TA trend line which is showing where price is currently finding (*edited) support. The power of the middle of the upcoming third wave has broken above this trend line.
The target for primary wave 5 at this stage remains the same. At 956.97 it would reach equality in length with primary wave 1. However, if this target is wrong it may be too low. When intermediate waves (1) through to (4) within it are complete I will calculate the target at intermediate degree and if it changes it may move upwards. This is because waves following triangles tend to be more brief and weak than otherwise expected. A perfect example is on this chart: minor wave 5 to end intermediate wave (1) was particularly short and brief after the triangle of minor wave 4.
Within minor wave C now the third wave is underway. Within minuette wave (iii) no second wave correction may move beyond its start below 1,186.29.
Intermediate wave (2) may not move beyond the start of intermediate wave (1) above 1,345.22. I have confidence this price point will not be passed because the structure of primary wave 5 is incomplete because downwards movement from the end of the triangle of primary wave 4 does not fit well as either a complete impulse nor an ending diagonal.
To see a prior example of an expanded flat correction for Gold on the daily chart, and an explanation of this structure, go here.
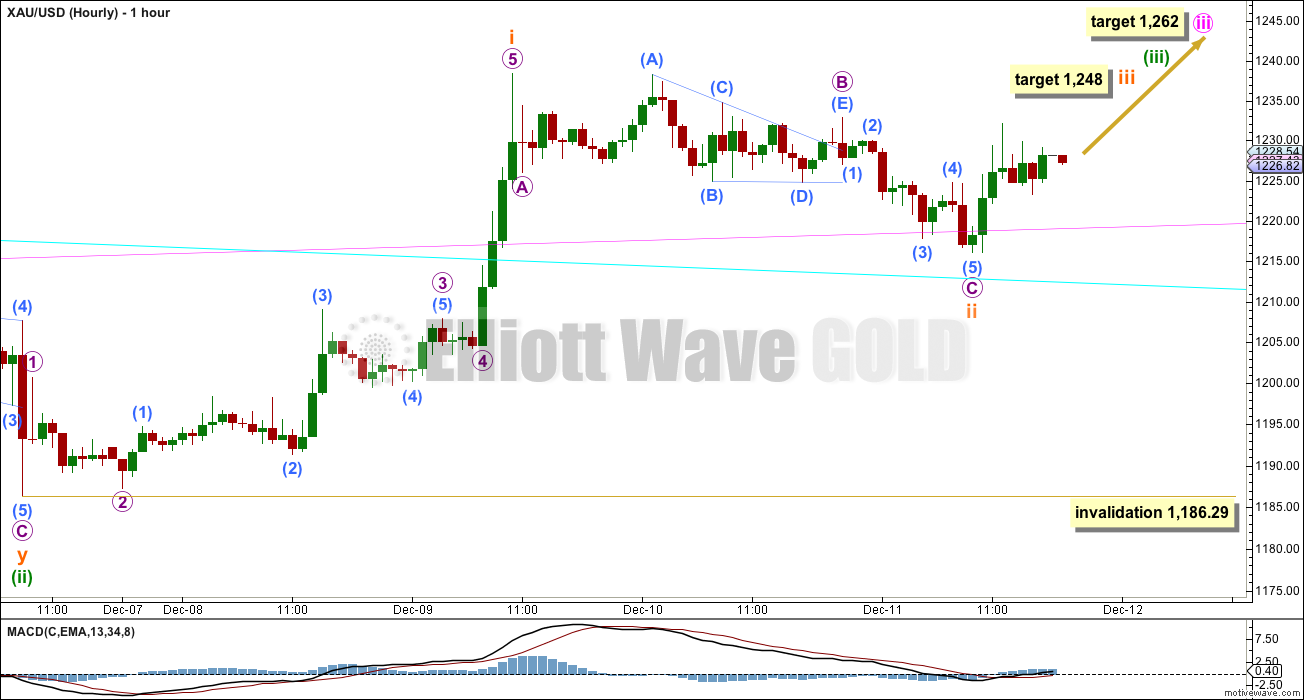
This wave count has been confirmed. We now have a series of three overlapping first and second waves. This indicates a strong increase in upwards momentum should be seen as the middle of a third wave unfolds. It may not be very long though if the target for minute wave iii is correct. At 1,262 minute wave iii would reach 1.618 the length of minute wave i. If this target is wrong it may now be too low.
Within the middle of this third wave at 1,248 subminuette wave iii would reach 0.618 the length of subminuette wave i. When subminuette wave iii is over then the upwards trend should again be interrupted by another sideways consolidation for subminuette wave iv which should be of a similar duration to subminuette wave ii.
At this stage it is highly likely that subminuette wave ii is over as it is nicely in proportion to all other waves: minute wave ii lasted 9 days, minuette wave (ii) lasted 4 days, and now subminuette wave ii has lasted 2 days. If subminuette wave ii continues further then I would expect it to only be for one more day, so that it is more brief than minuette wave (ii) one degree higher.
Subminuette wave ii could continue further as a flat correction, double zigzag, or double combination. This is possible and today this is the risk we must accept. If subminuette wave ii does continue it may not move beyond the start of subminuette wave i below 1,186.29, and I would expect mostly sideways movement. I have checked the structure of the first upwards movement, from the low labelled subminuette wave ii at 1,216.02, on the five minute chart and this movement fits best as a three wave movement and not a five, which gives me some cause for concern that subminuette wave ii may not be over.
I have also checked the subdivisions within micro wave C of subminuette wave ii carefully, particularly the third wave, and it does subdivide nicely on the five minute chart as an impulse.
This analysis is published about 06:46 p.m. EST.
GLD from chartists pt of view
Next BO some day
Lara By 3pm EST can you give us a brief guidance on this position above: : If subminuette wave ii continues further then I would expect it to only
be for one more day (Friday), so that it is more brief than minuette wave (ii)
one degree higher.”
Now three days are over. What to expect on Monday??
Gold will not close above my threshold 1230 today.
Than you in advance.
I’m preparing the analysis now. Clearly the second wave continued. I do think its over now, I do think Friday will end in the earliest stages of a third wave up. I think its already begun a few hours ago at the low of 1,214.37. My short term target for the next upwards move is now at 1,247 and I would expect this to be met on Monday.
Have a channel moving up now…..
maybe…..
If c within (y) = a within (y) target area 1213
if c within (y) = 1,618 * a within (y) target area 1206
Invalidation above 1226,25
This is only my count……is reccomended wait Lara…..
Hi Lara,
Can you please point out in the EWP book where it says flats can reach below the end of impulse waves? Here we have minor wave B of the expanded flat going lower than imtermediate wave 1 black.
Hi Nick,
irregular flat……
http://www.elliottwave.com/tutorial/Lesson4/4-1.htm
Gold is having resistance at 1224 right at the apex of the triangle.
Do you think wave (ii) will have this deep correction?
EWP tenth edition. pages 89 and 90
What does it mean when wave (ii) is complete? Once a wave is complete the next wave should pull the price in the direction of the wave. In this case 3rd of the 3rd of the 3rd wave which is powerful wave.
So far it is not behaving as such.
Lara Thanks for the great update.
Your MotiveWave charting software has a cycle analysis capability.
If it is worth any thing I noticed green wave (ii) ended just before 11AM on Dec 6 and subminuette wave (i) ended approx same time on Dec 9. Today Dec 11 approx subminuette wave (ii) ended same time. So top was halfway in the cycle of two bottoms. Could it be that next top subminuette wave (iii) be on Monday just before 11AM??
What will your software can reveal from cycle analysis if any of this pattern?
Just noticed the timing on tops and bottoms.
Thanks.
I’ve never used the cycle analysis on MW. Where exactly is that please?
Lara, you may want to revise this line from today’s update as the aqua blue trend line now provides support.
“The aqua blue trend line is a simple TA trend line which is showing where price is currently finding resistance. The power of the middle of the upcoming third wave should break above this trend line. If this trend line begins to be breached that may be the earliest indication that the main hourly wave count is correct today. I am copying this trend line over to the main hourly wave count today.”
sorry! thanks Richard. fixed now.